IS DISCREPANCY BETWEEN CONFIDENCE AND SPENDING DRIVEN BY PESSIMISM OR BY HIGH ASPRIATIONS?
Review of the discrepancy between the admitted financial situation and actual spending in Hungary
Csongor Hajdu
PhD candidate, Corvinus University of Budapest, Faculty of Social Sciences Email: csongor.hajdu@yahoo.com
The opinions of people are expected to forecast their actions, and even major economic institutions rely on this correlation. This research paper examines a case when the opinion of people about their financial situation contradicts their financial-related actions. In 2012 in Hungary the general opinion of people about their financial situation was showing the lowest confidence in the world, with a significant declining trend, reaching an extremely low level.
Although the general expectation would be that this pessimism triggers a set-back in consumer spending, figures show that Hungarians were on the other end of the scale regarding their expenditures and were greatly increasing their spending. This raises the question: why do people say they are in such a tough financial situation yet instead of saving they increase their spending? This paper presents a cross-country analysis that reviews the severity of this discrepancy, as well as proves the validity of the question by excluding several alternative explanations, followed by a recommendation and hypotheses for a detailed research to explain the phenomenon.
KEYWORDS: income; spending; savings; confidence; benchmarks;
JEL-codes: D12, E21, H30
1. INTRODUCTION
There is a classic and well-known La Fontaine tale about the ant and the cricket. Ants were busy all summer long gathering food for the winter because they were expecting there will be less food available for them, during winter. The cricket however was just playing its violin and not thinking about the coming winter. As winter came, the cricket was left without any food and had to request help from the ants.
Can we expect the ants’ behavior to be a rational human behavior? When expecting to face a difficult situation, one would start preparing for it by saving?
Recent measures in Hungary indicated that people are becoming less confident about their financial situation, yet measures on their actual spending indicated a major increase. This means that they kept spending more money while expecting their financial situation to get worse. Is this really such a strong contradiction, or are we just disregarding a simple explanation?
Keynesian scholars might expect the increase of spending to be driven by income, not by the confidence. Scholars of Friedman on the other hand might expect that the decline of confidence should decrease spending as well. Behavioral economics might argue that an increase of consumption is probably driven by consumer choices. As this research focuses on the secondary analysis of economic data, the main hypothesis it sets is based on the expectation of main economic institutions (national banks and research agencies) that generate and/or use this data: they expect declining confidence to set back consumption, and this is the basic anticipation of this review as well.
The aim of this paper is to present the validity and importance of the phenomenon in which the actions of people differed from what could have been expected based on their opinion and to propose further research to explain this discrepancy, even if there might be several separate or slightly linked determinants of it.
2. THE ANALYSIS
2.1 The lowest confidence in the world
In 2012 the Nielsen Company prepared a global market research prepared for 56 countries, focusing on the financial confidence of people. Results indicated that Hungarian people were the most pessimistic in the world regarding their financial situation. This survey, called the Consumer Confidence Index (CCI) survey, is a representative opinion poll measuring the level of financial optimism or pessimism by comparing peoples’ answers for 3 questions:
a) what they predict about their job prospects in next 12 months;
b) how they feel about their own personal finance in next 12 months;
c) to what extent they consider their current situation to be suitable for purchasing the goods they want and need;
The index incorporates the answers for the self-evaluation of both present conditions and future expectations. The answers for these questions in the survey add up to a final index- number ranging from 0 to 200, where the value of 100 is considered the average level.
In the second quarter of 2012 the average of the CCI for the measured countries was 91 points; Indonesia being the most optimistic country with 120 points, and Hungary being the most pessimistic one with 30 points. Hungarian confidence indicated a drop from 42 points in the first quarter of 2011 to 30 points in same period of 2012; a decline of 29%. Considering the whole scale of this measure (ranging from 0 to 200) shows the severity of this result: the level of confidence in Hungary was at 15% of total range, and at one-third of the optimistic benchmark.
Is this level of confidence reasonable based on the financial situation of people or the country itself? We need to compare Hungary to other countries in similar situations in order to understand whether this is something extraordinary. Hungary was followed on this list (starting from the most pessimistic end of the scale) by Portugal (40 points), Italy (41), Greece (43), Croatia (45). The next European countries after them were Spain (52), France (61), and Romania (62). Other countries from Central and Eastern Europe (CEE) were Poland (69), the
Baltic countries (70-71), and the Czech Republic (71).
In 2012, when this measure was created, some of the European countries were still struck in economic crisis. The South-European countries like Spain and Greece were suffering especially strongly, but Italy was also close to the edge of being severely impacted. On the one hand, comparing these countries to Hungary would clearly show why such a low level of Hungarian confidence is unusual. The second group to benchmark Hungary to should be those countries that have similar economic and historical backgrounds: Poland, Czech Republic, Romania may be the second group of reference. As a next step, I will investigate the severity of the Hungarian confidence level by comparing the countries’ financial situation to see whether that is line with and explains the confidence.
2.2 Does the wealth of the country determine the confidence?
When analyzing a country’s economic situation, the first measure to be reviewed is the GDP.
“Gross domestic product (GDP) is the measure most often used to quantify economies’
economic activity, and GDP and consumption per capita are basic indicators of economic productivity and well-being” (Worldbank 2008). As a first step, I will compare the countries’
GDP per capita in PPS. GDP per capita in purchasing power parity or purchasing power standards (PPS) controls for the different price levels of the countries, making it relative to the prices used in the country, showing practically how much that GDP worth. The main question that this should clarify is whether a low level of financial confidence is influenced by the average “wealth” of the country. The hypothesis is that countries with lower GDP per capita have less amount of “money” for expenditure, thus, people feel less optimistic about their financial situation.
Comparing the GDP per capita in PPS of Hungary to South European countries (see Figure 1) we may conclude even at first sight that those may be in line with our expectations considering confidence: Hungary has lower confidence level and lower GDP/capita than Southern countries. Except for Italy, even the relative levels (compared to Hungary), so the magnitude of difference between the CCIs and the GDPs of these countries are also on a similar level. At first sight (without a deeper analysis and correlation check), this may be comprehended as: people of a country with lower GDP are less optimistic about their financial situation.
Figure 1. Southern and CE European countries – 2012 Q2 confidence and GDP.
Source: Nielsen, Eurostat
Yet, if we benchmark Hungary to other CEE countries, the main point of the initial question becomes more obvious: why do Hungarian people say that their financial situation is about half as good as the people in Poland or in Romania, even though the GDP per capita is almost the same as in Poland, and much higher than in Romania? Even if the Czech Republic has higher GPD/capita and CCI level, if we take into consideration the actual magnitude of these measures we may argue that the Hungarian confidence is indeed quite different than we would expect: 59 percentage points below the Czech value, while GDP/capita is much closer, only 21 percentage points below. So comparing the confidence only to GDP/capita (in PPS), we can clearly conclude that Hungarian financial pessimism is on a much lower level than we could expect based on the wealth generated by the country.
Unfortunately, GDP per capita only reflects how much value people generate, not how much they possess or spend. It is not directly linked to people’s general level of satisfaction with their financial situation, but rather to their overall production of goods and services. In order to get a step closer to how much people actually possess or how much they spend – which we expect to be closely linked to their perception of their own financial situation – we should include the household’s final consumption expenditure into the comparison.
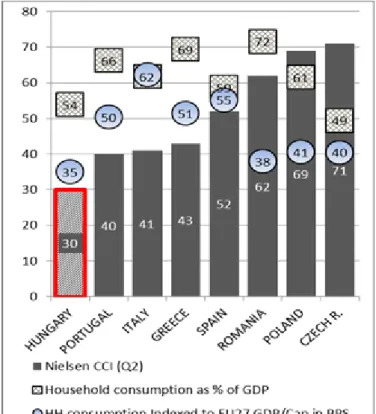
This measure shows the market value of goods and services purchased by households, which may reflect their level of expenditures. Figure 2 compares first the households’ consumption expenditure as a percentage of GDP with boxes above the bars that are indicating the level of confidence. On this measure, we can observe less significant differences between the countries than in case of the confidence index or at the GDP/capita levels. Portugal, Italy,
Greece may be in line with expectations: higher confidence seems to go along with higher levels of consumption expenditure, meaning that those countries where households can afford to spend more have in general a higher confidence in financial well-being and are more positive regarding their financial situation. This supports again the initial hypothesis that those countries that have lower amount of “money” to spend feel less confident about their financial situation.
Figure 2. Southern and CE European countries – 2012 Q2 confidence and consumption expenditures.
Source: Nielsen, Eurostat
We may see a different picture for CEE countries. Consumption expenditure varies from minus 10% to plus 33% if we benchmark it to Hungary’s. But this variation is significantly lower than the difference in confidence where all countries differ by 100-133 percentage points from Hungary. I do not consider yet any correlation; only review the magnitudes to see if it indeed makes sense to question the “validity” of the Hungarian confidence (or actually the lack of it). And from this perspective we can see a similar dilemma as in case of the GDP/PPS: why is there only a minor difference in expenditure between the examined CEE countries and Hungary, yet a significant difference in confidence? There seems to be a quite different evaluation of a similar or almost identical financial reality.
To take a step closer to better comparability, we need to consider that the measure of households’ consumption is calculated from the GDP, and as the GDP can be impacted by many things besides the households’ consumption, the result may be strongly deteriorated by
the actual level of GDP and not by the changes in consumption expenditure. In order to have a more accurate understanding of the actual level of consumption expenditure, I calculated a new measure. By multiplying the level of GDP in PPS (indexed to EU 27) with the household consumption as a percentage of GDP, we get a metric that shows the actual level of household consumption in PPS (see Figure 2 on previous page, the dark circles with white values). What this means is that if we control for the impact of different price levels in different countries, how much money would households be spending. Although this is a generated, artificial metric, it does serve perfectly its function to show that the actual levels of expenditure in PPS are on quite similar level in CEE countries. Although Hungary is 8-17% below other CEE countries’ actual household expenditure, this difference is less significant than the 100-133%
difference in confidence.
We may observe another dimension in which Hungary acts irregularly. Comparing Southern and CEE countries shows that CEE countries have lower consumption expenditure than Southern countries, yet the confidence in CEE is much higher. However, Hungary does not fit into this pattern either. If there is a clear driver that makes CEE countries financially confident even with low(er) consumption expenditure, why does that not work in Hungary?
2.3 The trend of financial status does not explain confidence
Looking only at the actual level of expenditure and comparing it to the GDP may not cover the full picture. Evaluating a current financial situation may be separated into two dimensions.
One dimension would be the actual difference to another benchmark in the present. The other dimension is the time dimension, the trend: comparing to how it was in the past or how it should be in the future. The first dimension has been examined in the previous chapter, so I will continue with reviewing the latter one.
In order to have clarity on the impact of the time dimension, we should examine the trend of the phenomenon, meaning, its level and changes in previous times. Figure 3 shows how households’ expenditure changed to 2012. The darker bar on the left side of each column shows a medium-term change: how consumption changed between 2008 to 2012. On the right side, the lighter color bar shows the change of consumption expenditure from 2011 to 2012, so the short-term (latest) change. In Figure 2 we highlighted that the real value of household consumption is fairly similar among CEE countries. On Figure 3 we can examine its change over time to see whether a negative evaluation of the financial situation is driven by a major decline of expenditure, from a favorable point in the past. The bar charts in the negative range mean that consumption expenditure declined until 2012 – which is the case in both terms and for all the examined countries.
Figure 3. Households’ final consumption expenditure (US $) - annual change to 2012.
Source: Worldbank
Comparing the level of expenditure in 2012 in Hungary to 2008 we can observe an 18.5%
decline. This level is close to the Romanian 19.9% or the Portuguese 17.4% decline, yet, higher than the Polish 7% or the Czech 9%. So if Hungarian people compare their 2012 financial situation to the past experiences – in this case to their highest expenditure just before the crisis (2008) – the confidence should be similar to the Romanian or Portuguese. Yet, it is 25-52% lower than that.
If we expect the short-term trend to impact financial confidence, what we can observe is that the decline in Hungary from 2011 to 2012 (-6.9%) is one of the smallest, a really moderate one compared to other countries. It is fairly similar to the Polish (-5.2%) and less severe than the Romanian (-7.9%) or Czech (-9.0%). Greece and Portugal showed double-digit decline (- 14.2% and -11.0% respectively), which means that from 2011 to 2012 the decline of consumption expenditure in all the examined countries (except for Poland) was more severe than in Hungary. This indicates that the decline in expenditure is not as severe as to explain the extremely low level of confidence in Hungary, nor in short, nor in medium term comparison.
At this point I need to highlight and separately examine Greece. This would be an extreme benchmark to compare to, but would provide another clear perspective. Figure 3 shows that from 2008 to 2012 Greece suffered the most intense loss in consumption expenditure: -28.2%.
That is more than a quarter’s loss of consumption in four years. Even the short term trend shows that between 2011 and 2012 expenditure suffered a 14.2% decline. The Eurostat analysis of Gerstberger and Yaneva (2013) also highlighted that
[T]he effects of the financial and economic crisis have varied significantly. The Baltic
economies and Greece were the most severely affected, with loss of actual individual consumption (in volume terms) of 12% to 15% between 2008 and 2011. While actual individual consumption started to recover in the Baltic countries in 2011, the contraction accentuated in Greece, in connection with the deepening recession and debt crisis, so that the losses between 2008 and 2011 increased to nearly 15%.
So if there is any country in the current comparison that could stand as a benchmark for major loss in economic performance and financial situation, it should be Greece. Unemployment in Greece reached 26% in 2012. The lowest level of unemployment (since 2008) was actually the 7.3% in 2008. This means that unemployment more than tripled by 2012. During the same time Hungarian unemployment started from a similar level in 2008 but remained below 12%
in 2012, so less than half of the unemployment level of Greece.
This suggests that people in Greece should in some way be more concerned about their financial situation. Unemployment increased almost four times as rapidly there: in four years by almost 19 percentage points in Greece while only by 5 percentage points in Hungary.
During the same time the cut-back of expenditure was almost twice as severe as in Hungary. Yet, with much more people becoming unemployed and higher level of cut-back of spending Greek people remained more optimistic about their financial situation than how Hungarians perceived their situation.
Hungarians are not just more pessimistic at that moment, but the decline of confidence compared to 2008 was also more drastic. In the third quarter of 2008, confidence in Hungary was at the level of 71, and in Greece at the level of 73; fairly similar bases. By the second quarter of 2012, Hungarian confidence declined by 58% to 30 points, but the Greek only by 41% to 43 points. With unemployment and expenditure showing a much severe set-back in Greece, the confidence in Hungary declined by almost one and a half times more intensely than in Greece. This raises the obvious question: why did Hungarians perceive their financial situation to decline so much? Is that a realistic result, and if so, what is the driver of it?
What we may conclude from this previous part of the review is that even those countries where GDP is lower, people can be financially more optimistic than in some of the wealthier countries – except for Hungary. The same is valid for the households’ expenditure: the level of expenditure in Hungary is not as low to explain the low confidence; it rather shows that the countries with similar real values of expenditure have much higher confidence than Hungary.
Also, the cut-back of expenditure in Hungary was not stronger than other countries that still remained more optimistic even with higher level of cut-back. The short term cut-back of expenditure in Hungary even contradicts the level of pessimism: one of the lowest cut-back was happening in Hungary, yet confidence still dropped to the lowest level among all countries. In Greece unemployment increased four times higher and expenditure was cut back twice as much as in Hungary, yet it was the Hungarian confidence that declined more. From these initial measures we may clearly see that what we are facing in this analysis is something unexpected and hard to and explain at first sight.
2.4 Components of confidence reflecting general pessimism
To better understand the importance and severity of the low level of confidence in Hungary -
after comparing it to the actual financial situation of the households and to other countries as well as analyzed its trend in the previous chapter – we need to examine the figures in details.
Fortunately the Nielsen Consumer Confidence Index (CCI) can be split to its 3 components.
As a next step I will analyze these 3 indicators and will explain what this means as a general opinion in the society.
In the examined period of 2012, 87% of Hungarians said that their financial prospects are not good or are even bad; 6 percentage points more than a year before. Regarding job prospects 96% of Hungarians said that it is not good or even bad, which is again a 6 percentage point increase since the year before. Also, 95% of Hungarians considered the actual moment not being suitable for buying the things they want or need; which was an 8 percentage point increase compared to the previous year. This means that in all 3 aspects 87-96% percent of the society had a negative perception (or at least opinion) about their financial situation.
There was also a parallel question in the same survey. This question was not included in the calculation of the confidence index, but its result provides important information: 91% of the respondents noted that they have changed spending to save more, which increased from 79%
in 1 year (+12 percentage points).
Summing up the details of the CCI, we may conclude that there was a significant increase of the percentage of people being pessimistic about their financial situation. Its level was so high that we may consider this micro-level opinion as a general state of the whole society:
Hungarians were concerned and pessimistic about their financial situation. In parallel to this, there was a major increase in the percentage of those who started to save.
What we observed up to this point from a people-perspective is a high and increasing (expressed) pessimism about the willingness to spend and a major increase in savings tendency. Yet, my intention in this paper is not to explain this phenomenon in detail but to present it as a starting point and benchmark for comparison. The main reason for reviewing the low level of confidence – and this is where the whole question becomes really interesting – is to show how extremely far the reality falls from our expectation set based on the confidence. The following chapter will present this discrepancy between consumer confidence and consumer actions.
2.5. Pessimism not reflected in actions
The case brings up more questions if we take a step further from what people say and get closer to what people do. If we consider the story of the cricket to show a realistic lesson (e.g.
to be smart and start saving when expecting hard times) and we apply this lesson to the findings of the CCI survey, we could be expecting that when people feel that their employment situation would not get better they would try to be really cautious in their financial actions and would start saving and economizing.
Is it realistic to expect consumers to act in line with the confidence index? According to the Hungarian National Bank (MNB) it could indeed be a valid expectation. The Hungarian National Bank’s 2002 Handbook for the utilization of Hungarian economic (Ferenczi – Jakab 2002) as an attribute which forecasts the consumption expenditures of the people based on
their financial confidence. The Handbook also notes that as a general international practice there are several national banks (e.g. Bank of England, Bank of Canada) that use this confidence index for analytic and forecasting purposes. The Gazdaságkutató Zrt.’s (GKI Institute) Confidence Index, which the MNB refers to, also uses the consumer confidence index to forecast retail trade: “The GKI Retail Index uses regression model to monthly forecast the volume change of the retail trade for the forthcoming 4 months.” (GKI Zrt 2015).
The GKI Consumer Index “is calculated from responses given to questions concerning the actual and the expected financial position of households, the actual and the expected economic situation of the country, and the purchase of higher value consumer durables”.
The GKI Confidence Index indicated a 13 percentage point decline of consumer confidence and was at an average level of -52 in the second quarter of 2012, compared to the -39 value a year before. This trend is in line with the decline of confidence that The Nielsen Company also measured, and according to the MNB and GKI, this should be reflected in the action of people as well. In our case, lower financial confidence should stand for lower spending and the set-back of retail trade. As we will see next, in some cases it does indeed happen so, but there are occasions that differ from this “rule”, and are hard to explain.
Despite expectations, consumption numbers do not reflect the same trend as the confidence.
Both Nielsen and GKI reported major decline of confidence. On the other hand the m Hungarian Statistical Office (KSH) reported that in the second quarter of 2012 the total spending amount on retail goods increased by 4.4% (KSH 2015).
The Nielsen Company, focusing on the measurement of retail consumption goods (FMCG) in Hungary reported the same tendency (Nielsen 2012). In the first half of 2012 the value of purchase of grocery products increased by 6%, meaning that Hungarians had been spending 6% more money than in the same period a year before. Examining a slightly longer period, a full year from December 2011 to November 2012 showed a 5% increase of value of grocery goods, while volume was stable (Nielsen 2013). The same report notes that 85% of respondents changed their habits to economize, and the majority of respondents (67%) expressed that they switched to cheaper grocery. Why is there no decline of spending then?
Although grocery is only one a part of total retail spending, it is that part which should reflect most the saving tendency. A recent research (Mile 2014) built on a similar Nielsen measure highlighted that among those Hungarians who intend to economize, most people would do it by switching to cheaper grocery: 70% of interviewees in fourth quarter of 2013, and 68% in same period in 2012. This level is higher than the European average of 52% in fourth quarter of 2013. What we can conclude from this is that if Hungarians would really save and not just intend to do so, this would be reflected in the lower amount of money spent on retail goods.
Yet, the amount they spent on such goods increased by 4.4% (KSH) and 6% (Nielsen).
Both these measures indicate that the amount of money people spent in total increased during the same period when people were extremely concerned about their financial situation. This increase in purchases is absolutely contradictory to what we could have expected based on people’s opinion about their financial situation and willingness to spend: people intended to save, would do that (primarily) by cutting down on spending on grocery, yet, they spent even more.
According to Katona and Mueller (1968) “decisions to boost everyday expenditures are seldom brought about by the expectations that income will go up.” If expenditures grew because people expected their income to increase, why were they so negative about their financial situation and expecting it to decline? And is this an isolated, one-time case, or something more frequent?
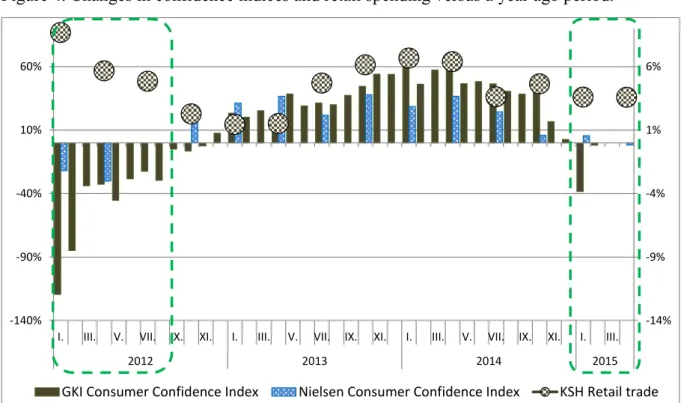
Although we started the analysis based on an observation in the second quarter of 2012, that was not the only occasion when confidence and spending indicated opposite trends. Figure 4 below shows the changes of consumer indices versus year-on-year, and the retail trade changes for the same time comparison in squares above the bars. From the beginning of 2013 the bars and the squares are almost covering each other, which indicates that the increase of confidence was happening in parallel with growth of retail trade, which means that people were expressing more and more optimistic opinion about their financial situation and they were also spending more.
Figure 4. Changes in confidence indices and retail spending versus a year ago period.
-14%
-9%
-4%
1%
6%
-140%
-90%
-40%
10%
60%
I. III. V. VII. IX. XI. I. III. V. VII. IX. XI. I. III. V. VII. IX. XI. I. III.
2012 2013 2014 2015
GKI Consumer Confidence Index Nielsen Consumer Confidence Index KSH Retail trade
Note: left axis relates to confidence indices, right axis to retail trade). Sources: KSH, GKI, Nielsen
However in the first three quarters in 2012 the trends of confidence and retail were opposite (although the gap was closing): confidence was declining, spending was increasing. Also, in the first half of 2015, confidence was already close to or even in a huge decline, yet retail trade kept on growing by 4%. The general trend may indeed be that opinions are realized in actions adding up to a similar macro-level impact (as visible in the middle part of Figure 4), but there are specific periods when this general rule is strongly deteriorated.
We may conclude that although people were expressing their intention to save, when taking a look at their expenses we can often see an increase which is contradictory to our expectation.
This phenomenon happened several twice in the year covered in Figure 4.
3. ALTERNATIVE EXPLANATIONS
What we could see in the previous section is that the opinion that people expressed about their financial situation – in some cases – really differed from what we would have expected based on their actions. Investigating all the possible explanations – ranging from the perspective of what people perceive, through how they created their opinion, what impacts it, and what drives their actions in the end – would require a very detailed research which falls outside of the limitation of this paper and are presented in a separate one, as a continuation of this paper.
Yet, I want to review, explain and disprove those alternative explanations that might presume that there is only a methodological mistake behind this phenomenon; those that suggest that reviewing these mistakes should reveal the actual situation. These arguments are a) the difference in the levels of measurement, b) inflation and c) the level of income.
3.1. Difference in the level of measurement
In the previous part of the analysis I compared individual level opinion (what people think) to processes in the economy (GDP, expenditure of households). Using such different levels – micro vs. macro – to explain each other may be methodologically questionable due to the difference in the level of measurement. Yet, I have three reasons to expect the micro-macro issue not to bias the analysis.
My first argument to support my hypothesis – that in our case micro-level savings intention could be expected to aggregate into a macro level set-back of consumption – is based on the findings of Krugman. Krugman (2013) argued that practically the decrease of consumer spending due to individual intention to decrease debt has been the main driver of the global economic depression of 2008: “Why is unemployment so high and economic output so low?
Because we – where by “we” I mean consumers, businesses, and governments combined – aren’t spending enough”. In his book End this depression now!, Krugman argues that individual intentions and actions to save accumulated into a macro-level set-back of spending which then shook the financial and economic system and led to a global crisis. I do not intend to say that the set-back of Hungarian private consumption should trigger a global economic crisis, but I hypothesize a similar local process: individual level savings intention should have been realized in actions and then accumulated to a macro-level set-back of expenditure.
The second reason is that it is not the goal of this research to challenge such economically influential institutions as the MNB (along with other national banks) and GKI Institute which have a well-founded fundamental expectation that individual opinions will lead to similar individual action and macro-level impact.
Argument number three is that we are talking about a significant majority of the society here which is pessimistic. As explained previously, for the three questions about financial situation
87-95-96% of people responded with a negative answer. This high level of shared opinion should be considered as a general opinion of society. Due to this and the previous two arguments I do not consider bias to arise from the different levels of measurement.
3.2 Inflation
The second argument to examine is the impact of a price increase. Maybe people were not intending to spend more; it was only due to a general price increase. Measures indeed support this suggestion, showing that spending was increasing due to price increase. KSH reported that in the second quarter of 2012 the volume sales of grocery products was stable, at 99.9%
of the level of same period previous year, while the price level of grocery goods in 2012 increased by 5.9%. The Nielsen Company showed similar figures for retail grocery goods.
Increase was driven by price, yet, there was no volume decline.1 From this it becomes clear that the increase of spending on groceries was driven by price increase, inflation, and there was no set-back of volume. Yet, that does not make it reasonable.
In case people decide that they need to save, they would do it based on the money they have at their disposal and they would cut back on expenditures. If the price increased by 5.9%, people would intend to save by more than 5.9% by decreasing the volume of the purchases.
Yet, in our case the volume of purchases is flat, meaning that people did not start purchasing less at all, and they accepted all the price increase
3.3 Income
If income increased by a higher rate than spending, people may have still perceived it as a relative saving as they would spend a lower percentage of their total income (thus, save compared to the total budget) and this would still mean a stable volume purchase with an actual increase in total value spent. However, comparing the net income of the employed in this period, we can see only a 1.7% increase2 (KSH 2015), so spending increased at a faster rate (4.4-6%) than income. If we consider the total net income of the households which increased only by 0.6% for 2012 (KSH 2015), we can also conclude that the total amount of money at the disposal of Hungarian consumers did not grow so much as to explain the growth of spending.
4. CONCLUSION
This paper reviewed a case where actions were contradicting opinions. Main economic institutions have been expecting that the financial confidence of people would forecast their financial actions, which seemed to be true for a period of time in past three years, but there were several occasions when actions were diverging from the opinion: people were
1 At least in case of groceries, while total retail spending indicated a 1.9% decline but in parallel with a 4.4%
value increase.
2 For the periods of April-July 2012 versus April-July 2011, besides a 4.3% gross income increase.
pessimistic about their financial situation yet they were not saving but rather increasing their expenditure.
In 2012 the level of financial confidence in Hungary was the lowest in the world. This level could not be explained by the financial situation of the country, as benchmarked countries with similar GDP and expenditure levels were much more optimistic. Economic trends were not explaining it either (nor on long, nor on short term), as reference countries suffered more severe set-back of expenditure, and in some cases even much higher unemployment rate, yet they were remaining more confident about their financial situation.
The level of financial pessimism was at an extremely high level with 87-96% of Hungarians being pessimistic about their current and future financial situation, and the level was increasing. 91% of people even stated their intention to save. Yet the figures showed that at the end total expenditure increased by 4.4-6%. This raised the question: why were people increasing the spending so much if they were concerned about their financial situation?
It would not be feasible within the limits of this paper to explain the mechanism behind the phenomenon and its impact on the opinions and actions; yet, we could exclude some of the alternative explanations. Based on the three arguments in the previous section I argued that this extraordinary phenomenon is indeed valid. The discrepancy is not due to a bias of different levels of measurement. It is driven by price increase yet there is no saving realized, in contrary to our expectation based on the opinions. And last, but not least, the increase of spending was not driven by an increase of disposable income.
What could be then the real explanation for this phenomenon? I do not expect one single reason to explain the whole phenomenon because “explanation of most concrete social events or states require resort to several elementary mechanisms, one is not enough” (Hedström – Swedberg 1998). There are several factors influencing social actions and opinions, and a following, separate research will investigate the most influential ones, which have the strongest and most direct impact on the phenomenon. Let me enlist a few perspectives to be examined, as well as some of the hypotheses within these areas.
The first thing to come to anyone’s mind being familiar with Hungarian culture would be the general pessimism and tradition of complaining in Hungary. Although there is very limited amount of research on the culture of complaining, the research by Skrabski and Kopp (2007) about the mental health of Hungarians may indicate whether there is a general level of depression that might indicate a general pessimism as well. Review of a possible general level of pessimism may reveal whether such low level and declining financial confidence could be due to an exaggeration or to a culture of complaining.
In case a general pessimistic and/or complain-driven attitude receives proof, the level of conformity should also be analyzed. Society may have reached a level where opinions of the majority become a general opinion and thus the previous low level of financial confidence of a part of the society spreads to become a general status and decreases the overall level of financial confidence. According to the World Values Map of Inglehart and Welzel (2005), Hungary is rather a survivor-focused country, with less emphasis on self-expression values. A higher level of conformity could be caused by an oppression of individual values and due to
changes in the social and political environment, which increased dissatisfaction; the opposite of the process that Inglehart and Welzel (2005) note: “economic growth, rising level of education [...] makes people’s cultural emphasis shift from collective discipline to individual liberty, from group conformity to human diversity.”
One of the main factors to be analyzed should be the benchmarks, reference points. As people tend to evaluate themselves through the comparison to other people, social comparisons may have a significant impact on consumer choices and actions. In case the income of people declined compared to a major growth in preceding years (either just by slowing down or even turning into negative value) then people had to downgrade their aspirations. In case this was happening in parallel to a widening income gap, then it was not just the aspirations that get downgraded but also the aspiration point (the benchmark) may have gotten further.
Previous impact may have been augmented by an increase of emphasis on material values:
“materialist values are the concern of those who have experienced economic or physical insecurity […] those who have postmaterialist values have been exposed to greater security and, as a result, are oriented towards satisfying other needs, needs associated with social bonds, self-esteem and self-actualization” (Brathwaite et al. 1996). This raises the question of social and political stability and could be aggravated by a possible increase of poverty.
The comparison of opinion and action may be impacted also by the fact that the perception of changes in expenditure may be realized only with a time delay: “some people may unconsciously adopt a more open-handed attitude toward spending when they have more money in the pocket. Not having planned it that way, they realize only with some time that they have in fact raised their general living expenses” (Katona – Mueller 1968).
Furthermore people may have reached their minimum level of consumption, beyond which they could not economize more without setting back their health or social situation. If prices since the start of the financial crisis were increasing more intensely than net income, then people may have reached a state where they lost their motivation or ability to save so they started spending on everyday consumption goods for immediate rewards instead of a possible future gain of savings. To examine this, further research is needed.
References
Brathwaite, V. – Makkai, T. – Pittelko, Y. (1996): Inglehart's Materialism-Postmaterialism Concept: Clarifying the Dimensionality Debate Through Rokeach's Model of Social Values: Journal of Applied Social Psychology 26(17): 1535-1555.
Ferenczi, B. – Jakab, M. Z. (2002): Magyar Nemzeti Bank : Kézikönyv a magyar gazdasági adatok használatáshoz [Handbook for the utilization of Hungarian economic data].
https://www.mnb.hu/archivum/Kutatas/mnbhu_elorejelzo_modszerek/mnbhu_fresh/mn bhu_felh, accessed 4 June, 2016.
Gerstberger, C. – Yaneva, D. (2013): Statistics in focus 2/2013.
http://ec.europa.eu/eurostat/statistics-
explained/index.php/Household_consumption_expenditure_-
_national_accounts#Actual_individual_consumption_in_euros_per_capita, accessed on 4th June, 2016.
GKI Gazdaságkutató Zrt.(2012): GKI-Erste Konjunktúra Index. http://www.gki.hu/wp- content/uploads/gki/konj_1206.pdf, accessed 4 June, 2016.
GKI Gazdaságkutató Zrt. (2015): Új modell a kiskereskedelmi forgalom előrejelzéséhez.
[New model for forecasting retail trade]. http://www.gki.hu/wp-
content/uploads/2015/08/kiskereskedelmi_prognozis_ajanlat.pdf, accessed 4 June, 2016.
Hedström, P. – Swedberg, R. (1998): Social mechanism – An Analytical Approach to Social Theory. Cambridge: Cambridge University Press.
Inglehart, R. – Welzel, C. (2005): Modernization, Cultural Change and Democracy.
Cambridge: Cambridge University Press.
Katona, G. – Mueller, E. (1968): Consumer Response to Income Uncreases. The Brookings Institution.
Krugman, P. R. (2013): End this depression now! W.W. Norton & Company.
KSH (2016a): 4.4.11 A kiskereskedelmi forgalom naptárhatástól megtisztított volumenindexe [Volume index of retail trade].
http://www.ksh.hu/docs/hun/xstadat/xstadat_evkozi/e_okfa003b.html?222, accessed 4 June, 2016.
KSH (2016b): 2.1.53. Az alkalmazásban állók havi nettó átlagkeresete a nemzetgazdaságban [Average net monthly earnings].
http://www.ksh.hu/docs/hun/xstadat/xstadat_evkozi/e_qli018d.html, accessed 4 June, 2016.
KSH (2016c): A fogyasztói árak alakulása 2012-ben [Consumer prices in 2012],
http://www.ksh.hu/docs/hun/xftp/stattukor/fogyar/fogyar12.pdf, accessed 4 June, 2016.
Nielsen (2012): Nielsen Consumer Confidence Index:
http://hu.nielsen.com/site/20120717.shtml, accessed 4 June, 2016.
Mile, G. (2014): Mire figyel a fogyasztó? [What concerns the consumer] Élelmiszer Magazin, 22.
Skrabski, Á. – Kopp, M. (2007): A bizalom, mint a társadalmi tőke központi jellemzője.
[Trust, as the central attribute of the social capital],
http://vigilia.hu/regihonlap/2008/10/skrabski.htm, accessed 4 June, 2016.
World Bank (2008a): Global Purchasing Power Parities and Real Expenditures.
http://siteresources.worldbank.org/ICPINT/Resources/icp-final.pdf, accessed 4 June, 2016.
World Bank (2008b): Household final consumption expenditure, etc. (% of GDP), http://data.worldbank.org/indicator/NE.CON.PETC.ZS, accessed 4 June, 2016.
World Bank (2008c): Household final consumption expenditure.
http://data.worldbank.org/indicator/NE.CON.PRVT.CD, accessed 4 June, 2016.