FLASH REPORT
This research is dedicated to the memory of István Nemeskéri!
This Flash Report has been prepared by:
Béla Bauer, Balázs Bazsalya, Eszter Berényi, Béla Marián, Miklós Péter Máder, Zsuzsanna Molnár, Szilvia Perényi, Péter Pillók, Gergely Rosta, Bence Ságvári, Andrea Szabó, Ákos Szabó
Editor of the English version Bence Ságvári
The report was translated by ILS Nemzetközi Fordító Szolgálat Kft.
English collaborator Marisa Beahm Klein
The research was ordered by the:
Ministry of Social Affairs and Labour
Financial coverage was provided for the research from the following funds:
Labour Market Fund, Training Fund Labour Market Fund, Employment Fund
Responsible editor:
Director of the Institute for Social Policy and Labour
© Béla Bauer, Balázs Bazsalya, Eszter Berényi, Béla Marián, Miklós Péter Máder, Zsuzsanna Molnár, Szilvia Perényi, Péter Pillók, Gergely Rosta, Bence Ságvári, Andrea Szabó, Ákos Szabó
© Béla Bauer, Andrea Szabó, editors, 2009
© Institute for Social Policy and Labour, publisher, 2009
Youth2008
©FLASH REPORT
Edited by:
Béla Bauer, Andrea Szabó
4
TABLE OF CONTENTS
TABLE OF CONTENTS ... 4
INTRODUCTION ... 6
THE PURPOSE OF THE RESEARCH ... 8
TOPICS ... 9
SPONSORS OF THE RESEARCH: ... 9
LEADING RESEARCHERS OF THE YOUTH2008 PROJECT ... 9
COOPERATING RESEARCHERS ... 10
COOPERATING ASSOCIATES ... 10
THE DATA WERE COLLECTED BY: ... 10
PROFESSIONAL REVISER: ... 10
METHODOLOGY OF THE YOUTH2008 RESEARCH ...11
THE METHODOLOGY OF QUANTITATIVE RESEARCH ... 11
THE METHODOLOGY OF QUALITATIVE RESEARCH ... 12
DEMOGRAPHICS, FAMILY RELATIONS AND CHILD BIRTH ...13
MARITAL STATUS ... 13
CHILDBIRTH ... 16
EDUCATION ...19
PARTICIPATION IN EDUCATION ... 19
ECONOMIC ACTIVITY AND LEARNING ... 23
EXTENDED EDUCATION, LANGUAGE SKILLS, SPECIAL CLASSES ... 25
UNIVERSITY AND COLLEGE STUDENTS ... 27
POSSIBLE WAYS OF TRANSITION BETWEEN SCHOOL AND WORKPLACE ... 30
SCHOOL ... 30
THE PHYSICAL ENVIRONMENT ... 31
TEACHERS ... 31
CURRICULUM ... 32
ASPECTS OF CHOOSING SCHOOLS ... 33
PREFERENCES ... 34
DISLIKES ... 35
OTHER DECISION-MAKING FACTORS ... 37
DROPPING OUT ... 38
LATER OPINIONS ABOUT THE CHOICE OF SCHOOL ... 38
A REVIEW OF THE LABOUR MARKET ...39
FIRST JOBS ... 40
EMPLOYMENT IN THE FIRST JOB... 40
CURRENT WORKPLACE, EMPLOYMENT ... 43
BLACK WORK ... 44
OCCUPATIONS ... 45
GIVING UP AND LOSING JOBS, UNEMPLOYMENT ... 45
Losing jobs ... 45
Young unemployed people ... 45
GEOGRAPHICAL MOBILITY ... 47
CHOOSING THE WORKPLACE, SATISFACTION WITH THE WORKPLACE, THE IDEAL WORKPLACE ... 50
UNEMPLOYMENT ... 52
THE WAY OUT OF UNEMPLOYMENT ... 53
Getting work abroad... 53
5
Moving within Hungary ... 53
Starting a business ... 53
Training courses, retraining ... 54
Labour centres ... 54
FINANCE, PROPERTY, INCOME AND HOUSING ...55
YOUTH – A UNIFORM GROUP? ... 55
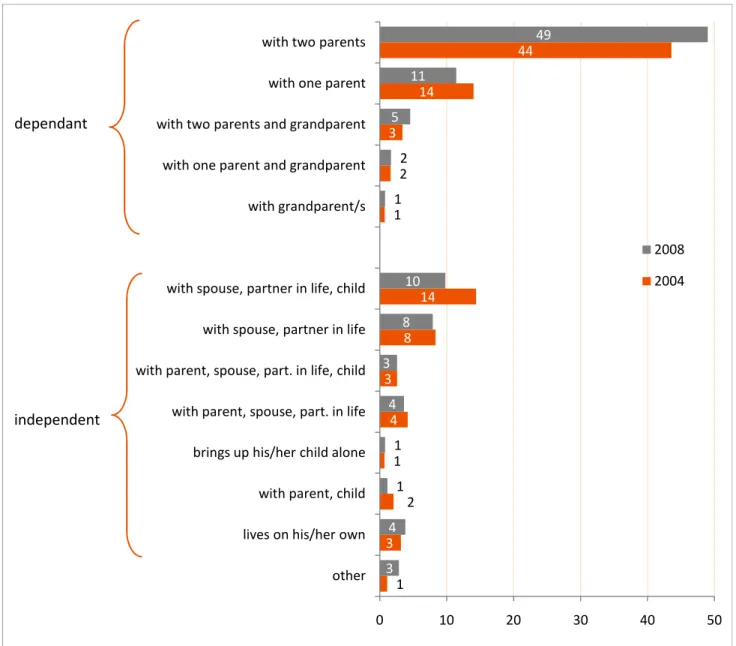
FAMILY STATUS, SELF-DEPENDENTS AND DEPENDENTS ... 55
INCOME ... 57
INCOMES OF HOUSEHOLDS ... 58
PROPERTY ... 62
HOUSING ... 63
SUBJECTIVE OPINIONS ABOUT THE FINANCIAL POSITION ... 66
HOLIDAYS ... 68
A FEW CHARACTERISITICS OF THE LIFESTYLE OF THE 15-29 AGE GROUP ...70
SPORTING HABITS... 70
SMOKING HABITS ... 74
ALCOHOL CONSUMPTION... 76
DRUG CONSUMPTION ... 77
SUBJECTIVE OPINIONS ABOUT THE HEALTH STATUS ... 79
SEXUALITY-RELATED ATTRIBUTES ... 80
THE INFORMATION SOCIETY AND MEDIA CONSUMPTION...83
COMPUTER AND INTERNET USAGE ... 83
DIGITAL DEVICES IN THE HOUSEHOLDS ... 84
Internet and computer ... 84
CHARACTERISTICS OF INTERNET USAGE ... 86
OTHER DEVICES IN THE HOUSEHOLDS OF YOUNG PEOPLE ... 87
TV, RADIO, DAILY AND WEEKLY PAPERS ... 88
Television ... 88
Radio ... 89
Newspapers ... 90
A FEW CHARACTERISTICS OF CULTURAL CONSUMPTION, SPENDING LESIURE TIME ...92
SUPPLY OF MATERIALIZED CULTURAL CAPITAL ... 92
SCENES OF CULTURAL CONSUMPTION ... 93
SPENDING LEISURE TIME ... 95
THE YOUTH’S PUBLIC MOOD IN SOCIETY, THEIR ATTITUDE TO POLITICAL ISSUES ... 101
PUBLIC MOOD ... 101
POLITICAL INTERESTS AND OPINIONS ... 107
POLITICAL ACTIVITIES ... 117
YOUTH SERVICES ... 120
YOUTH OFFICES AND CONTACT PERSONS FOR THE YOUTH ... 122
RELIGIOUSNESS ... 125
THE MOST SIGNIFICANT PROBLEMS OF THE YOUTH ... 133
CLOSING STATEMENTS ... 136
INTRODUCTION
When we pose the question as to what characterises the situation of young Hungarians and the Hungarian society, we are basically examining what circumstances and conditions are provided to the youth under the new system that has evolved over the past two decades following the change of regime. What opportunities are offered and what barriers are raised to the coming generations in terms of social preparations, gaining independence, taking social roles and actions as well as career and job opportunities?
To put it in another manner: how are the actions of the youth and their forms of interest influenced by the circumstances of generational reproduction created by the social, economic, political, legal, etc. relations evolving as a result of the political and economic restructuring?
In modern societies, also including the Hungarian society, the social preparation, the activities and the integration of young generations are to be guaranteed at all times through the simultaneous operation of numerous and diverse social institutions and organisations. In this respect, one of the most important elements is the family, but a basic role is also taken in the socialisation of the youth by the educational and training system, the state, the local governments, the youth and civil organisations, the church as well as by contemporary groups or even by the media.
The quality of life and the background provided to young residents in an unemployment-ridden settlement with a poor population, by a local government with a low budget and by a inadequately supplied school is basically different from a settlement that is mainly populated by a well-off middle class, where the local government has sufficient funds for rendering high-level services and provisions.
Since the start of the restructuring process, the Youth2008 research has been the third experiment that makes an attempt to describe – through the instruments of social science and sociology – the changes and characteristics deriving from the social and economic transformation that takes place in the processes of generational reproduction. One of the objectives of the youth data collection – conducted every four years in a large sample covering the 15-29 age-group – is to record the changes (compared to the previous collection(s)) in the social factors that influence the education, the employment, the career, the independence and the welfare of young age groups. A further aim is to register how these impacts are reflected in young people’s lifestyle, leisure activities and cultural consumption.
The youth sociology surveys conducted over the past two decades go to show that the period of youth has become longer1. Young people spend more and more time at educational institutes. The data collected in the 1980s – and even in the early 1990s – showed that finishing school, finding jobs, getting married and having children were closely related to each other in terms of time in the case of skilled workers and people doing routine intellectual work (mainly with a GCSE exam). Young people usually got married after starting work (irrespective of their educational level), and they had their first child within two years. Today however, those with vocational training start work that lasts for more than three months for the first time typically at the age of about 19. The trend is similar with those who do intellectual work that does not require a university/college degree. Previously, starting work depended on the date of the GCSE, but in the year 2000, more than two-fifths of the people concerned joined the labour market for the first time at the
1 The period of independent decisions comes later, at the same time, young people have independent autonomy over actions in certain walks of life. For details see: Kálmán Gábor (editor): Ifjúságszociológia Belvedere Szeged, 2006, p.
445
age of 20 or older. The trend was still very similar in 2004, but by 2008 this rate went up to cover two-thirds of young people.
The question arises: to what processes is the later start of work related? The consequences of the extended period of youthful years are shown by the fact that, although most young people would like to have children, it has been a trend in the past 10 years that they want to have their first child several years later.
This is partly due to the fact that now men and women want lasting relationships in the second half of their twenties, parallel with the longer time spent in education. In 1990, 20.3% of the population aged 15 and above was single; this rate was 27.1% in 2001 and 28% in 2002. The figures of the Youth2000 research already highlighted that the willingness of young people to get married is extremely low as 69% were single, and the marriage rate was 22%. With regard to the 15-29 age group, the Youth2008 data showed that the marriage rate has gone down to 13%, and singles scored above 70%. Looking back on eight years, the 9% decrease in marriages can even be regarded as dramatic.
Although it is evident that the period after the change of regime finally endorsed “life partner” as a new form of living together, the Youth 2000 research also pointed out that having children was connected to marriage even in 2000. However, the rate of childbirth outside marriage dynamically increased through the years following the millennium. Eighty-five percent of teenage mothers, 58% of mothers aged 20-24 and 30% of those aged between 25 and 29 had children outside marriage in 2007. This means that the rate of extramarital childbirth is increasing in all groups of young people.2
The figures go to show that young people get married when they want to have their first child. The extended youthful period is producing new roles – e.g. the single or pre-single status – or spreads the phenomenon of post-adolescence, thus creating a specific cultural and consumption situation for certain groups.
The new form of the surveyed age group’s dependence on, or independence from the parents’ home can be evidenced in the way young people are planning their lives. As a consequence, the time young people spend together with their parents is increasing parallel with becoming independent. They mainly leave the parents’ house when they get married or start living with someone instead of the planned date of finishing studies or starting work.
The youth sociological studies in the 1990s had high expectations of raising the educational level, cherishing the illusion that higher education will also become available for people who are at the lower levels of the social hierarchy (e.g. children in families with low educational levels and living in villages). A survey3 conducted in 2002 among students who were accepted to higher education shows that these hopes proved to be too extreme. Children whose parents have secondary or higher education have a chance to get into higher education. For much wider social groups, higher education continues to offer only the theoretical possibility of making advancements.
In the year 2000, it seemed that the clear beneficiaries of expanded higher education were those young people who mainly come from educated families and from higher social levels.
The figures collected in 2004 highlighted improvement in the higher educational chances of children of fathers with secondary education. This trend continued in 2008. It seems, therefore, that from the viewpoint of higher education, the availability or the absence of the father’s secondary education can now
2 Based on data communicated by the Central Statistical Office.
3 Kálmán Gábor – Imre Kabai: Survey among first-year students, 2002 (Manuscript)
be regarded as a dominant factor. However, the further expansion did not prove to be favourable for young people who live in families with less education or who live in a worse social environment (i.e. children of fathers with vocational training or at most with primary education). What is more, the higher educational chances of those living in the worst social and family environment seem to be even smaller than before.
Clearly, the unequal educational chances deriving from the different social background are influencing – at an unchanged intensity – the possibilities of the young generation to take part in education.
The choice of cultural activities, as well as their depth and intensity do not even come close to the rate that was registered by the culture sociological surveys made over the past few years. The few leisure activities that the young people mentioned – which seem to be based on less conscious and more random decisions – mainly reflect individual activities and intentions. It is the company and the community that is missing; to put it in another way the desire for common actions has almost disappeared from the cultural activities of the youth. This may be the consequence of the process that is becoming common through the wide spread of the Internet. For young people, the space for socialization is already attached to Internet-related facilities today. The reason is that the traditional scenes of interaction (cafés, tea houses, pubs) are visited by young people two-three times a month on average. This trend may also affect interpersonal communications, but the quantitative method is less suitable for describing this process.
It is our belief that what was previously stated, which attempts to map the changes and processes that are taking place in the lives of the youth, justifies the continuation of the research in itself.
The Youth2008 research programme was ordered by the Ministry of Social Affairs and Labour, and it was financed by the Training Fund of the Labour Market Fund and by the Employment Fund of the Labour Market Fund.
Compared to the previous large-sample surveys, the large-sample survey conducted in 2008 was extended with a qualitative (focus group) phase in order to more accurately explore the decisions that affect the lives of young people.
At last, it can be declared that – following the example of numerous EU countries – government-backed, comprehensive youth research activities have also become regular in Hungary by 2008. It is one of the basic objectives of this research that the collected data should – according to the traditions - be available for use by all interested parties. Thus, the results and the findings will be published after processing the work.
Due to its specific features, the Flash Report serves the purpose of giving an insight into the basic research data prior to preparing the studies; however, we do not undertake here and now to interpret the figures in depth or to highlight and explain the relationships. Therefore, the Flash Report is nothing else but a surface approach to the basic research data.
The purpose of the research The purpose of the research is:
- to get both a vertical and a horizontal picture of the material and cultural power sources, lifestyles and values of young Hungarians;
- to obtain comparative data about Hungary’s statistical and economic regions – along the surveyed dimensions – with regard to the earlier Hungarian research activities;
- to obtain comparative data for the Hungarian citizens, decision makers, organisations and research workshops;
- to provide a facility – from the viewpoint of both methodology (empirical sociology) and contents (surveyed dimensions) – for later comparability, for local, county-level and regional research work as well as for applications in practical use (e.g. working out youth concepts).
Topics
The topics consist of the following parts:
1. Social mobility
the family’s cultural capital, the parents’ educational level and occupation 2. Education
educational level, current schooling position, plans for further education 3. Financial position
durable consumer assets, income, economy 4. Family position
types of living together, partner contacts, moving from home 5. Features of the labour market
starting the first job, current and former workplaces, employment plans 6. Social mood, public life attitudes
opinions about social problems and institutions, attitudes and relationship to politics, organisational activities, attitude to the parents’ values
7. Local public life and local politics
interest in local public life, participation in local politics 8. Youth services
youth contact person, youth offices, youth organisations 9. Religion
religion, membership in a denomination 10.Cultural consumption
leisure time, media consumption, cultural habits 11.Health, lifestyle, sexuality
health status, lifestyle characteristics, sexual habits, contraception, smoking, alcohol and drug consumption
12.Sports
sporting habits, awareness and viewer rate of various branches of sport 13.IT skills
IT skills, habits of computer use Sponsors of the research:
Ministry of Social Affairs and Labour Labour Market Fund, Training Fund Labour Market Fund, Employment Fund
Leading researchers of the Youth2008 project Béla Bauer, sociologist, head of the research
Miklós Péter Máder, sociologist Zsuzsanna Molnár, sociologist Péter Pillók, sociologist Bence Ságvári, sociologist Andrea Szabó, sociologist Ákos Szabó, sociologist Cooperating researchers Eszter Berényi, sociologist Balázs Bazsalya, sociologist Anna Galácz, sociologist Béla Marián, sociologist Tibor Papházi, sociologist Szilvia Perényi, sociologist Gergely Rosta, sociologist Cooperating associates Klára Iván
Virág Ladencsics Márta Debreczy Tamás Bodor Balázs Krémer
Andrea Kurucz, copy editor Judit Inez Veres
The data were collected by:
MARKETING CENTRUM National Market Research Institute Professional reviser:
Mrs. Károlyné Tokaji, Central Statistical Office, head of the general statistical department of social services
METHODOLOGY OF THE YOUTH2008 RESEARCH
The methodology of quantitative research
For the survey that was the first stage of the Youth2008 research, we drew up a nationally representative sample covering 8,076 people (four, 2,000-person samples) covering the 15-29 age group. The research is appropriately comparable with the Youth2000 research (conducted eight years ago) and the Youth2004 research (conducted four years ago), which also covered 8,000 young people aged 15-29 in a nationally representative sample.
The sample was to represent the surveyed population according to regions, size (type) of settlements, age groups and gender.
The research group decided to use the sample of the Youth2008 research in a breakdown into 4x2,000- person and 2x4,000-person samples by using questionnaires that were partly different from each other in the four as well as two subsamples. The main reason for this decision was that the 2,000-person and 4,000- person national samples are sufficient for analysing some subtopics that are deemed to be important, thus there was an opportunity to cover many more topics without significantly exceeding the originally planned interview time.
The 2000-2008 samples covered the following question groups:
- attitudes towards having and bringing up children;
- consciousness of a citizen, trust in the democratic institutional system;
- attitudes towards learning and usable knowledge;
- supply of info-communication devices;
- media consumption;
- questions regarding the information society.
The question group of the 4,000 subsamples covered
- questions about cultural consumption and leisure activities.
Questions included in the independently filled out questionnaires that were handed over to 8,000 persons:
- use of drugs;
- sexual habits;
- alcohol and smoking;
- political party preference;
- participation in demonstrations.
Small deviations from the theoretically expectable sample distribution emerged due to the manner of making sub-samples and in the course of the data collection. These minor disproportions were corrected through weighting under various aspects. The aspects of weighting are as follows: gender, age groups, settlement size. The sample drawn up in this manner represents a total of 2,031,735 persons in Hungary aged 15-29, which is by 182,969 persons less than four years ago.
Figure No. 1. The surveyed age group according to years of age, in 2000, in 2004 and in 2008 (in persons)
The methodology of qualitative research
Quantitative data collection was followed by a focus group-based research stage, whereby our main objective was to explore the opportunities that are implied by the situations we learned of in the questionnaire-based research as well as to seek explanations for the situations encountered. For the sake of this, we, on the one hand, pinpointed the needs, opinions and views of experts dealing with the 15-29 age group about the solutions regarding the posed questions. On the other hand, we pinpointed the situations, the needs, the attitudes and opinions of the young people questioned as well as the opinions and views of the parents of children who were just about to start school and/or a career.
Eighteen focus group discussions were conducted with the young respondents. When selecting the participants, our purpose was to learn the opinions of young Hungarians in their teens and twenties who are living in various life situations. In the course of the discussions, we ensured that each group should be heterogeneous in terms of gender, but homogeneous with regard to age. We tried to cover all regions, choosing the eastern, western and central part of Hungary as venues for the group discussions in more or less equal proportions.
0 20000 40000 60000 80000 100000 120000 140000 160000 180000 200000
15 16 17 18 19 20 21 22 23 24 25 26 27 28 29
2000 2004 2008
DEMOGRAPHICS, FAMILY RELATIONS AND CHILD BIRTH
Marital status
In our survey conducted in 2000, we, for the first time, indicated the process (documented in Western Europe in the 1980s) whereby the period of youthful years is becoming extended. More and more young people spend more time pursuing education than before; thus, the timeline of starting a first job is extended, and in turn, the establishment of a lasting partner relationship and the creation of a family are also delayed. In addition to this, the traditional family forms are being dismantled, and “life partners” (living together outside official marriage) are becoming more and more fashionable and socially accepted.
The characteristics explored at the beginning of the millennium emerged in 2008 in an even more palpable manner. More than seventh-tenths of the members of the 15-29 age group are single, 13% are married and 13% have a life partner. As can be seen, the main trend change that took place during these eight years affects lasting relationships: the marriage rate decreased by 9 percentage points, and parallel with this, the rate of life partners increased by about 6 percentage points. The divorce rate was 3% in 2008. We believe that our former statement (namely that the rate of marriages has decreased) is true. Still, this does not mean there is a lack of lasting relationships, but it indicates that fewer and fewer young people find marriage to be the only acceptable way of living together. However, we need to point out that the growth in the forms of living together outside marriage cannot counterbalance the lasting decline in the number and the rate of marriages and married people.
Figure No. 2. Distribution of young people according to marital status (in percentage)
Ninety-five percent of the youngest surveyed age group (15-19) is single; within this group, 3% have a life partner and only 1% are married. However, there are changes in the marital status as the age increases.
71 68
69
13 17
22
13 13
7
3 2 2
0% 20% 40% 60% 80% 100%
2008 2004 2000
single, lives alone has a spouse or partner in life single, has a partner in life divorced
Eight percent of those aged 20-24 and 27% of the oldest group are married. About one-fourth of the latter group and 14% of those aged 20-24 have a life partner. It needs to be indicated that rearrangements have also taken place in these two age groups compared to 2000 and 2004. Thus, the process that was first registered in 2000 spiralled through all of the age groups.
The decades-long differences between the marital statuses of men and women can be clearly shown in 2008. Seventy-eight percent of men and 64% of women aged 15-29 are single. The rate of single women increased by 4 percentage points compared to 2004, and the rate of single men increased by 2 percentage points. Sixteen percent of women have a life partner and 17% are married. There is no such difference between these two types of relations among men: 9% are married and 10% have life partners.
Compared to the data of Youth2004, a significant change can be highlighted in the oldest male segment.
Four years ago, 53% of men aged 25-29 were not married, 28% were married and 19% had a life partner.
The rate of marriages decreased by 8 percentage points in four years, and some atypical forms can now be registered in the whole of this age group (e.g. those who are divorced; people who are married but do not live with their spouse). The changing trend is even more characteristic with women. Compared to 2004, in 2008, the rate of change and rearrangement is, on average, 3 percentage points in the 20-24 age group. At the same time, a significant change took place in the marital status of women aged 25-29. Four years ago, 43% of women aged 25-29 were married, but now this rate is 35%. Another change worth mentioning is the 8% rate of women who are divorced, widowed or living in another form (e.g. those who are married but do not live with their spouse) in the 25-29 age group. Clearly, the marital status has become strongly differentiated and more diverse. The Flash Report – as a genre – is not suitable for a deep analysis, but still, it is worth considering whether the obtained results also indicate a crisis of the family as an institution.
A major difference can be further shown in the marital statuses of young people along social status. The extended period of youthful years is especially typical of children of parents with secondary or higher educational levels, because the higher the completed level of education by the mother or the father, the more likely the young person is to be single. Also, the opposite is true. The lower the parents’ educational level, the more likely it is that their child will soon leave the family circle, and s/he will have a spouse or a partner in life. This is almost a direct relationship. Fifty-nine percent of the children aged 15-29 of fathers with no more than a primary education are single, while this rate is 80% in the cases of fathers with a university/college degree.
Within the surveyed age group, the first “life partner” relationship comes, on average, at the age of 20.5, while the first marriage comes at the age of about 22.8. (Among the sampled persons, the youngest person to establish a life partner relationship was 12, and the youngest married person was 14.) Among women, the average age is lower in both cases: 20.07 years for life partners and 22.37 years for marriages. On average, men aged 15-29 start their first life partnership at the age of 21.19 , while they get married at the age of 23.85. Seven percent of those getting married are 18 years old or younger, 39% are aged between 19 and 22 years, three-tenths of them are aged 23-25 and one-fifth of them are older. More than one-third of those who are married previously lived together with their partners, while 7% claimed to be single at the date of the data collection, but had tried out life partnership earlier.
Table No. 1. Marital status according to gender and age groups, 2004-2008 (average score of answers)
Has a spouse or a
partner in life
Has a life
partner Single Other Total
(%)
15–19 men 2004 0 2 98 – 100
2008 0 1 97 2 100
20–24 men 2004 4 10 86 – 100
2008 5 11 83 1 100
25–29 men 2004 28 19 53 – 100
2008 20 18 57 5 100
Men on average
2004 12 11 77 – 100
2008 9 10 78 3 100
15–19 women 2004 1 5 94 – 100
2008 1 4 93 2 100
20–24 women 2004 14 21 65 – 100
2008 11 18 68 3 100
25–29 women 2004 43 22 35 – 100
2008 35 23 35 7 100
Women on average
2004 22 17 61 – 100
2008 17 16 64 3 100
Table No. 2. Average age of getting married and finding a life partner according to gender and age groups, 2004-2008
(average score of answers)
Men Women
2004 2008 2004 2008
Life partnership
Sample 21.1 21.2 20.0 20.1
15–191 16.9 16.6 16.3 16.9
20–24 19.8 19.8 19.2 19.1
25–29 21.7 21.9 20.8 20.8
Marriage
Sample 23.4 23.8 21.6 22.4
15–192 17.5 – 16.9 18.0
20–24 21.1 21.0 20.5 20.4
25–29 23.7 24.3 22.0 23.0
1 In the 15-19 age group, the element numbers are low, below 100 persons, in both surveyed years. Therefore, the figures are informative only. In the other age groups, minimum 150 persons belong to each category.
2 In the 15-19 age group, the element numbers are very low, a few (2-10) persons, in both years. Thus, the figures are indicative only. In the other age groups, minimum 150 persons belong to each category. The data are somewhat higher, still informative in the 20-24 age group. Here, the element number covers 50-200 persons.
Among the three large-sample youth surveys, this was the first time we tried to learn whether single people establish at least a partner contact even if they are not married or do not have a life partner ( i.e. whether
“single” actually means being alone). Currently, 40% of unmarried single youngsters have partners, or to put it in another manner, 60% of them are really alone. We presumed that – as the age increases – there are more people who have partners, although they do not want lasting relationships. This hypothesis cannot be verified. Thirty percent of those aged 15-19 and 50% of the respondents aged 20-24 have partners, but in the case of the 25-29 age group, the rate of establishing partner contacts once again decreases to 47%. This phenomenon needs more detailed analysis in the large-scale study of Youth2008.
There is an interesting trend in the educational level of the partners of people aged 15-29 who have spouses or life partners. The rate of partners with identical education is the highest (65%) among those with at most a primary education. This is a significant growth compared to 2004, while the equivalence is lower among those with skilled worker education (49%), above 50% among those with secondary education and the lowest (46%) among those with a university/college degree. The latter case means that some of those with a degree still choose a university/college student as a partner, and their educational level is still secondary. It can also be presumed that those with a degree who are already married (mainly women) live in a social space that is not suitable for mobilisation, and their life path is partly closed down by the relationship to a partner with lower education. As for the spouses or partners of those with high-level education, 2% have at most a (eight-year) primary education, 11% received vocational training and 41%
received secondary education.
Childbirth
Sixteen percent of the sampled young people already have their own child/ren. In this regard, the data collection registered a 4% decrease compared to 2004. Fewer people have one or two children, while the rate of those with more children is basically unchanged.
Two percent of those aged 15-19, 11% of those aged 20-24 and 33% of the older respondents have child/ren. The first child is born at the parent’s average age of 22.1 years. As can be expected, the age is younger with women (21.71 years) than with men (23.02 years). Within the sample of people aged 15-29 who have children, 16% have child/ren by the age of 18, 37% between 19 and 22 years, 29% between 23 and 25 years and 18% between 26 and 29 years.
Young people presumably get married in order to raise a family. About three-fourths of young married couples have child/ren, while this rate is only about one-third among those who have a life partner. The number of children is related to social status and to income. Fifteen percent of those with three or more children belong to the group of respondents who are in need, and this rate is 2% among those who have no children. Four percent of those with one child and 6% of those with two children are living under very difficult financial circumstances. Similarly, it is mainly those with several children who have difficulty with keeping body and soul together. Parallel with this, among those who claim to be in the lower social group, we found significantly more people with three or more children than people with no children.
Figure No. 3. Number of children those aged 15-29, 2000-2008 (average of answers)
Table No. 3. Average age of having child/ren according to gender and age groups (average of answers, number of respondents)
Men Women
average persons* average persons*
Sample 23.02 408 21.7 821
15–19 18.6 9 17.4 43
20–24 20.2 81 19.7 174
25–29 23.9 318 22.6 604
*The element numbers pertaining to the average are published due to the element numbers that are extremely low at places.
The registered low-child rate can theoretically be counterbalanced if young people decide to have more children later in life. About 9% of the 15–29 age group definitely claims not to want any (more) children, 8%
makes it subject to circumstance and 5% cannot answer this question. Thus, all in all, 68% said that they want to have (more) children. Among those who are currently raising kids, more than half of those with one child and about one-fifth of those with two kids want to have another child. Seventy-three percent of those who have no children yet plan to have a child, but 9% say that the later decision will depend on the circumstances. Most of the members of this group plan to have their first child at the age of 25 and 30. In the detailed analysis it is worth calculating the “total planned child number” index, which adds up the number of children planned and already born. On the basis of the changes in the index over time, one can survey the fertility preferences, the expected completed fertility, the future family types as well as the eventual spread of intentional decisions not to have children.
84 80 77
10 12 13
4 5 7
2 3 3
0% 20% 40% 60% 80% 100%
2008 2004 2000
has no child has one child
has two children has three or more children
Those who are not planning (additional) children primarily refer to financial reasons. This reason is followed by housing problems and work career. It is to be noted that some of the young people are also scared away by the extra tasks that are related to raising children.
In harmony with the data registered so far, those with a university/college degree score the highest rate (76%) with respect to the intention to have children. It is true though that they score the lowest rate among those who are already raising children. Seventy-two percent of those with secondary education and six- tenths of the respondents with lower education would like to have (additional) children. We would like to note that skilled workers and those with at most an eight-year primary school education show a lower willingness to have children than better educated young people, because they are who are already raising kids at a higher rate (15% of those with at most an eight-year primary school education and 26% of skilled workers have child/ren).
Medical publications have recently highlighted that more and more young people are coping with infertility problems. The sampled 15–29 year olds are open to various treatments against infertility and ultimately towards adopting a child. One-fourth of them would surely and another 31% would probably use infertility treatment. Forty-nine percent would surely or probably take part in a test-tube baby programme and 39%
would consider adoption.
Figure No. 4. Plans to have children according to the number of the existing children (in percentage)
10 20
53 73
77 72
37 13
11 6 8 9
2 2 2 5
0% 10% 20% 30% 40% 50% 60% 70% 80% 90% 100%
has three or more children has two children has one child has no children
plans does not plan depends on does not know
EDUCATION
Four years ago we stated that the life situation of the 15–29 age group is basically influenced by the phenomenon of expansion. The term of educational expansion can cover two aspects simultaneously, and our data show that both aspects are valid for young Hungarians. On the one hand, the average time that young people spend in the regular school system is increasing; on the other hand, more and more people go to school at any given point in time. The lifelong learning principle and the related efforts are given more and more emphasis in the educational policy of the world’s developed countries. In this regard, it should definitely be pinpointed by way of introduction that – as our surveys shows – young Hungarians who are currently learning, want to pursue studies until they are 22, on average; within this, the youngest ones (15- 19) want to study until the age of 21.5 years.
The 2008 data show that the expansion process is underway: at the time of data collection, 34% of the total sample was at school in 2000, while this rate was 40% in 2004 and 46% in 2008.
Participation in education
Figure No. 5. Rate of young people participating in education, 2000-2008.
(in percentage)
The rate of those participating in education has spectacularly increased over the past eight years, which is, on the one hand, attributed to the fact that the age limit of compulsory education is now 18 years, and on the other hand, due to the rise of socially expected educational levels. The biggest increase over the past eight years has been registered in the 20–24 age group.
34%
40%
46%
0%
5%
10%
15%
20%
25%
30%
35%
40%
45%
50%
2000 2004 2008
Table No. 4. Rate of participants in school education according to age groups, 2000-2008.
(in percentage)
Age groups Youth 2000 Youth 2004 Youth 2008
15–19 years 81 81 88
20–24 years 24 38 40
25–29 years 4 12 13
There seems to be no major change between 2004 and 2008 in the breakdown by various school types. At the date of data collection, more than one-fourth of the schoolchildren went to specialised secondary schools, slightly fewer students went to general secondary schools, and about every fifth of the respondents went to college. The question is: what might be the reason for the 3% decrease in the rate of university students, which was registered by the survey in 2008. However, for the most part, this reduction is also due to the impact of the Bologna process because – in order to provide for comparability with the earlier years – those people who are currently attending BA training were considered among college students3, although some of them will obviously also take part in MA training later.
At the same time, we need to mention that there are some respondents – in fact, slightly more than 1%
(102 respondents) of the total population – who did not finish primary school and do not go to school anymore. About one-third of them said that they did not complete school due to their bad results; another 25% passed the compulsory schooling age, and this is why they did not continue their studies, and a similar rate of the respondents mentioned family reasons for dropping out of school.
It is worth mentioning that about 1% of those who were covered by our sample were private students through their primary or secondary studies. It is remarkable that about one-fourth of those with primary education (more than 8% of the total population) are currently not pursuing any studies. This rate is 12%
among those who live in villages. This factor is mainly influenced by the educational level of the parents:
about one-third of children whose fathers have the lowest educational attainment are also not pursuing studies.
Table No. 5. Percentage breakdown of those studying in the school system, according to school types, 2000-2008.
School types Youth 2000 Youth 2004 Youth 2008
Vocational school, skilled worker training 11 13 12
Specialised secondary school 27 27 26
General secondary school 25 22 23
College 19 23 21
University 15 15 12
Other 3 - 5
3 We would like to point out that the traditional terms of „college” and „university” do not cover the school structure accurately in the wake of the expansion of the Bologna process. For the sake of clarity, college students are those who take part in first-level training in tertiary education as well as those receiving traditional college training, while university students are those attending high-level master training, traditional university as well as undivided training.
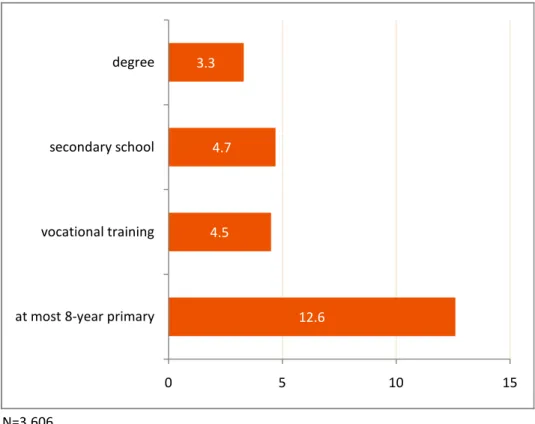
Similar to numerous other education-related analyses, our research highlighted the problem that, educational expansion does not mean that achieving a higher educational level than the former age groups would guarantee life security, a better financial position and a more favourable labour market status – this is implied, for example, by the theory of “inflating educational levels”.4 Furthermore, there is a high chance that the low educational level will send individuals into a hopeless situation. Figure No. 6 highlights the differences between two generations (participants in the survey with some educational level as well as their fathers’ levels). It can be clearly seen that there has been a major shift in the interim educational levels between the two generations – i.e. in the fathers’ generation skilled worker qualification was not only more frequent, but almost every second father had skilled worker qualifications (46%). Conversely, the GCSE exam is the most frequent educational level among their children (40%).
Figure No. 6. The educational levels of fathers and their children (percentage breakdown of the answers given in the merits)
The average educational levels increased over the past two decades. Later, the actual difference between the two generations will probably be larger than what we have measured, because many of the young people who are aged 15–29 and who are not pursuing studies currently (especially in the lower age groups) may later decide to attend further training schemes.
Of course, totally different individual reasons can be presumed behind the increased average educational levels between generations, and the educational level can be influenced by several factors.
The inequality between settlements is implied by the fact that those with the highest educational levels were registered in towns of county rank, primarily at county seats, but the respondents with a degree and secondary education are strongly overrepresented in Budapest. Maybe it is not surprising that young people's educational level is the least favourable among villagers – one-fourth of the youth only have primary education, and as little as one-tenth of them have a university or college degree.
4 Collins: The credential society. A historical sociology of education and stratification. New York, 1979, Academic Press.
22 18
46 27
24 40
8 15
0% 20% 40% 60% 80% 100%
father's education child's education
at most 8-year primary vocational training
secondary univ./coll. degree
Table No. 6. The highest level of completed education according to settlement types (percentage breakdown)
Settlement type The highest level of completed education Total At most 8-
year primary
Vocational
training Secondary Univ./college degree
Budapest 12 18 45 25 100
Town of county rank 9 25 39 28 100
Town 19 29 35 17 100
Village 24 32 33 11 100
Additional factors that influence the educational levels are related to the education of the parents. After a continued survey of economically active people, we need to draw the conclusion that the impact of the social background − measured through the father’s educational level − proves to be very significant. More than one-third of the fathers have at most a primary education, and this educational level is almost sure to carry the risk of labour market failures.
Among the children of fathers with primary educational and vocational training, more than 40% are characterised by one-tier upward mobility: they receive vocational training or have secondary education. Of course, all this merely comes from the attributes of structural mobility between the two generations, and – due to the educational expansion - this does not necessarily coincide with higher chances for the young people who belong to this group. Because we know that, as a matter of fact, even vocational training is likely to foreshadow low-level subsistence and long-time unemployment. Instead, we should rather say that all the people in these two groups (i.e. children of fathers with the lowest education) who are not upwardly mobile can, in fact, be regarded as disadvantaged in the labour market by at least one, but rather likely by two stages. In the other two education groups, the majority is composed by those respondents who have a similar educational level to their father. For example, more than half of the sons of fathers with secondary education also have a GCSE exam as the highest level of education.
Table No. 7. Completed education of young people according to their fathers’ educational level (in percentage)
Father’s highest education
Highest completed educational level (among economically active people)
Total
Primary school
Vocational
training Secondary College University
primary school 35 41 20 4 0 100
vocational training 7 37 43 11 2 100
secondary 2 14 54 24 6 100
univ./college/ high-level
specialised training 2 9 31 42 16 100
The settlement type and the parents’ educational level are not independent from each other (i.e. among villagers, a high rate is represented by those whose fathers had a low educational level), and in fact, the reasons behind most of the registered settlement-type inequalities are attributed to the fathers’
educational level. If we look at these two impacts together, the differences are even larger compared to the survey of the impacts one by one: 62% of the children (who already completed their education) of fathers living in country-rank towns and holding a degree also have a degree themselves. At the other end, only 2% of children whose fathers live in villages and have only a primary school education achieve a high- level education.
Economic activity and learning
In the preceding, we surveyed those who are not pursuing studies anymore in order to create a general picture about the highest completed education of young people.
Various groups can be sharply distinguished according to economic activity including young people who are not in school, and these groups are characterised by life situations that are totally different from each other. Thus, it is worth observing the relations between the educational level and the economic activity.
While the rate of those with at most a primary school education decreased to 8%, and the rate of those with at most vocational training decreased to 27% among economically active people. The majority of unemployed people are dominated by these two, low categories. In 2008, people with a primary school education are overrepresented in this category at a doubled rate, while people with high levels of education score exactly half their rate among unemployed people.
Table No. 8. The rate of young people with various educational levels in the economic activity groups, 2000-2008
(in percentage)
Economically active Inactive Unemployed
2000 2004 2008 2000 2004 2008 2000 2004 2008
primary school 10 11 8 25 36 39 26 30 35
vocational training 39 36 27 30 30 22 38 34 29
secondary 34 36 42 26 27 27 23 27 28
univ./college 11 17 23 6 7 12 3 9 8
other 6 – – 13 – – 10 – –
total 100 100 100 100 100 100 100 100 100
It is worth observing the relationship between the respondents’ economic activity and their fathers’
educational level. The majority of the young people pursue studies and work at almost identical rates (40%
and 38%, respectively). Higher-than-average deviations between groups with different backgrounds can be the least discernable in the rate of those who work (although the children of fathers with high education are underrepresented in this category). At the same time, while one-fourth of the children of fathers with primary school education pursue studies and about two-fifths of them neither work nor study (i.e. they are inactive), the majority (53%) of the children from those with high education exclusively study, and the rate of inactive people is only 5%.
Table No. 9. The economic activity of young people according to their fathers’ educational level (in percentage)
The fathers’ highest educational level Child
Studies Works Studies and works
None of
them Total
primary school 25 34 3 39 100
vocational training 37 42 5 16 100
secondary 45 37 8 9 100
univ./college/ high-level specialised
training 53 31 11 5 100
total 40 38 7 16 100
The impact of the Hungarian educational system intensifying social inequalities has been highlighted by numerous Hungarian and international research projects. The findings of the Youth2008 survey also reflect a similar picture. While only 1% of the children of parents with high education went to vocational training school at the time of our survey, this form of training (regarded as a dead-end street from many aspects) was attended by 9% of the children from fathers with at a most primary school education.
It is also worth pointing out with regard to the rate of education-related inequalities that – at the date of the data collection – out of 100 fathers with a primary school education, only one of their children went to university, while this figure is one in 15 in the case of children from fathers with high-level education.
Clearly, despite the wider expansion in higher education, it seems that the children of highly qualified parents are much more overrepresented than other groups, even if this training scheme is no longer a privilege for them.
Table No. 10. The rate of young people studying at various educational institutions according to their fathers' educational level
(in percentage)
The fathers' highest educational level
Primary school Vocational training GCSE exam Higher
Vocational school 9 7 3 1
Specialised secondary school 7 13 14 9
General secondary school 3 8 13 18
College 2 8 13 18
University 1 3 7 15
School-goers in total 22 39 50 61
Extended education, language skills, special classes
Exactly half of the total population would like to pursue extended studies or to attend some training scheme.
Thirty-five percent (i.e. more than one-third) of those who are in the most disadvantaged position from the viewpoint of education (i.e. those who only have primary school education and are currently not studying) are not even planning to pursue any studies in the future. It is to be emphasised that every second respondent (52%) who already has a degree said that they would like to learn more, and a similar answer was given only by 35% of those who received vocational training. Figure No. 7 illustrates what is specifically preferred by those who want to pursue some more studies.
Figure No. 7. Plans of young people about further studies (in percentage of mentions)
Learning languages is the most popular learning target. About two-thirds of the respondents (60%) claimed to speak some foreign language, but of course, this does not indicate the level at which they speak the given language. If we look a little bit closer at the language skills of young people, we can see that young Hungarians primarily speak English and German (if at all). At the same time, not even English and German score a high rate among those who speak the language very well (at a high level).
3 3 4
6 7
12 15
17 25
31 33
0 5 10 15 20 25 30 35
post-secondary training labour market training specialised sec. school training course Ph.D., DLA training comp. technology another profession GCSE exam profession college, university language
Figure No. 8. Foreign language skills and the level of knowledge (in percentage)
A major criticism about the Hungarian public educational system is that the schools are not able to satisfy the learning needs of children (and their families), and for this reason, those who go to special classes score a very high rate. This, in turn, further increases the social inequalities, because not all families can make the necessary financial sacrifices to pay for additional language education. Figure No. 9 illustrates the participation rate in various special classes.
3 1
2 2 4
5
32 36
1 1
1 3
21
35
1
4
7
1 1
1
2
2
0 10 20 30 40 50 60 70 80 90
other language Romanian Roma language Russian Spanish Italian French German English
basic level medium level high level at mother tongue level
Figure No. 9. Special classes attended in primary and secondary school (in percentage)
University and college students
Looking at the composition of those who go to college or university, it can be clearly seen that the institutions of higher education continue to be closed to the children of parents with a low educational level. The children of fathers with at most an eight-year primary education are in a more disadvantageous position than anybody else, and over the past eight years there have been no signs of any processes leading to more equal opportunities. If we compare the composition of college and university students, we can see that among college students, the kids of fathers with primary school educations are in a more disadvantageous position than anyone else. Also, among university students, the children of parents with a high-level of education are in an advantageous position, because they are overrepresented more than twofold among the other students.
2 6 5
7 5
6 3
5 10
14 18
10 9 12
8 13
13 15
15 13
32 31
2 1 3
1 1 2
2 8
8 10
0 10 20 30 40 50 60 70
other other arts computer techology music human subjects prep course second foreign language natural sciences sports foreign language maths
at primary school at secondary school at both schools
Table No. 11. The educational level of fathers among university and college students, 2000-2008 (in percentage)
The father’s educational level
University students College students
2000 2004 2008 2000 2004 2008
High-level 44 39 42 29 24 30
Secondary 31 38 35 33 38 34
Vocational training 22 22 22 32 33 33
At most 8-year
primary 3 1 1 6 5 3
Total 100 100 100 100 100 100
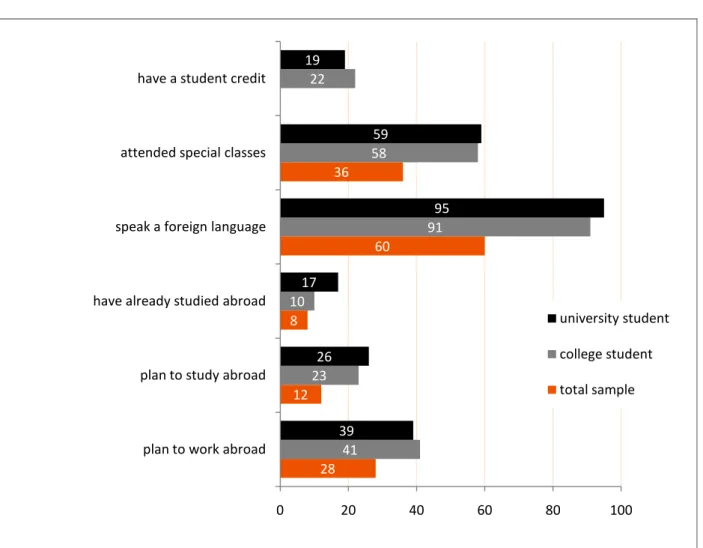
It is worth comparing – along certain dimensions – university and college students and those attending high-level training with the total population. It is worth pointing out with regard to figure No. 10, that the rate of those who speak foreign languages at some level is much higher (91% and 95%, respectively) among those attending high-level training than within the total population (60%). It seems to be another important impact that the majority of the university and college students (58% and 59%) attended special classes at primary or secondary school, while this rate is only 36% within the total population. Those who are planning to study abroad score the highest rate in speaking a foreign language among university students, and the rate of those who have already studied abroad is by far the highest among them (17%, compared to 10% among college students).
Closing the introduction of the educational section, we can draw similar conclusions as four years ago: the unequal opportunities in education that are due to social reasons (primarily financial and cultural capital brought within homes) continue to influence the education and the schooling opportunities of young generations at an unchanged intensity.
Figure No. 10. University and college students, comparison of the total sample under various aspects
(in percentage)
28 12 8
60 36
41 23 10
91 58
22
39 26 17
95 59
19
0 20 40 60 80 100
plan to work abroad plan to study abroad have already studied abroad speak a foreign language attended special classes have a student credit
university student college student total sample
Several of the problems incurred during the course of the quantitative research were covered in the focus group surveys. The following issues can be highlighted with regard to the topic of education:
Today, working is very frequent also among daytime students. The school and the workplace are not always in a continuous relationship with each other in terms of time.
The following figure illustrates some additional ways outside the direct relations that are available between school and workplace. The preferred school-workplace direction is symbolised by the thick, gray arrow. Exploring the preferences in the choice of school was one of the purposes of the research. As can be seen later, the selection proved to be unsuccessful in numerous cases, and the young persons concerned already abandoned their career path while still in the academic stage.
Some dropped out of the school system, and some others changed their major subject at school.
Furthermore, the completed or interrupted studies were not always continued at workplaces, and some people became unemployed.
Possible ways of transition between school and workplace
The learned professions and the acquired qualifications do not always meet the expectations of the labour market. The purpose of the survey is to explore the nature of these negative anomalies as well as to pinpoint proposals for solutions in each case.
School
The school was mentioned by the focus groups both as a positive and a negative element. Positive features are the good marks and praise by the teachers.
For example, when the teacher praises you for getting a good mark.
I am very happy when I get a good mark (mark five).
There are also some outstanding schools where it is natural that students get good marks.
That does not work with us, because the teachers take it for granted that we get good marks, since we go there to learn.
There are some situations where the students regard it as positive if they just manage to pass a test.
We take a test and I fail, but if I get mark 2, I am happy.
school workplace
retraining
unemployment school change
dropouts