1
Introduction
Biofuels have long been of interest to scientific research.
They have been promoted for a variety of reasons, including their potential for mitigating climate change. The majority of scientific papers appear to focus on the climate profile of biofuels. However, this topic gained further prominence when the concept of indirect land use change (ILUC) impact was introduced, which suggests that a more complete picture of the impact of biofuels is necessary. Accordingly, climate change is perhaps the most often used angle in research papers look- ing at biofuels. A relatively smaller share of studies focuses on environmental impacts, and research angles include bio- fuels’ impact on biodiversity, water and other environmental aspects. A substantial number of papers consider the so-called food versus fuel issue, that is, the food security dimension of biofuel production and use. Some authors focus on the agricul- tural aspects of biofuel production (Szabó, 2019). Combined, these topics are dealt with by the vast majority of research papers published in the scientific literature.
However, thus far, less attention has been paid to the rural development dimension of biofuel production. The impact of biofuel production on rural employment is a relatively little researched topic. By way of illustration, Wojan et al. (2014) stated that no research to that date had empirically evalu- ated the combined direct, indirect, and induced employment effects of ethanol plant operations in the US. The aim of our paper is to contribute to this particular aspect of the biofuel debate. Our aim is to investigate the local economic impact of a biofuel plant and in particular look at the impact on the number of jobs generated through an ethanol plant located in a disadvantaged rural region in Europe. Typically, biofuel plants are located in rural environments, often in the heart of areas that produce the feedstocks, and are embedded in the local economies. Biorefineries are plants producing a range of products from fuel, feed, food, green electricity, biochemicals to any other bio-based materials using feed- stock as biomass.
Biorefineries are enterprises closely linked to agricul- ture. The feedstocks used in the plants are typically locally sourced. Therefore, biofuel plants have a strong link to the farmers in their vicinity. In the United States (US), bioetha- nol plants are often run as co-operatives, where farmers have a stake in the plant. In Europe, except for instances where the plant is located close to a port and relies on imported feed- stock, the model is similar; a typical biofuel plant sources its feedstock from about a 50km radius, hence local farmers are its primary suppliers, and their business relationships are strong. The plant is significantly embedded in the local social and economic fabric. This notion is what makes biorefineries a special industry that has a close link to rural businesses, farming in particular.
Jobs are created directly (within the plants themselves) and indirectly (through impacting the regional economy).
Urbanchuk (2018) finds that when the direct, indirect and induced jobs supported by ethanol production, construc- tion activity, agriculture, exports, and R&D are included, the US ethanol industry supported nearly 360,000 jobs in 2017. Although not based on conventional biofuel feed- stocks such as sugars and starches, Thornley et al. (2014) found that for straw and woody biomass feedstocks, a sin- gle facility could generate tens of thousands of man-years of employment.
After solar power production, biofuel production may be the second largest employer globally in the renewable energy industry. IRENA (2016) reports that the total employment, including direct and indirect jobs, in the biofuel sector glob- ally amounted to 1.678 million in 2015. With 821,000 jobs, Brazil continues to have the largest biofuel workforce by far.
The US comes in second place with 277,000 jobs, followed by the European Union (EU) with 105,000 jobs. In total, the jobs created by the biofuel industry amount to about one fifth of the total jobs created by the global renewable industry.
Thus biorefineries may advance the socio-economic dynam- ics of the region, closing rural-urban income gaps and equal- ising intra-European disparities (Katainen, 2017).
Wim HEIJMAN*, Zoltán SZABÓ** and Esther VELDHUIZEN*
The Contribution of Biorefineries to Rural Development: The Case of Employment in Hungary
Most recent research concerning biofuels focuses on their potential for mitigating climate change, while their rural develop- ment dimension is given less prominence. Ongoing policy debates, including EU and US biofuel policies, pay little attention to this feature of the industry. This paper explores the impact of biorefineries on rural development, and employment in particular.
It shows that biorefineries can have a considerable economic impact on the regions in which they are located. Embedded in the local social and economic fabric, the paper demonstrates their influence on regional and national labour markets. The case of a bioethanol plant in Hungary and its effect on the rural labour market in two counties of the country is studied by way of an input-output model. The research has found that the operation of a biorefinery stimulates the creation and maintenance of jobs in both farming and service industries. Results suggest that biorefineries are an important driver of rural development and that this aspect of the industry should be given greater weight in formulating biofuel policies.
Keywords: Biofuels, Biofuel Policies, Ethanol, Rural Development, Input-Output Analysis, Employment JEL classifications: Q16, Q57
* Wageningen University, Department of Social Sciences, Netherlands.
** LátensDimenzió Consultancy, Budapest, Hungary. Corresponding author: zoltan.szabo@latensdimenzio.com Received: 11 October 2018, Revised: 14 February 2019, Accepted: 21 February 2019.
Biofuel Policies
There are substantial differences in the rationale behind biofuel policies in the various jurisdictions globally. In this section the brief history of and the justification stated in the three key jurisdictions; namely the European Union (EU), the United States (US) and Brazil, are discussed.
The EU laid out its initial biofuel policy in the 2003 directive (EU Directive, 2003), which stated that biofuels are primarily promoted for their contribution to climate change mitigation, energy security and promoting renewable energy sources. The European Union adopted its flagship regulation on biofuels in 2009 under the Renewable Energy Directive (RED). The RED’s overarching aim was to promote renew- able energy, which is explained as something that contrib- utes to climate change mitigation, promotes the security of energy supply (reducing dependence on imported oil), pro- motes technological development and innovation and pro- vides opportunities for employment and regional develop- ment, especially in rural and isolated areas. The RED deals with the sustainability criteria of biofuels, focusing primarily on their impact on climate change (including ILUC), biodi- versity and, to a lesser extent, on food security. Its impact on water and soil also gets mentioned.
The RED also states that “when favouring the develop- ment of the market for renewable energy sources, it is neces- sary to take into account the positive impact on regional and local development opportunities, export prospects, social cohesion and employment opportunities”. It must be noted that the above sentence and another with a similar meaning are the only references in the entire document to the impor- tance of considering the impact of the renewable energy industry on jobs. Also noteworthy is the fact that data is dif- ficult to find on the direct and indirect employment provided by the biofuel sector in the EU.
Arguably, the opportunities for growth and employment that an investment in the regional and local production of energy from renewable sources brings about in the Member States and their regions are important. The European Court of Auditors (2018) finds that even though the RED refers to the rural development dimension of renewable energy deployment in its recitals, there are no specific provisions in the legislative part of the Directive related to promoting rural development.
In Europe, in essence, the key reason for supporting bio- fuels appears to be climate change mitigation. The ongoing policy debate in the EU about RED II (the revision of the RED) reinforces the above-mentioned priorities and does not give prominence to employment impacts. As an illus- tration of these priorities, the impact assessment behind the RED II proposal states that “only direct, permanent jobs were estimated; construction jobs and indirect employment impacts were not assessed” (Impact Assessment, 2016). In other words, the job aspect appears not to have been given a priority. This conclusion appears to be reinforced by the findings of the European Court of Auditors (2018), which finds that the rural development dimension of renewable energy, including bioenergy, was not adequately considered in the Commission and the Member States’ policy frame- work.
The US is the world’s leading producer of biofuels, most notably ethanol. In the US, the primary impetus for biofuel policies has been the desire to become less dependent on for- eign oil, i.e. furthering energy security and supporting the agricultural industry. The history of the biofuel policy of the US can be traced back to the Energy Policy Act of 1992.
The Energy Policy Act of 2005 created the Renewable Fuel Standard (RFS), a centrepiece of the US regulation on bio- fuels, whereby a minimum volume of biofuels is required to be used in the transportation fuel supply in the US each year.
In 2007, another important regulation stressed the notion of
“Energy security through increased production of biofuels”.
The Environmental Protection Agency assessed the impact of the policy along the lines of reduced energy dependence, reduced fuel prices, reduced GHG emissions, increased farm incomes and impacts on trade, food price and air emissions.
The above listing includes impacts on employment or job creation as a decisive metric, whereby the outcome of the biofuel policy is to be evaluated on. The current policy debate in the US around the RFS is centred mostly around energy independence, fuel prices and impacts on farming, while job creation opportunities are not prominent in the debate.
Brazil is the world’s second largest producer of bioetha- nol. Brazil has perhaps the longest history, over four dec- ades, of biofuel policy. Its policy is based around its sug- arcane programme, unlike in the US and the EU where the dominant feedstock is grain, and corn in particular. Since 1976, blending ethanol into petrol has been mandatory. Bra- zil has the highest blending rate, currently at 27%, reflecting the strength of the sugarcane industry. The policy’s aim is primarily the promotion of the economy. The Brazilian etha- nol industry produces sugar as well as ethanol, and the two products are considered important. However, their impacts are difficult to disentangle. Hence the underlying justifica- tions behind the policies relate to both the biofuel and sugar businesses. Given that its policy is primarily an industry policy, economic contribution and employment impacts are prominent in the discussions about biofuel policies.
In summary, the key policy documents in the US and the EU, in contrast to Brazil, do not rely substantially on justifi- cation backed up by the rural development benefits, let alone the job creation opportunities. In the two major grain-based biofuel jurisdictions, especially in the EU, the benefits biore- fineries may bring to rural communities seem to have been neglected.
Methodology
In order to examine the economic impact of biorefineries in rural areas, the case has been specified for a business (Pan- nonia Ethanol) that operates an ethanol plant or a biorefinery in Dunaföldvár, Hungary (Annex 1). The biorefinery has a significant impact on the regional and national corn market, utilising about a million ton of corn each year, which is about 15% of total nation production.
The assessment has been carried out by means of an input output model (I-O model). Only the national I-O table is available in the national statistical datasets, therefore, by means of the RAS-procedure the regional I-O tables of Tolna
3 and Fejér, the two counties in Hungary directly impacted by
the operation of the plant, was calibrated. Furthermore, the multipliers per sector were determined such that the change in employment per sector can be measured.
The biorefinery produces bioethanol, animal feed, corn oil and other bio-based materials from feed grade corn as the feedstock used in processing. The ethanol is eventually blended in petrol and used as a biofuel. The plant was con- structed in 2010-2011, but capacity expansion investments have been undertaken on a constant basis and are continuing today. Farms in the regions of Fejér and Tolna supply over one million tons of corn to the plant each year. From this amount, the refinery produces 325,000 tons of animal feed, 450 million litres of bioethanol and 10,000 tons of corn oil.
Based on a grey publication (Koós, et al., 2016), the business directly employs 172 people and has created over 2,000 jobs indirectly, and it can be said that the economic impact on the region is significant.
The biorefinery is set on the banks of the Danube one hundred kilometres from Budapest, in the heart of Hungary’s corn growing region, with the nearest town Dunaföldvár, which has around ten thousand inhabitants (Annex 1). The major economic activity in this region is farming. The biore- finery has been expanding and has more than doubled in capacity since 2012. Besides producing bioethanol, the busi- ness is also engaged in the development of new bio-based technologies. It is clear that the business stimulates the local economy, but it is unknown to what extent (Major, 2016).
Therefore, the main aim of this analysis is to estimate the impact of the business on the local and national employment level. For this endeavour, the multiplier effects of the sectors of the two regions were to be determined. Additionally, the expenditures of the business in the different sectors were to be investigated such that the effects per sector can be meas- ured. Therefore, a standard tool, an input output (I-O) model has been built and calibrated to the regional economies of Fejér and Tolna. In this way, it can be simulated how the plant influences incomes, jobs and production output.
As stated above, it is expected that the development of biofuels in rural areas influence the local economy. A tool to measure the regional economic impact is the I-O model.
The model provides an answer to questions such as: How much additional employment will be generated due to the establishment of new biorefineries? The focus of this model is to measure the impact on output, additional income and employment. The model was originally developed by Leon- tief in the sixties, since then, it has been used to calculate the regional economic impacts of many activities (Heijman, et al., 2017).
The I-O model is one of the most commonly used mod- els in economic impact analysis (EIA). Other methods which can be used to measure the impact of new plants in regions are: the computable general equilibrium (CGE) model and the non-linear input output (NLIO) model. The CGE model is more extensive than the I-O model. With this model it is possible to provide an answer to more types of questions. Furthermore, it can be specified according to the economic reality. The downside of this model is that much more knowledge of economic and mathematical concepts is required for its application, also substantially more data is
required. Therefore, it is harder to apply this model in practi- cal studies, especially at the regional level. The NLIO model can be considered as an intermediate form between the I-O and the CGE models. This model can also take other issues into account, such as productivity changes and substitution, without an extreme increase in the data requirement (Klijs, 2016) .
Among these three models, the I-O model remains the most popular method for economic impact studies. The advantage is that the model is relatively simple and the com- putations can be done with standard software such as Micro- soft Excel. In addition, the model is well known, and the advantages and disadvantages are described in many publi- cations. Moreover, in the absence of a regional I-O table it is simple to generate one based on the national I-O table. This is convenient when there is no time to conduct an extensive survey in a particular region. Further, the I-O model requires a relatively modest amount of data. Still, the outcome of the table is detailed and shows the impact on production, value added, income and employment, in total and by sector (Klijs, 2016).
The model also has its disadvantages, which should be taken into account before application. Most of the disadvan- tages are strongly dependent on the assumptions made in the research. First of all, in the case of our research, the model is based on technical coefficients that are fixed ratios between the total revenues and the expenditures of a sector. This rela- tionship implies that a change in the final demand will never lead to productivity changes, which would not necessarily be the case in reality. Furthermore, the model does not consider substitution as a possibility.
In reality, substitution of production factors may occur.
This is not accounted for in the I-O model. Secondly, the model does not provide answers to detailed questions. Thus, it is not possible to say anything about the impact of lower or higher subsidies on the production of ethanol for instance.
Also, the model only predicts the impact on regional level and cannot be specified to municipalities. Thirdly, the I-O model only shows the differences between the old and the new equilibrium demand. In reality this can take quite some time before an economy will adapt to the changes in the final demand and quantities. Lastly, in some cases the I-O table is not available and hence needs to be created. The process requires assumptions about employment and the shares of regions in sectors and these assumptions may lead to a distorted image of reality. Moreover, research needs to determine how to collect the necessary data to determine the change of the final demand. The decision can be complicated since it is hard to determine how much money will be spent if the money is not actually there already (Heijman, et al., 2017).
Although some scientists advocate the usage of the more advanced models, such as the CGE and the NLIO models, their use is not always necessary. In order to measure the regional impact of the biorefinery some assumptions need to be made, but the case is relatively small, making the I-O model applicable.
First, an appropriate scale for the I-O table and data must be chosen. The NUTS classification (Nomenclature of terri- torial units for statistics) is a hierarchical system for dividing
the economy territory of the EU. These classifications are made with the purpose to 1) collect, develop and harmonize the European regional statistics, 2) analyse socio-economic regions and 3) frame the European regional policies. For our research only the second point is of relevance. The statistical database of the European Commission distinguishes three
‘levels’ within a country, namely:
NUTS 1: Major socio-economic regions
NUTS 2: Basic regions for the application of regional policies NUTS 3: Small regions for specific diagnoses
The NUTS 1 regions are the major economic regions, which are divided into NUTS 2 regions, which are finally further divided into NUTS 3 regions. It is important to use these classifications since the data (value added, employment rate and output per industry) are per NUTS region. Hungary has in total 20 NUTS 3 units, 7 NUTS 2 units and 3 NUTS 1 units (Eurostat, 2013).
The following division applies for Hungary:
• NUTS 0 region ‘Hungary’, HU
• NUTS 1 region ‘Dunántúl’, HU2
• NUTS 2 region ‘Közép-Dunántúl’ HU21
• NUTS 3 region ‘Fejér’, HU211
• NUTS 2 region ‘Dél-Dunántúl’ HU23
• NUTS 3 region ‘Tolna’ HU233
Annex 1 shows all the NUTS regions of Hungary. As stated above, the regions Fejér HU211 and Tolna HU233 are NUTS 3 regions. These are the regions in which the impact of the biorefinery is the most apparent.
After examining which NUTS regions are of interest, one should determine the national economic activity per sector as well as the national and regional employment rates per sector. Unfortunately, there are no I-O tables available for these regions, but they can be constructed through the RAS procedure based on the national I-O table combined with the employment rates per sector. Each region should be treated separately. Thus, the procedure must be carried out twice.
The national I-O table of 2016 can be obtained from the Hungarian Central Statistical Office. Before regionalizing the national I-O table, it is useful to split the industry into separate sectors. Since it is unclear at the start in which sec- tor the business has the largest impact, all sectors will be taken into account.
The following nineteen sectors will used:
• Agriculture, hunting, forestry and fishing
• Mining and quarrying
• Manufacturing
• Electricity, gas and water supply
• Water supply, wastewater collection and treatment, waste management and pollution treatment
• Construction
• Wholesale and retail trade, repair of motor vehicles and household goods
• Transport and storage
• Hotels and restaurants
• Information and communication
• Finance and insurance
• Real estate, renting and business activities
• Professional, Scientific and engineering activities
• Administrative and support service activities
• Public administration and defence as well as compul- sory social security
• Education
• Health and social work
• Arts, entertainment and recreation
• Other activities
By compressing the industry into nineteen sectors the I-O model is easier to conduct. With the I-O table, it is possible to visualize how much each sector contributes to itself or to the other sectors since the product of one sector can be used as an input for another sector. In tables in Annex 2 and 3 the rows record the outflow of production, showing how the pro- duction of an activity sector is distributed among the other sectors of the economy. The columns of the table record the necessary inputs for production, showing the structure of inputs used by each sector of the productive activity. The totals of the columns and the rows record the total output of each sector, which should be equal, thereby indicating the balance of the economy where the costs of each sector are equal to their respective revenues.
The national I-O table describes the linkages within an economy at a specified point in time. It records the various interdependencies between the various sectors in the econ- omy and their consumption of intermediate goods and ser- vices. Furthermore, it also describes the final demand of the sectors, the exports, the imports and the value added. For this model three important economic assumptions are needed: (i) a production function with constant return to scale, because of the fixed technical coefficients; (ii) each sector produces unique products which are not produced by other sectors and (iii) sufficient production capacity (Brand, 2012).
The regional I-O table can be considered a scaled-down version of the national I-O table. This will be derived through a mathematical procedure. This requires information, such as sector sizes, on the national and regional levels in order to create the regional input output table. This information can be calculated with the use of different methods. The RAS procedure will be applied since this method is considered appropriate for the available data. A description of the RAS procedure is as follows.
The available data are the national employment rates and the employment rates in Fejér and Tolna. We can assume that the work efficiency on the national level is equal to the local work efficiency. The RAS procedure is considered an appli- cation of the bi-proportional matrix scaling algorithm, which was proposed by Stone (Lahr and De Mesnard, 2004) and elaborated on by Szabó (2015).
The initial matrix is the national table. The regional table is assumed to be identical to the national one (Zo=Zn).
However, this will not satisfy the equality criteria between the total of the rows, columns and regional frames. Thus in order to scale down the national table, the rows need to be multiplied with a ratio such that the regional frame and total supply in Z are equal. In our case the ratio is the employment ratios of each region (Fejér and Tolna). Secondly, the same procedure should be done for the columns. The row scaling ratio (column vector) is
5 The intermediary demand can be derived from the rev- enue received by the sectors of the economy. As already mentioned the technical coefficients, matrix A, represents the relationship between the total revenue of the sectors and the intermediary inputs they demand. Matrix X represents the total supply of the sectors as well as their total revenue. From these definitions it follows that the matrix Int. can be created by multiplying A with X:
. .
. .
.
( ) .
r Z
Z
s Z
Z Z r Z S Int F X Int AX AX F X
X I A F
i
j ij
r ir
i
i ij
r ir 1
1
1
1
2 1 0 1
1D
=
=
=
+ =
=
+ =
= - -
T V
/ /
(4) These two equations can be combined such that the fol- lowing equation will appear:. .
. .
.
( ) .
r Z
Z
s Z
Z Z r Z S Int F X Int AX AX F X
X I A F
i
j ij
r ir
i
i ij
r ir 1
1
1
1
2 1 0 1
1D
=
=
=
+ =
=
+ =
= - -
T V
/ /
(5)
This equation can also be expressed as:
X = (I – A)-1F. (6)
where I for the Unity Matrix. Writing it in first differ- ences gives:
ΔX = (I – A)-1ΔF. (7)
Equation (8) shows that a change in demand (∆F) mul- tiplied by the multipliers (matrix (I-A)-1) will lead to the change in the total output (ΔX). In this way equation (8) immediately reveals how much the total output per sector will change based on a change in the final demand. (Heijman et al., 2017).
The model predicts that if the output in one sector increases, the output of other sectors to a certain extent will also increase. In this way expenditures of a business affects the economic development of a country directly as well as indirectly. In our research we will look at the effect of the influx of money from a biofuel refinery on the employment rate. Thus, the following hypothesis will be tested: ‘The expenses of the ethanol plant in several sectors leads to an increase in job opportunities in the regional as well as the whole economy’. Using the I-O model the impact of the expenditures of the biorefinery on output per sector has been analysed. The increase in output will eventually lead to more jobs in the sectors. The model predicts that economic growth within one section stimulates growth in other sectors due to the multiplier effect.
The primary input for the production of ethanol is corn;
hence, the agricultural sector will probably experience a sharp rise in demand. This increase will be mostly notice- able in the surrounding regions of the bioethanol plant, thus in Tolna and Fejér. The ethanol is transported to other regions and abroad; the transport sector is strongly involved.
It will depend on the transport services for which regions will benefit the most from this increase in demand. The next sector that should experience considerable economic growth is the manufacturing sector, followed by the ser- vice industry. The plant initially employed 172 people plus external personnel for maintenance support, thus it stands to reason that this sector will experience a direct increase in employment opportunities. In short, it is expected that
. .
. .
.
( ) .
r Z
Z
s Z
Z Z r Z S Int F X Int AX AX F X
X I A F
i
j ij
r ir
i
i ij
r ir 1
1
1
1
2 1 0 1
1D
=
=
=
+ =
=
+ =
= - -
T V
/ /
(1) where,
. .
. .
.
( ) .
r Z
Z
s Z
Z Z r Z S Int F X Int AX AX F X
X I A F
i
j ij
r ir
i
i ij
r ir 1
1
1
1
2 1 0 1
1D
=
=
=
+ =
=
+ =
= - -
T V
/ /
implies the actual regional data and
. .
. .
.
( ) .
r Z
Z
s Z
Z
Z r Z S Int F X Int AX AX F X
X I A F
i
j ij
r ir
i
i ij
r ir 1
1
1 1
2 1 0 1
1D
=
=
= + =
= + =
= - -
T V
/
implies the sum of the stabilised table by j. In this equation,
/
if
. .
. .
.
( ) .
r Z
Z
s Z
Z Z r Z S Int F X Int AX AX F X
X I A F
i
j ij
r ir
i
i ij
r ir 1
1
1
1
2 1 0 1
1D
=
=
=
+ =
=
+ =
= - -
T V
/ /
< 1 then the elements in row i of the estimated table are higher than they should be and vice versa. Thus, the rows of the estimated table will satisfy the regional constraints by multiplying the table by this vector. In this stage the column totals will differ from the regional column frame. Therefore, the same procedure has to be applied for the columns as well.
The column scaling ratio (row vector) is
. .
. .
.
( ) .
r Z
Z
s Z
Z Z r Z S Int F X Int AX AX F X
X I A F
i
j ij
r ir
i
i ij
r ir 1
1
1
1
2 1 0 1
1D
=
=
=
+ =
=
+ =
= - -
T V
/
/
(2)The previous elaborations also account for this situation;
if
. .
. .
.
( ) .
r Z
Z
s Z
Z Z r Z S Int F X Int AX AX F X
X I A F
i
j ij
r ir
i
i ij
r ir 1
1
1
1
2 1 0 1
1D
=
=
=
+ =
=
+ =
= - -
T V
/
< 1, then elements in the estimated table are higher than
/
they should be. Thus, they need to be scaled down by
. .
. .
.
( ) .
r Z
Z
s Z
Z Z r Z S Int F X Int AX AX F X
X I A F
i
j ij
r ir
i
i ij
r ir 1
1
1
1
2 1 0 1
1D
=
=
=
+ =
=
+ =
= - -
T V
/
to
/
achieve consistency (
. .
. .
.
( ) .
r Z
Z
s Z
Z Z r Z S Int F X Int AX AX F X
X I A F
i
j ij
r ir
i
i ij
r ir 1
1
1
1
2 1 0 1
1D
=
=
=
+ =
=
+ =
= - -
T V
/ /
).
At this stage, it is likely that the rows will no longer sat- isfy regional constraints, thus the procedure has to be started again. The sequential repetition of step 1 and step 2 will adjust the initial table to be constrained by regional frames.
Usually the procedure is convergent and after a few itera- tions, the estimated values will be very close to the regional frames (Szabó, 2015).
Through the RAS method the regional input output tables are created (see Annexes 2 and 3). The second step is to determine the technical coefficients. The technical coefficients are needed in order to calculate the multipliers such that one can calculate the direct and indirect effects of a change in the final demand. If the demand changes, the household incomes will change as well, which will lead to a change in employment. In this case, it is interesting to examine to what extent the increase in demand for inputs such as corn will lead to more jobs.
The multipliers are mathematically derived from the regional I-O table. It is important to realise that the model does not take increasing returns to scale into account, but only assumes a linear relationship between input and out- put. Moreover, all firms in a given industry are assumed to employ the same production technology.
The initial monetary values in the transaction matrices can be converted into ratios via the so-called technical coef- ficients. The technical coefficients, matrix A, represent the relationship between the total revenue of the sectors and the intermediary inputs they demand. This conversion can be done by dividing each cell of the domestic intermediate matrix by its column total (output at basic prices). This com- putation should also be done for the imports (intra and extra EU) and the added value.
As stated above the matrix visualises the intermediary demand. The following equation describes the intermediary demand (Int.) plus the supply to the final demand (F), which is equal to the total supply (X).
. .
. .
.
( ) .
r Z
Z
s Z
Z Z r Z S Int F X Int AX AX F X
X I A F
i
j ij
r ir
i
i ij
r ir 1
1
1
1
2 1 0 1
1D
=
=
=
+ =
=
+ =
= - -
T V
/ /
(3)
there will be a rise in jobs due to the expenditures of the biorefinery in the Hungarian economy.
Results
This section presents the results derived by the use of the input output analysis. The data needed for the I-O table was obtained from the website of the Hungarian Central Statisti- cal Office. In cooperation with the biorefinery the regional I-O table has been created for the regions of Tolna and Fejér (see Annex 2 and 3).
The multiplier effect is caused by an increase in the final demand (an impulse) within the economy. This extra demand leads to more supply, which will lead in turn to a higher income and eventually to higher expenditures. The multiplier effect refers to the increase in the total output aris- ing from any new impulses in a sector of the economy. The multipliers have been estimated with the use of the national and regional I-O tables. These multipliers concern the so- called Type 1 multipliers, which do not take into account the
increased spending because of higher incomes (Perez-Verdin et al., 2008).
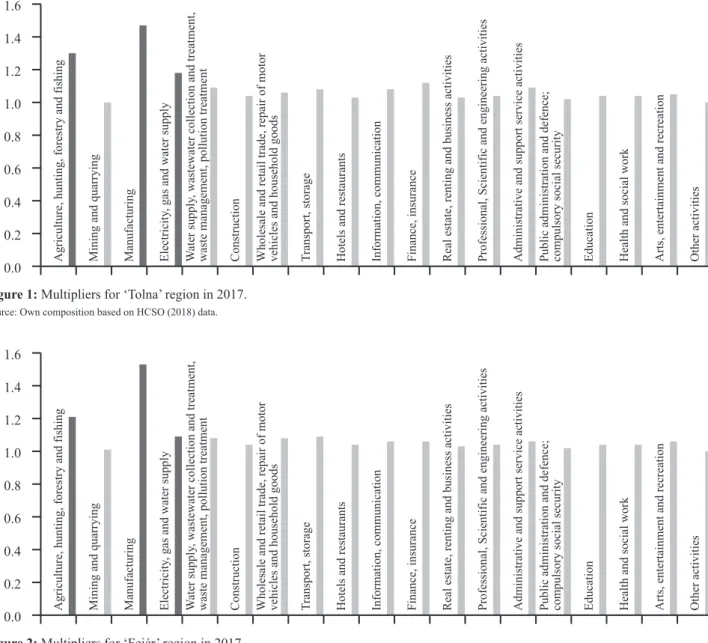
For this research it is interesting to examine which secto- ral impulse generates the highest regional impact (see Figure 1 and 2). The following sectors contain the highest multi- pliers: Agriculture, Hunting and Fishing (1.30 Tolna; 1.21 Fejér), Manufacturing (1.47 Tolna; 1.53 Fejér) and lastly Electricity, Gas and Water supply (1.18 Tolna; 1.09 Fejér).
The multiplier effects at the national level slightly differ from ones at the regional level. The effects are the highest in the following sectors: Agriculture (1.27), Manufacturing (1.49) and Finance and Insurance (1.25). At the regional level the multiplier effect of the Finance and Insurance sector is smaller. The plant spending one HUF extra in the agricul- tural sector of Tolna will lead to a total effect of 1.30 HUF.
This is because an impulse in one sector stimulates other sectors indirectly. From these results we can conclude that the expenditures of the biorefinery have the highest regional impact in the following sectors: agriculture, manufacturing and electricity.
0.0 0.2 0.4 0.6 0.8 1.0 1.2 1.4 1.6
Other activities
Arts, entertainment and recreation
Health and social work
Education
Public administration and defence; compulsory social security
Administrative and support service activities
Professional, Scientific and engineering activities
Real estate, renting and business activities
Finance, insurance
Information, communication
Hotels and restaurants
Transport, storage
Wholesale and retail trade, repair of motor vehicles and household goods
Construction
Water supply, wastewater collection and treatment, waste management, pollution treatment
Electricity, gas and water supply
Manufacturing
Mining and quarrying
Agriculture, hunting, forestry and fishing
Figure 1: Multipliers for ‘Tolna’ region in 2017.
Source: Own composition based on HCSO (2018) data.
0.0 0.2 0.4 0.6 0.8 1.0 1.2 1.4 1.6
Other activities
Arts, entertainment and recreation
Health and social work
Education
Public administration and defence; compulsory social security
Administrative and support service activities
Professional, Scientific and engineering activities
Real estate, renting and business activities
Finance, insurance
Information, communication
Hotels and restaurants
Transport, storage
Wholesale and retail trade, repair of motor vehicles and household goods
Construction
Water supply, wastewater collection and treatment, waste management, pollution treatment
Electricity, gas and water supply
Manufacturing
Mining and quarrying
Agriculture, hunting, forestry and fishing
Figure 2: Multipliers for ‘Fejér’ region in 2017.
Source: Own composition based on HCSO (2018) data
7 The increase in demand (the impulse) can be estimated
using the expenditures figures of the business among all of the sectors. In 2016, the biorefinery spent 58,116 mil- lion HUF in total on production factors and labour (Table 1). These expenditures, together with the expenditures of the households of the employees, form the total economic impulse. Remarkably, the results show that the biorefinery spends most of its money outside the regions of Tolna and Fejér. Hence, one can assume that the total impact of the biorefinery can be greater at the national level than at the regional level. Moreover, it is interesting to examine in which sectors most of the money is spent.
The majority of the expenditures of the biorefinery and the households were spent in 2016 in the Agriculture, Hunt- ing and Fishing sector (more than 70%), with the remainder being spent in Electricity, Gas and Water supply (around 10%) and Transportation and Storage (6-7%). Smaller parts are spent in Construction (around 2%), Professional and Sci- entific Engineering (around 2%) and Public Administration and Defence (around 3%) (see Table 1).
The importance of the expenditures in the sectors will be further detailed when analysing the change in employment.
As already shown, the multiplier effect is the highest in the sectors of Agriculture, Fishing and Hunting and Electricity, Gas and Water supply. Therefore, it is reasonable to assume that an increase in jobs will be significant in these two sec- tors at the national as well as local level.
The biorefinery´s expenditures lead to a change in the total output of Hungary. Using the calculated multipliers, an esti- mation can be made on the size of the change. With the use of the national output per sector and the national employment rates, it is possible to estimate the labour productivity per Full Time Equivalent. Moreover, we assume no variation across regions in Hungary in labour productivity. Since it is reason- able to assume that labour productivity differs between coun- tries, we only focus on the changes in output within Hungary.
The biorefinery spent 58,116 million HUF in total in 2016, mostly in the agricultural sector (Table 1). If we take the change in output, ∆F, and we multiply this with the multipli- ers, we will get the total change in output per sector. In order
0.0 0.2 0.4 0.6 0.8 1.0 1.2 1.4 1.6
Other activities
Arts, entertainment and recreation
Health and social work
Education
Public administration and defence; compulsory social security
Administrative and support service activities
Professional, Scientific and engineering activities
Real estate, renting and business activities
Finance, insurance
Information, communication
Hotels and restaurants
Transport, storage
Wholesale and retail trade, repair of motor vehicles and household goods
Construction
Water supply, wastewater collection and treatment, waste management, pollution treatment
Electricity, gas and water supply
Manufacturing
Mining and quarrying
Agriculture, hunting, forestry and fishing
Figure 3: Multipliers for Hungary in 2016.
Source: Own composition based on HCSO (2018) data.
Table 1: Expenditures of the biorefinery per sector in 2016 (Millions of HUF).
National Tolna Fejér
Agriculture, hunting, forestry and fishing 41,631.83 6,249.71 2,926.83
Mining and quarrying 19.20 5.99 9.30
Manufacturing 1,738.64 111.90 863.61
Electricity, gas and water supply 5,895.87 243.78 14.13
Water supply, wastewater collection and treatment, Waste management and pollution treatment 14.55 4.54 7.04
Construction 1,209.83 302.51 302.65
Wholesale and retail trade, repair of motor vehicles and household goods 5.66 1.77 2.74
Transport and storage 3,728.45 283.66 268.02
Hotels and restaurants 130.02 21.81 39.02
Information and communication 41.75 13.03 20.21
Finance, and insurance 449.55 12.98 20.13
Real estate, renting and business activities 97.39 30.40 47.14
Professional, scientific and engineering activities 1,069.12 0.33 0.51
Administrative and support service activities 353.56 106.14 20.14
Public administration and defence as well as compulsory social security 1,651.03 495.32 0.63
Education 13.69 4.27 6.63
Health and social work 21.82 6.81 10.56
Arts, entertainment and recreation 18.51 5.78 8.96
Other activities 25.78 8.05 12.48
Total Expenditures 58,116.26 7,908.77 4,580.73
Source: Own composition based on HCSO (2018) data.
to estimate the change in employment per sector the last step is to divide this change in output by the labour productivity per sector. The main findings are displayed in Figure 2.
Given the increase in expenditures in the agricultural sec- tor, we see that this sector will experience the sharpest rise in the number of jobs. At the national level the biorefinery gener- ates 3,859 jobs in the agricultural sector. In Tolna and Fejér, this number corresponds to 594 and 261 jobs, respectively.
The Transport and Storage sector also shows a sharp increase in employment. However, in comparison to the agricultural sector the change in employment is higher at the national level than at the regional level. Therefore, we can conclude that the biorefinery mainly uses transport facilities outside the regions of Tolna and Fejér. The construction, the manufacturing, the electricity, gas and water supply and the trade and repair sec- tors show a significant increase in jobs as well.
The biorefinery has kept expanding and will continue to do so in the next couple of years, but this trend may slow down in the mid future. Thus, it is possible that the expendi- tures for construction will decrease in the future, which will have a mitigating effect on the rise of employment in the construction sector. The increase in jobs is partly due to con- stant expenditures and partly due to one-time expenditures in the establishment of the plant.
Overall, the biorefinery creates around 5,500 jobs. This is a large number if we take into account that directly the plant itself employs only 172 people. This means that the number of indirect jobs connected to the biorefinery includes more than 5,000 jobs in total. At the regional level this is approximately 785 jobs in Tolna and 416 jobs in Fejér coun- ties. These numbers show that the biorefinery creates jobs at the regional as well as national level. These numbers are estimated using the 2016 expenditures, and therefore may change over the years.
Discussion and Conclusions
The results of our research show that at the national level the number of jobs related to the activities of the biorefinery
is around 5,500 jobs. For the regions Tolna and Fejér this number corresponds to 785 and 416 jobs, respectively. These figures are significant compared to the size of the regions assessed. Furthermore, the reason behind the relatively high figures may be the specific nature of biorefineries; embedded in the local economy, low level of inputs from outside of the region, most expenditures have impacts within the region, which, as a consequence, may lead to largely keeping the jobs created in the region and in the country.
Direct and indirect jobs are also created. While Huns- berger et al. (2017) fails to consider indirect jobs in the ser- vice sector and therefore their analysis is lacking, the latter category appears larger. Our finding shows that the number of jobs created indirectly in the agriculture and services industries are more than an order of magnitude higher than jobs created and maintained within the plant gates (5.000 v 172). Little previous research has focused on indirect jobs;
however, our modelling underlines their importance. Fur- thermore, biorefineries are embedded in the local economy;
therefore, most expenditures lead to jobs being created in the region, more specifically in the rural areas, because the major inputs for the biorefinery are generated by agriculture.
The significance of the national jobs with respect to county level ones may be due to the fact that biorefineries operate across the borders, i.e. the products they make are sold across countries. For instance, ethanol is a commod- ity freely traded on the European market and beyond. This notion implies that the adjacent service industry may be of cross-boarder character, and, as a result, jobs created and maintained are not strictly rooted in the local or regional economies.
The value of the multipliers is in line with results from similar analyses. For example Heijman et al. (2017) com- puted regional multipliers for the 12 Dutch Provinces, of which results are comparable to the findings in this article.
Though we are of the opinion that our results are rather robust, in order to find out how much changing the assump- tions may modify results, it may be considered to carry out a sensitivity analysis in a follow up study. This may concern variations in sectoral and regional labour productivity and 3,500
4,000
0 100 200 300 400 500 600
Fejér Tolna
National
Transport, storage Agriculture Wholesale and
retail trade…
Construction Electricity, gas and
water supply Manufacturing
Figure 4: Expected increase in the number of jobs per sector.
Source: Own composition based on HCSO (2018) data.
9 other assumptions. For a reasonable range of values concern-
ing these variables, a considerable impact on the final results is not to be expected.
Ultimately, the results show that there is a considerable contribution by the biorefinery to the Hungarian economy.
What has not been discussed is its effect on the surrounding countries. Unfortunately, it is difficult to make an educated guess regarding the extent to which trading partners benefit in terms of jobs. The use of the I-O model is insufficient for answering such a question, since it makes use of the national labour productivity. One cannot assume that the labour pro- ductivity is the same for all European countries. Nonethe- less, it is reasonable to assume that the surrounding countries will experience an increase in the demand for their products.
Looking at the results, it can be expected that the imports will increase in comparison to the previous situation. Thus, it is likely that the surrounding countries will also experience some rise in employment. We can conclude that there must be a positive effect on those countries; only the size of this effect is unclear.
Since its primary input is corn, the bioethanol plant we examined increases the demand in the agricultural sector sig- nificantly. The service industries, including the construction, logistics and administrative sectors, have also experienced an increase in demand. The increase in demand in these sec- tors leads to an indirect demand effect in the remaining sec- tors. Due to the multiplier effect and the increase in demand the economy as a whole grows, which leads to more jobs at the national level.
Our conclusion is that the spending of the biorefinery in the agricultural sector significantly effects the economic development at the national as well as regional and perhaps international level. In particular, rural areas benefit from this type of spending, since biorefineries are typically located in rural settings. The resulting increase in jobs may help rural regions overcome poverty and can positively influence the national and European economy as a whole. Our results appear to be in line with figures presented by IRENA (2017) and Urbanchuk (2018). Based on this result it may be a good idea to explore the potential in Europe and elsewhere to expand the production of biofuels to foster rural develop- ment.
As a thought experiment, the European context and potential may be scaled by a simple calculation. 5.81 bil- lion liters of bioethanol was produced in Europe in 2015 (ePURE, 2017). The production of the biorefinery in ques- tion (450 million litres) amounted to 7.7% of total European bioethanol production. To put the findings into perspective, provided the impact on jobs does not differ significantly across the European bioethanol industry, we may extrapo- late that about 70 thousand jobs are created and maintained in various rural regions in Europe by the European ethanol industry (5,500 divided by 7.7%). Needless to say that the actual impacts of each biorefineries are different, depending among other things on their technology, spending patterns and the contexts of the regional economies, so more research is warranted to extrapolate to European context.
The revision of the Common Agricultural Policy (CAP) offers an opportunity to consider rural development impacts of EU policies. One of the objectives of CAP reform has
been to foster rural development. Our finding suggests that biorefineries may be seen as a useful element in achieving such objective. In addition to the CAP, it is proposed that the Renewable Energy Directive as well as other energy, cli- mate, agriculture or transport related policies are to consider the rural development dimension of biofuels, or the bioec- onomy in general.
Acknowledgement
Authors would like to thank Katalin Tarr for her work in data processing.
References
Brand, S. (2012): A note on methdos of estimating regional input- output tables: can the FLQ improve the RAS algorithm, Plymouth: Plymouth Univesity.
ePURE (2017): European renewable ethanol production.
https://www.epure.org/media/1469/production.png
EU Directive, 2003. Directive 2003/30/EC of the European Parlia- ment and of the Council of 8 May 2003 on the promotion of the use of biofuels or other renewable fuels for transport. Brussels, Belgium
European Court of Auditors (2018): Renewable energy for sustain- able rural development: significant potential synergies, but mostly unrealised. Special report no. 5.
Eurostat (2013): European Election Database-Administrative divi- sions in Hungary - NSD. Available at: http://www.nsd.uib.no/
european_election_database/country/hungary/administrative_
divisions.html (Accessed 3/7/2017).
Heijman, W. J. M., Klijs, J., Peerlings, J.H.M., Rouwendal, J. and Schipper, R.A. (2017): Space and economics: an introduction to regional economics. second ed. Wageningen: Wageningen Academic Publishers.
Impact Assessment (2016): Commission Staff Working Document, Impact Assessment. Accompanying the document Proposal for a Directive of the European Parliament and of the Council on the promotion of the use of energy from renewable sources (recast) {COM(2016) 767 final} {SWD(2016) 419 final}.
Brussels, 30.11.2016, SWD(2016) 418 final, PART 3/4 IRENA (2017): Renewable Energy and Jobs Annual Review 2016.
Hunsberger, C., German, L. and Goetz, A., 2017. “Unbundling”
the biofuel promise: Querying the ability of liquid biofuels to deliver on socio-economic policy expectations, Energy Policy, 108, 791-805 https://doi.org/10.1016/j.enpol.2017.04.017 Katainen, J. (2017): Bioenergy for rural development: an engine of
growth for a rural renaissance. Brussels, Belgium
Klijs, J. (2016): Tourism, income, and jobs: improving the measure- ment of regional economic impacts of tourism. Wageningen:
Wageningen University.
Koós, B., Király, G., Hamar, A. and Németh, K. (2016): Sustain- able Rural Renaissance: The case of a Biorefinery, Budapest, Hungarian Academy of Sciences.
Lahr, M.L. and de Mesnard, L. (2004): Biproportional tech- niques in input-output analysis: Table updating and struc- tural analysis. Economic Systems Research, 16 (2), 115-134.
https://doi.org/10.1080/0953531042000219259
Major, K., 2016. Macroeconomic impact of Pannonia Ethanol in Hungary, Budapest: Héfta Research Institute.
Perez-Verdin G., Grebner D.L., Munn I.A., Sun, C. and Grado, S.C.
(2008): Economic impacts of woody biomass utilization for bioenergy in Missisippi. Forest Products Journal, 58 (11), 5-83.
Szabó, N. (2015): Methods for regionalizing input-output tables, MTA-PTE Innovation and Economic Growth Research Group, Pécs, Hungary.
Szabó, Z. (2019): Can biofuel policies reduce uncertainty and in- crease agricultural yields through stimulating investments?
Accepted for publication in Biofuels, Bioproducts & Biorefin- Thornley, P., Chong, K. and Bridgwater, K. (2014): European ing.
biorefineries: Implications for land, trade and employment.
Environmental Science & Policy, 37, 255-265. https://doi.
org/10.1016/j.envsci.2013.09.004
Urbanchuk, J.M. (2017): Contribution of Ethanol Industry to the Economy of the US in 2016. ABF Economics, Agriculture and Biofuels Consulting, LLP.
Wojan, T.R, Brown, J.P. and Lambert, D.M. (2014): What to Do about the “Cult of Statistical Significance”? A Renewable Fuel Application using the Neyman-Pearson Protocol, Ap- plied Economic Perspectives and Policy, 36(4), 674–695.
https://doi.org/10.1093/aepp/ppu013
Annex
Annex 1: NUTS Regions in Hungary.
HU110 HU120 HU211
HU212
HU213 HU221
HU222
HU223
HU231
HU232 HU233
HU311
HU312 HU313
HU321
HU322
HU323
HU331
HU332
HU333
MAGYARORSZÁG - NUTS level 3
0 45 km
Administrative boundaries: © EuroGeographics © UN-FAO © Turkstat Cartography: Eurostat — GISCO, 07/2018
MAGYARORSZÁG - NUTS level 3
The following division applies to Hungary:
- NUTS 0 region ‘Hungary’, HU - NUTS 1 region ‘Dunántúl’, HU2 - NUTS 2 region ‘Közép-Dunántúl’ HU21 - NUTS 3 region ‘Fejér’, HU211
- NUTS 2 region ‘Dél-Dunántúl’ HU23 - NUTS 3 region ‘Tolna’ HU233 - Dunaföldvár, Pannonia Ethanol National level
NUTS level 1 NUTS level 2 NUTS level 3 Legend
Source: Eurostat, 2013