Quarterly report on InflatIon
november 2010
Quarterly report on InflatIon
november 2010
Published by the Magyar Nemzeti Bank
Publisher in charge: dr. András Simon, Head of Communications 8–9 Szabadság tér, H-1850 Budapest
www.mnb.hu
ISSN 1418-8716 (online)
Act LVIII of 2001 on the Magyar Nemzeti Bank, which entered into effect on 13 July 2001, defines the primary objective of Hungary’s central bank as the achievement and maintenance of price stability. Low inflation allows the economy to function more effectively, contributes to better economic growth over time and helps to moderate cyclical fluctuations in output and employment.
In the inflation targeting system, since August 2005 the Bank has sought to attain price stability by ensuring an inflation rate near the 3% medium-term objective. The Monetary Council, the supreme decision-making body of the Magyar Nemzeti Bank, performs a comprehensive review of the expected development of inflation every three months, in order to establish the monetary conditions consistent with achieving the inflation target. The Council’s decision is the result of careful consideration of a wide range of factors, including an assessment of prospective economic developments, the inflation outlook, money and capital market trends and risks to stability.
In order to provide the public with clear insight into the operation of monetary policy and to enhance transparency, the Bank publishes the information available at the time of making its monetary policy decisions. The Report presents the inflation forecasts prepared by the Monetary Strategy and Economic Analysis and Financial Analysis Departments, as well as the macroeconomic developments underlying these forecasts. The Report is published biannually, with partial updates to the forecasts also prepared twice a year. The forecasts of the Monetary Strategy and Economic Analysis and Financial Analysis Departments are based on certain assumptions. Hence, in producing its forecasts, the Directorate assumes an unchanged monetary and fiscal policy. In respect of economic variables exogenous to monetary policy, the forecasting rules used in previous issues of the Report are applied.
The analyses in this Report were prepared by staff in the MNB’s Monetary Strategy and Economic Analysis and Financial Analysis Departments and Financial Stability Departments under the general direction of Ágnes Csermely, Director. The project was managed by barnabás virág, Senior economist of monetary Strategy and economic analysis, with the help of viktor várpalotai. the Report was approved for publication by Ferenc Karvalits, Deputy Governor.
Primary contributors to this Report include: Gergely Baksay, Péter Bauer, Mihály Hoffmann, András Hudecz, Gábor Kiss, Norber M. Kiss, Regina Kiss, Péter Koroknai, Mihály András Kovács, Balázs Krusper, Zsolt Lovas, Miklós Lukács, Ádám Martonosi, Benedek Nobilis, Gábor Pellényi, György Pulai, Zoltán Reppa, Olivér Miklós Rácz, István Schindler, Róbert Szemere, béla Szörfi, Judit várhegyi, timea várnai. other contributors to the analyses and forecasts in this Report include various staff members of the Monetary Strategy and Economic Analysis and the Financial Analysis Departments.
The Report incorporates valuable input from the Monetary Council’s comments and suggestions following its meetings on 15 november and 29 november 2010. the projections and policy considerations, however, reflect the views of staff in the Monetary Strategy and Economic Analysis and the Financial Analysis Departments and do not necessarily reflect those of the Monetary Council or the MNB.
The projections is based on information in the period to 22 November 2010.
Contents
Summary
71 evaluation of macro-economic data
131.1 Buoyant demand in Asia also affects Hungarian external demand through indirect channels 14 1.2 Signs suggesting a turnaround in domestic demand as well 16 1.3 Hungarian economy continues to have a net saving position 20
1.4 rising activity, strengthening employment 23
1.5 food price shock has reversed the trend of declining inflation 27
2 financial markets and lending
292.1 C oncerns over indebted countries have strengthened 29
2.2 the financial system can make only a limited contribution to the economic recovery through
private-sector lending 35
3 Inflation and real economy outlook
393.1 The structure of growth is expected to become more balanced 41 3.2 tax measures point to more moderate wage dynamics in a loose labour market 51 3.3 Inflation may persistently overshoot the target, due to strong supply shocks amid recovering
consumption 53
3.4 Effects of alternative scenarios on our forecast 57
3.5 A gradual decline is expected in external financing capacity 59 3.6 Government deficit targets are attainable through major temporary revenue measures 63
Boxes and Special topics in the report, 1998−2010
70appendix
77Summary
Under the assumptions that the central bank base rate and the average exchange rate remain constant at their october levels (5.25% and eur/Huf 274, respectively), Hungarian economic growth continues to accelerate on the forecast horizon. Rising domestic consumption and a couple of large- scale investment projects which have already been announced in the manufacturing sector are the main sources of growth, in addition to robust export growth. Improvements in employment and the Government’s measures to stimulate income growth will result in higher consumption, while the increasing unpredictability of the tax regime and the sustained weakness of bank lending will materially weaken firms’ investment activity.
Earnings growth is unlikely to pick up sharply, due to continued loose labour market conditions and consequently, little inflationary pressure is expected from the labour market. By contrast, sharp rises in unprocessed food prices will put upward pressure on an increasingly wide range of items in the consumer basket through increases in costs. With the upward effects on inflation of the Government’s measures emerging gradually from early 2011, the average inflation rate may be above 4% next year.
Inflation is expected to moderate as the first-round effects of cost-push shocks wear off. With domestic consumption likely to pick up, however, the downward effects on prices of the negative output gap are expected to fade gradually. Consequently, the pass-through effects of the supply shocks may result in inflation being above the 3% target on the monetary policy horizon.
Over the past few months, developments in global market sentiment were shaped primarily by market expectations about the second phase of quantitative easing measures by the US Federal Reserve, which led to dollar depreciation and rises in equity markets. Concerns about the fiscal outlook for some peripheral euro-area Member States intensified again towards the end of the period, which was reflected in rises in those countries’ yield spreads.
In addition to global investor sentiment, country-specific factors also affected developments in domestic financial asset prices. At the beginning of the period, the aborted negotiations with the IMF had an adverse impact on sentiment towards Hungary. But thereafter, as the Government expressed its commitment to meeting the deficit targets, Hungarian asset prices outperformed those of countries of Central and Eastern Europe. Announcement of the Government’s second action plan resulted in a relative deterioration of risk perception related to Hungary.
On aggregate, the forint strengthened somewhat over the period, similar to the Czech koruna and the Polish zloty.
rising domestic demand may lead to higher-than-targeted inflation over the entire forecast period
Global investor sentiment has been volatile; assessments of the risks associated with forint assets have been shaped mainly by
country-specific factors
MAGYAR NEMZETI BANK
the decline in lending to the private sector continued in 2010 Q3, although at a slower pace. Conditions on lending to the corporate sector remained tight, with little sign of a pick-up in the supply of credit. Credit demand is likely to increase mainly in industries selling their output to external markets, which, in turn, may result in a gradual pick-up in corporate lending from 2011.
Bank lending to the household sector fell further at about the same rate as in the previous quarters. The substantial reductions in personal income tax rates and improvements in the employment situation are expected to stimulate credit demand in the short term. However, banks are likely to respond to rising demand with some delay, due to a deterioration in credit quality and the effects of the sector-specific extra tax imposed on the sector. Consequently, outstanding lending to households is only expected to increase again from the middle of 2011.
The Hungarian economy continued to slowly recover from recession in Q3.
Growth continued to be led by industrial sales on the back of rising German export activity, but some sectors supplying the domestic market also showed signs of a turnaround in the past quarter. According to retail sales data, household consumption spending is expected to increase slightly in 2010 H2, driven mainly by rising employment and improvements in the sector’s income prospects. Investment spending by firms operating with low capacity utilisation is likely to remain very subdued, due to the tight credit conditions.
Firms are expected to undertake new investment projects only in manufacturing.
Employment began to rise at an increasing pace following the pick-up in economic activity. However, the increase in demand for labour was accounted for wholly by export industries. The participation rate continued to rise, in addition to the increase in employment growth. Consequently, there continue to be no signs of a turnaround in unemployment. The downward effect on earnings of the loose labour market is being increasingly felt and, therefore, pay increases in the private sector continue to be historically low.
Exports continue to grow at double-digit rates on the forecast horizon, led mainly by German export activity, which in turn is propelled by demand from Asia. That link may be gradually strengthened by the implementation and activation of large investment projects by the auto industry, which have already been announced. Domestic demand growth may pick up from 2011, with the expected growth path likely to become more balanced.
Faster growth in household consumption spending and the large investment projects discussed above may be the main factors contributing to the expansion of domestic demand. Household consumption spending is likely to increase, due to the substantial easing of the tax burden on individuals and the recovery in employment. For the present, the effect of changes to the private pension fund scheme on households are unpredictable, and thus a change in the sector’s consumption-saving behaviour is not expected in the baseline projection. At the same time, borrowing, mainly in foreign currency, by heavily indebted households prior to the financial crisis may continue to imply strong pressure to adjust balance sheets, and any extra income tight credit conditions are impeding
the economic recovery
In addition to strong export growth, rising employment may facilitate the economic recovery
Growth is likely to accelerate and become more balanced, despite the risks to investment
SUMMARY
resulting from the reduction in taxes may raise net savings rather than consumption.
The steady expansion of production capacities in the auto industry contributes to whole-economy investment growth over the entire forecast period, but the sector-specific extra taxes, which increase investor uncertainty, may prompt a number of firms to revise their investment plans.
This latter effect, coupled with tight conditions on corporate lending, may offset most of the positive impact on growth of the large individual investment projects.
in the projection, growth accelerates to above 4% in 2012. one source of this is the easing of the tax burden on household income, the other being the recovery in the goods balance, driven by new production capacities that will have been installed in the auto industry by that time.
In the weak demand environment, inflation fell steadily until September.
Although there has been no inflationary pressure from the labour market and domestic demand in recent months, annual consumer price inflation has remained constantly above the levels seen prior to last year’s indirect tax increases.
Although there has been little evidence of significant effects from the depreciation of the exchange rate during the summer months, rises in an increasingly wide range of unprocessed food prices have put significant upward pressure on inflation. The latter effect may push core inflation upwards again in the coming months. Households’ inflation expectations have stagnated at a level above the medium term 3% inflation target, consistent with the actual outturns for inflation in recent months.
The factors accounting for the revision to the inflation projection are mainly:
i) rising domestic demand, ii) the sector-specific extra taxes, iii) expected slow earnings growth, and iv) an exchange rate assumption fixed at a stronger level. In the projection, the pass-through of rises in unprocessed food prices, the passing on to customers of the cost of sector-specific extra taxes and the simultaneous increase in household consumption lead to a pick-up in inflation in the short term, which is partially offset by the subdued rate of earnings growth. inflation is expected to be above 4% in 2011.
At the end of next year, the effects of cost-push shocks of the past quarters gradually fade, and thus inflation is expected to moderate again. While domestic demand will pick up further, the downward pressure on prices of the narrowing output gap is likely to diminish, and will therefore not be able to offset the pass-though effects of the cost-push shocks. Consequently, annual inflation may remain slightly above the target even towards the end of the forecast period.
Rising external demand and the export growth led by activation of the auto industry investment projects counteract the gradual increase in domestic demand, and thus the substantial surplus on the real economic balance is expected to be sustained over the coming years. However, firms’ improving profitability point to an increase in the deficit of income balance. But that, in aggregate, is only likely to be reflected in a gradual decline in Hungary’s Inflation stuck at around 4%, despite
low domestic inflationary pressure
With demand picking up, inflation may remain constantly above target, even if earnings growth remains subdued
Hungary’s external financing capacity may remain positive over a sustained period
MAGYAR NEMZETI BANK
Changes in the external environment and country risk perceptions pose the greatest risks to growth
expenditure-side structural measures will be needed to maintain the deficit below target over the longer term
the effects of general government measures on the labour market may spur potential growth; however, risks stemming from the rise in the expected return on investments may threaten excess growth
external financing capacity − the country may maintain its net saving position over the entire forecast period, due to the continuous inflow of large EU transfers in the future.
In contrast to earlier practice, starting from this the issue of the Report the aggregate effects of alternative scenarios are not reflected in the skewness of the probability distribution in the fan chart, but rather the alternative scenarios are quantified separately, and the fan chart only gives a sense of the degree of forecast uncertainty around the baseline projection.
Expectations becoming stuck at levels above the medium-term target poses the biggest risk to the inflation outlook. There are signs of this beginning to happen in the results of surveys measuring the most recent inflation expectations. Inflation expectations being stuck at a high level increase the likelihood that the cost-push shocks reflected in the inflation path in the short term will lead to a sustained rise in the price index over the longer term. If the scenario materialises, it could raise the expected path of inflation by 1 percentage point.
The likely response of economic agents to the fiscal measures is the most important source of uncertainty regarding future economic growth. The stimulus to growth may be stronger in a favourable external and financial environment, and employment growth may be faster. However, if the external environment is less favourable and domestic growth slows in parallel with exports, the risk that uncertainty and the dampening effects on investment of rising financing costs will dominate. In such a scenario, growth may be slower in the short term by 1 percentage point than in the baseline projection.
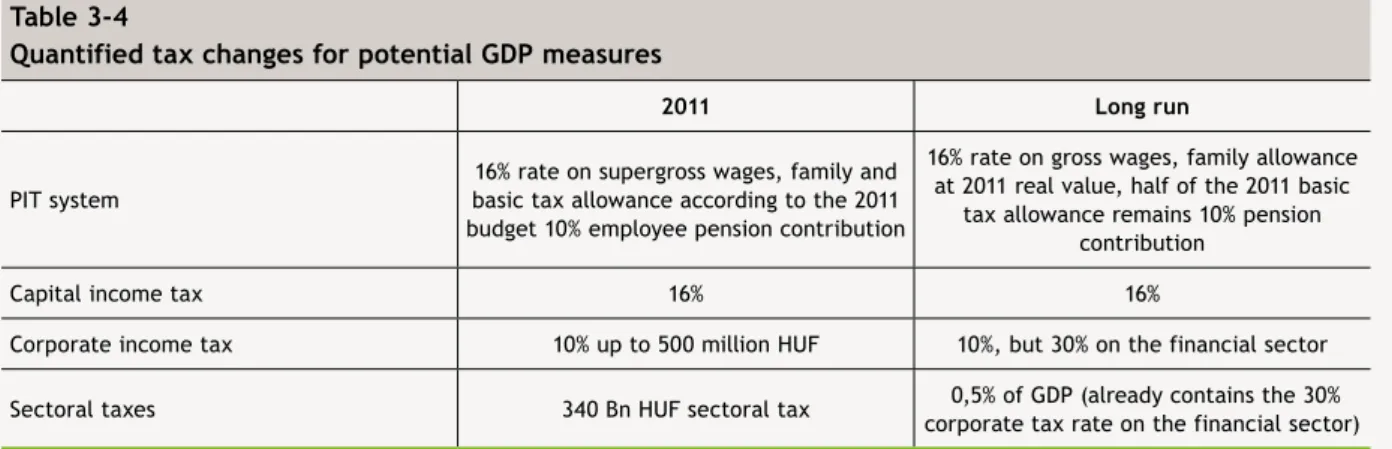
There are considerable differences in terms of the sources of revenue between the plans submitted by the Government to Parliament and actual budget policies implemented over the past decade. The laws as enacted contain a substantial reduction in taxes on labour, making up the resulting shortfall in revenue by imposing a temporary extra tax on certain sectors and by re-channelling a certain amount private pension fund contributions and some of the wealth accumulated in the funds to the budget.
The Government’s fiscal measures are likely to ensure that the deficit path will be lower than previously expected on the forecast horizon. The measures will help achieve the Government’s deficit targets over the coming years. Despite meeting the deficit targets on an ESA basis, however, the structural position of the government budget is likely to deteriorate and, consequently, the improvement in balance is unlikely to be sustained over the longer term in the absence of further measures.
In the long term, the labour market impacts of the personal income tax system reform may exert a positive effect on the potential growth of the Hungarian economy. Faster growth may primarily stem from the stimulating effect of tax cuts on labour intensity, while employment may only rise slightly under current circumstances. At the same time, measures implemented to ensure funding for the personal income tax reform may damage investor confidence in the long term, an effect likely to dissipate most of the excess growth on the labour market. Consequently, we do not anticipate any significant improvement in potential growth in our forecast.
SUMMARY
Inflation projection fan chart, uncertainty and the impact of alternative scenarios
−1 0 1 2 3 4 5 6 7 8 9
07 Q1 07 Q2 07 Q3 07 Q4 08 Q1 08 Q2 08 Q3 08 Q4 09 Q1 09 Q2 09 Q3 09 Q4 10 Q1 10 Q2 10 Q3 10 Q4 11 Q1 11 Q2 11 Q3 11 Q4 12 Q1 12 Q2 12 Q3 12 Q4 Per cent
−1 0 1 2 3 4 5 6 7 8
9 Per cent
Unanchored inflation expectations More rapid recovery of employment Unfavourable risk assessment Baseline
GDp projection fan chart, uncertainty and the impact of alternative scenarios
(annual changes, seasonally adjusted and reconciled data)
−8−7
−6−5
−4−3
−2−101234567
07 Q1 07 Q2 07 Q3 07 Q4 08 Q1 08 Q2 08 Q3 08 Q4 09 Q1 09 Q2 09 Q3 09 Q4 10 Q1 10 Q2 10 Q3 10 Q4 11 Q1 11 Q2 11 Q3 11 Q4 12 Q1 12 Q2 12 Q3 12 Q4 Per cent
−8−7
−6−5
−4−3
−2−101234567 Per cent
Unanchored inflation expectations More rapid recovery of employment Unfavourable risk assessment Baseline
MAGYAR NEMZETI BANK
Summary table of baseline scenario
(The forecasts are conditional: the baseline scenario represents the most probable scenario, which applies only if the assumptions presented in Chapter 3 materialise; unless otherwise indicated, it represents percentage changes on the previus year.)
2009 2010 2011 2012
fact projection
Inlation (annual average)
Core inflation1 4.1 3.1 3.5 2.9
Consumer price index 4.2 4.9 4.0 3.3
economic growth
External demand (GDP based) −4.2 2.1 1.9 2.0
Household consumption expenditure −7.6 −3.0 2.8 4.0
Gross fixed capital formation −6.5 −0.9 3.2 6.4
Domestic absorption −11.5 −1.5 2.5 3.5
Export −9.1 14.5 10.5 9.8
Import −15.4 12.5 10.7 9.7
GDP* −6.7 1.1 3.1 4.0
external balance2
Current account balance −0.5 1.3 0.3 0.1
External financing capacity 0.8 3.4 2.6 2.3
Government balance2
ESA balance −4.4 −3.8 −2.7 −3.1
labour market
Whole-economy gross average earnings3 0.6 2.0 2.2 5.7
Whole-economy employment4 −2.5 0.1 0.5 0.4
Private sector gross average earnings5 4.4 3.9 4.4 5.6
Private sector employment4 −3.8 −0.7 0.9 1.2
Unit labour costs in the private sector4,6 8.3 0.8 0.7 1.9
Household real income7 −5.8 −1.1 1.3 3.1
1 From May 2009 on, calculated according to the joint methodology of the CSO and MNB.
2 As a percentage of GDP. In our forecast we have not taken into consideration any risk from debt assumptions.
3 Calculated on a cash-flow basis.
4 According to the CSO LFS data.
5 According to the original CSO data for full-time employees.
6 Private sector unit labour cost calculated with a wage index excluding the effect of whitening and the changed seasonality of bonuses.
7 MNB estimate. In our current forecast we have corrected the data of household income with the effect of changes in net equity because of payments into mandatory private pension funds.
* Data are not adjusted for calendar effects.
turnaround in the labour market, inflation stuck at 4%
A strong increase in global trade continues to boost domestic exports and, through them, the continued sluggish growth of Hungary’s GDP. Although the output of sectors supplying domestic markets continues to decline, some sectors − typically those linked to household consumption
− are showing signs of a turnaround that seems to be emerging earlier than expected. In line with this, in addition to dynamic growth in exports, domestic demand is hindering economic recovery to a lesser and lesser degree, and thus the structure of growth may become more balanced from the second half of 2010.
Lagging behind the turnaround in the business cycle, employment figures have been rising over the past quarters.
For the time being, however, only export-related sectors are experiencing a recovery in the labour market. Along with higher employment, activity is also picking up.
Consequently, the higher labour demand has not yet caused the high unemployment rate to drop. It is becoming increasingly obvious that the persistently loose labour market conditions are resulting in consistently negative impact on wages; as a result, private sector wage growth hit all-time low in the Hungarian economy in the past few months.
The gradual decline in inflation, which started at the beginning of the year, came to an end in the autumn.
Although core inflation is at a historically low level, a significant rise in unprocessed food prices during the summer has been feeding through into the overall CPI.
1 evaluation of macro-economic data
There has been no significant change in the domestic demand of developed economies. Post-crisis unemployment is stuck at a high level, with Germany being the only exception, while the instruments of economic policies adopted during the crisis in order to jump-start the economy and the impacts of these instruments are running into increasingly significant obstacles (e.g. substantial budget deficits, rising sovereign debt, base rates close to zero). Correspondingly, despite the promising H1 data, which were also supported by a turnaround in the inventory cycle, global economic indicators for the third quarter already suggest slower global growth.
Despite the slowdown in developed economies, global trade and hence Hungary’s external demand have expanded dynamically. This trend is largely driven by exports to Asian
economies which are experiencing strong growth in domestic demand. Although the weight of Asian economies in Hungary’s exports is relatively small, these favourable growth impulses are being seen in Hungary’s external demand as well, indirectly via German exports.
Over the short run, we expect this trend to continue. Global business activity is only likely to recover slowly in the quarters to come, whilst the share of Germany’s exports in vigorous Asian demand is expected to grow further. This is supported by the fact that, despite the waning European recovery, the business activity indicators capturing the German industrial outlook recently remained at higher levels than before the crisis.
1.1 Buoyant demand in asia also affects
Hungarian external demand through indirect channels
Chart 1-1
Developments in German exports after the onset of the crisis
(by target countries)
−40
−20 0 20 40 60 80
EU (63.7%) USA (7.2%) Other developed (7.5%) Latin-America (2.2%) Other Asia (8.0%) Other (11.4%) EU (63.7%) USA (7.2%) Other developed (7.5%) Latin-America (2.2%) Other Asia (8.0%) Other (11.4%)
Change between September 2008 and May 2009
Change between May 2009 and July 2010 Per cent
Chart 1-2
Ifo expectations and the euroCoIn indicator*
−1.5
−1
−0.5 0 0.5 1 1.5
Apr. 99 Oct. 99 Apr. 00 Oct. 00 Apr. 01 Oct. 01 Apr. 02 Oct. 02 Apr. 03 Oct. 03 Apr. 04 Oct. 04 Apr. 05 Oct. 05 Apr. 06 Oct. 06 Apr. 07 Oct. 07 Apr. 08 Oct. 08 Apr. 09 Oct. 09 Apr. 10 Oct. 10 Point of standard deviation
−50
−40
−30
−20
−10 0 10 Balance 20
EuroCOIN indicator
IFO expectations (right-hand scale)
* The (New) EuroCOIN is a monthly indicator moving together with the trend (cleaned of short-run noise) of euro-area GDP growth. The indicator is computed by CEPR from monthly data with a dynamic factor model (http://eurocoin.cepr.org/).1
1 for more details on methodology, see: altissimo, f., r. Cristadoro, m. forni, m. lippi and G. veronese (2010): “new eurocoin: tracking economic Growth in Real Time”. Review of Economics and Statistics, 92 (4) (november), 1024−1034.
evaluation of maCro-eConomiC Data
after the freefall seen in 2008, commodity prices increased significantly last year and have been on the rise ever since, due in part to enormous demand for commodities in emerging economies and in part to current worries about inflation, which have emerged in response to planned and actual monetary easing in advanced economies. Rising prices have been typical for a wide range of commodities.
This year, unprocessed food experienced the most significant price increases, the extent of which is on par with the pre- crisis price explosion in 2007. even though there have been no major shifts in commodity prices in recent months, they may remain anchored at a high level in the quarters to come, due to Asian demand that is expected to remain strong over the short run and consistently loose monetary conditions in advanced economies. This may exert increasingly strong cost-side price pressure on an ever larger number of items in the CPI basket.
Chart 1-3
World food and metal price developments
(2000 = 100, in EUR)
100 120 140 160 180 200 220 240
Jan. 05 May 05 Sep. 05 Jan. 06 May 06 Sep. 06 Jan. 07 May 07 Sep. 07 Jan. 08 May 08 Sep. 08 Jan. 09 May 09 Sep. 09 Jan. 10 May 10 Sep. 10
80 90 100 110 120 130 2000 = 100140 2000 = 100
Metals
Food (right-hand scale)
Domestic growth continued to exhibit strong heterogeneity in the first half of 2010. in keeping with the upturn in German exports activity, Hungary’s export sales − supported mainly by strong supplier connections − grew dynamically, while at the same time there was a general slump in the performance of sectors supplying the domestic market.
Consequently, Hungarian GDP growth still falls behind the rates recorded by its regional competitors.
Available data from the third quarter suggests that Hungary’s export sector continues to benefit from the brisk growth in global trade. Concurrently, after a long time, signs suggesting a turnaround in output were also discernible in the case of a few sectors supplying the domestic market.
Industrial output also continued to grow dynamically in the third quarter. This production growth still can be attributed to developments in exports. Even though Hungary’s direct export sales to Asia have been above average in recent quarters, it is still mainly through German exports that Hungary is benefiting the most from strong Asian demand.
Based on indicators of business activity in Germany and the volume of new orders in Hungary, industrial export sales are likely to grow vigorously in the months to come, albeit at a rate somewhat below what was seen in the first half of the year. In the years ahead, the relationship between German and Hungarian exports is likely to strengthen further, as a result of upcoming major capital investments, mainly involving the automotive industry.
The output of the services sectors shows a large degree of heterogeneity. The output of service providers closely linked to export activity (e.g. transport and telecommunication) has been rising gradually since mid- 2009. by contrast, deteriorating portfolio quality, subdued lending, extra taxes and a lacklustre residential property market have been decreasing the value added of companies operating in the financial, real estate and other services sectors, all of which still posted growth last year.
In respect of sectors supplying the domestic market, the retail sector caused the biggest surprise. Following nearly four years of steady decline, sales increased mildly in recent months. It was primarily durable goods and fuel where the growth was significant. The former may be
1.2 Signs suggesting a turnaround in domestic demand as well
Chart 1-5
German and Hungarian new industrial orders and the Ifo expectations index
−50
−40
−30
−20
−10 0 10 20 30 40
Apr. 01 Sep. 01 Feb. 02 July 02 Dec. 02 May 03 Oct. 03 Mar. 04 Aug. 04 Jan. 05 June 05 Nov. 05 Apr. 06 Sep. 06 Feb. 07 July 07 Dec. 07 May 08 Oct. 08 Mar. 09 Aug. 09 Jan. 10 June 10 Annual change (per cent)
−50
−40
−30
−20
−10 0 10 20 30 Points of standard deviation 40
IFO expectations (right-hand scale) German industrial new orders
Hungarian industrial new export orders (3 month moving average)
Chart 1-4
Decomposition of GDp growth*
(annual rate of growth)
−16−14
−12−10−8−6−4−2101202468
01 Q1 01 Q3 02 Q1 02 Q3 03 Q1 03 Q3 04 Q1 04 Q3 05 Q1 05 Q3 06 Q1 06 Q3 07 Q1 07 Q3 08 Q1 08 Q3 09 Q1 09 Q3 10 Q1 10 Q3
Per cent Per cent
−16−14
−12−10−8−6−4−2101202468
Households' consumption Government consumption Gross fixed capital formation
Inventories and statistical discrepancies Net exports
GDP growth*
* We used the GDP data revised by Central Statistical Office during publication of preliminary Q3 data to illustrate the GDP growth, but we had only the unrevised data for the detailed breakdown.
evaluation of maCro-eConomiC Data
attributable to the improved income outlook, which is also reflected in higher confidence indicators, while the latter is primarily due to an agreement2 between the government and road transporters. Although this upturn in retail sales occurred somewhat earlier than expected, sales figures are expected to take off only if current household income rises at a notable rate, which is forecasted for early 2011.
The value added of sectors with a lower weight declined further. As a result of adverse weather conditions, poor crops affected an increasingly wide variety of products and consequently the value added of agriculture in 2010 will probably fall significantly behind the above-average output of the preceding two years.
Construction output fell further from an already low level in this year. The underlying reason for this is the ongoing downturn in the residential property market. The only new orders were projects financed from EU funds. Besides the bleak outlook on demand, increasingly difficult financing conditions also hit the output of the sector hard. The number of construction permits and occupancy permits also decreased further in the third quarter, and thus a turnaround is only expected to materialise in the second half of 2011.
Despite the discouraging data on the residential property market, the construction industry experienced some slight growth in the summer. The underlying reason was construction and renovation by municipalities. Nonetheless,
given the low number of new orders, production in this sector is still far off from achieving a lasting turnaround.
Shifts in the production of certain sectors are also clearly visible in changes in demand in the economy as a whole.
Slow GDP growth continues to be driven by an increase in both net exports and inventory changes. At the same time, a turnaround in the third quarter is likely to be experienced earlier than expected for some components of domestic demand. Thus, from the second half of the year, domestic business activity will hinder domestic recovery less severely.
Exports sales have been rising in recent months, approaching the pre-crisis level. Import demand linked to exports also boosted imports, while, due to weak internal demand, the foreign trade balance stabilised at a high level. A slow turnaround in household consumption and corporate capital investment − primarily related to parts supplies for the Mercedes plant in Kecskemét − may lead to the gradual diminishing of the export−import gap; however, the growth contribution of net exports may still remain positive in the second half of this year.
According to national accounts data, household consumption spending declined further until mid-2010, whilst Q3 data on retail turnover suggest minor, earlier- than-expected improvements in household demand.
Macro-economic indicators of household consumption Chart 1-6
annual change of value added in market services
(seasonally adjusted CSO data)
−12
−9
−6
−3 0 3 6 9 12
96 Q1 96 Q3 97 Q1 97 Q3 98 Q1 98 Q3 99 Q1 99 Q3 00 Q1 00 Q3 01 Q1 01 Q3 02 Q1 02 Q3 03 Q1 03 Q3 04 Q1 04 Q3 05 Q1 05 Q3 06 Q1 06 Q3 07 Q1 07 Q3 08 Q1 08 Q3 09 Q1 09 Q3 10 Q1 Annual change (per cent)
−12
−9
−6
−3 0 3 6 9 Annual change (per cent) 12
Market services Trade, tourism
Transport, storage and communications Financial, real estate and other services
Chart 1-7
Changes in the number of newly issued construction permits and occupancy permits
(annual change, seasonally adjusted data)
−60
−50
−40
−30
−20
−100 10 20 30 40 50 60 70
96 Q1 96 Q3 97 Q1 97 Q3 98 Q1 98 Q3 99 Q1 99 Q3 00 Q1 00 Q3 01 Q1 01 Q3 02 Q1 02 Q3 03 Q1 03 Q3 04 Q1 04 Q3 05 Q1 05 Q3 06 Q1 06 Q3 07 Q1 07 Q3 08 Q1 08 Q3 09 Q1 09 Q3 10 Q1 10 Q3 Per cent
Issued construction permits Builded dwellings
2 under the agreement effective 1 July 2010, road transporters are to refuel at national petrol stations, where fuel prices are typically higher than the regional average. in return, as of January 2011, they will be eligible for lower excise duties.
MAGYAR NEMZETI BANK
show a rather mixed, sometimes conflicting picture regarding the consumption options of households. In the second quarter, savings in the sector rose markedly; while at the same time household lending has been decreasing for the entire year. Depreciation of the forint early in the summer increased the repayment burden on households with FX debts, which − along with a slower rate of growth of wages − reduced their disposable income. From a demand standpoint, household confidence and employment indicators were the only indices showing a clearly positive shift over the past quarters. Thus, in our opinion, the favourable changes in retail data since the summer are attributable mainly to improvements in the labour market and its outlook.3
Investment activity in the national economy declined further in the first half of 2010. except for a few sectors implementing some major investment projects, the slowdown was widespread. Capital investment in the manufacturing industry picked up after falling for nine consecutive quarters, which was largely due to the ongoing construction of the Mercedes plant in Kecskemét. The decline in construction was stronger than earlier, the
underlying reasons for which are the shrinking real estate market and the postponement or cancellation of investment projects related to governmental investment, which is unusual in election years.
Although capacity utilisation levels for the manufacturing industry are in line with the historical average, due to banks’ continuing subdued loan activity, only the continuation of capital projects already in progress (Mercedes, Hankook) and those recently announced (Audi, Opel) will contribute to growth to a notable degree in the short run. In the quarters to come, investment activity in the service industry is likely to be restrained by prospects weaker than those of the manufacturing industry, as well as by tight credit conditions and significant extra taxes that have been imposed on certain sectors.
With external business activity picking up, the growth contribution of inventory changes was also positive during the second quarter. Statistics on inventories at current prices suggest that export-oriented sectors (i.e. the manufacturing industry) are in the process of replenishing their inventories, whereas inventories are being downsized in response to the subdued demand in the retail sector and poor crops in agriculture. Inventories are unlikely to rebound to their pre-crisis level in the near term, as uncertainty surrounding a pick-up in business activity and tighter credit conditions may prompt companies to manage Chart 1-8
Value of external trade value and the trade balance
(seasonally adjusted levels, million EUR)
3,000 3,500 4,000 4,500 5,000 5,500 6,000 6,500
Jan. 05 May 05 Sep. 05 Jan. 06 May 06 Sep. 06 Jan. 07 May 07 Sep. 07 Jan. 08 May 08 Sep. 08 Jan. 09 May 09 Sep. 09 Jan. 10 May 10 Sep. 10
Million EUR Million EUR
−800
−600
−400
−200 0 200 400 600
Balance (right-hand scale) Export of goods
Import of goods
Note: Exports of goods have been adjusted for shifts between certain months, unavailable items and the activity of VAT residents. Imports of goods have been adjusted for purchases brought forward around Hungary’s accession to the EU, the impacts of public warehousing in 2004, the effects of the purchases of Gripen fighter jets and Combino trams, as well as the activity of VAT residents.
Chart 1-9
Changes in retail sales and the consumer confidence index
(seasonally adjusted, annualised monthly index, MNB’s seasonal adjustment)
−20
−15
−10
−5 0 5 10 15 20 25
Jan. 95 Jan. 96 Jan. 97 Jan. 98 Jan. 99 Jan. 00 Jan. 01 Jan. 02 Jan. 03 Jan. 04 Jan. 05 Jan. 06 Jan. 07 Jan. 08 Jan. 09 Jan. 10
Per cent (annualized monthly change)
−80
−70
−60
−50
−40
−30
−20
−10 0 Balance 10
Retail sales (moving average)
GKI consumer confidence index (right-hand scale)
3 However, it is important to note that retail statistics may have been distorted by individual items unrelated to household consumption in a statistical sense. Such items are e.g. a rise in the fuel consumption of road transporters and purchases of new vehicles by the police. If these impacts are excluded, the change in household consumption is probably less pronounced that what is reflected in retail data.
evaluation of maCro-eConomiC Data
their inventories more efficiently. Accordingly, the growth contribution of inventory changes during the recovery may fall short of the growth loss resulting from inventory changes during the crisis.
In accordance with the sector’s production-side output, the growth contribution of government consumption was mildly positive; the underlying reason for this was a rise in the numbers of employed in the ‘Pathway to Work Programme’.
Chart 1-10
Capacity utilisation in manufacturing
−15
−10
−5 0 5 10 15
95 Q1 95 Q3 96 Q1 96 Q3 97 Q1 97 Q3 98 Q1 98 Q3 99 Q1 99 Q3 00 Q1 00 Q3 01 Q1 01 Q3 02 Q1 02 Q3 03 Q1 03 Q3 04 Q1 04 Q3 05 Q1 05 Q3 06 Q1 06 Q3 07 Q1 07 Q3 08 Q1 08 Q3 09 Q1 09 Q3 10 Q1 10 Q3 Percentage of trend
−15
−10
−5 0 5 10 Deviation from mean 15
Estimated capacity utilization indicators
GVI (Chamber of Industry) indicator (right-hand scale) Kopint-Tárki indicator (right-hand scale)
GKI (ESI) indicator (right-hand scale)
Chart 1-11
Changes in inventory based on current prices and GDp; inventory to nominal GDp ratio
−300
−200
−100 0 100 200 300 400 500 600
04 Q1 04 Q2 04 Q3 04 Q4 05 Q1 05 Q2 05 Q3 05 Q4 06 Q1 06 Q2 06 Q3 06 Q4 07 Q1 07 Q2 07 Q3 07 Q4 08 Q1 08 Q2 08 Q3 08 Q4 09 Q1 09 Q2 09 Q3 09 Q4 10 Q1 10 Q2 Quarterly change (billion HUF)
6 7 8 9 10 11 12 13 14 15 Ratio (percentage) 16
Inventories produced (whole economy) Purchased inventories (manufacturing) Purchased inventories (other industries) Purchased inventories (trade)
Inventories according to GDP
Inventories/GDP 4 quarter moving average (right-hand scale)
Although Hungary’s external financing capacity weakened somewhat in the second quarter of 2010, it remains significant, amounting to 2% of GDp (Chart 1-12). a slightly lower net saving position is mainly attributable to a consistent rise in the deficit of the income account. The real economic surplus and an inflow of EU transfers continued to make a substantial contribution to Hungary’s capacity for external financing.
The surplus of the seasonally adjusted real economic balance slightly exceeded that of the previous quarter, amounting to 7% of GDp. the surplus of the transfer balance was still high in the second quarter, the underlying reason for which was a stronger inflow of EU funds.
the income balance deficit has been rising since end-2009, which is linked to a rise in the estimated profits of foreign- owned companies.4 in 2009, dividends which are generally approved in the first half of the year dropped markedly, by close to 15% on a year earlier. Data for 2010, however, suggest that the dividends approved will not decline any more. Debt-related net interest expenses did not change materially in the second quarter of 2010.
A consistently high external financing capacity was the outcome of the fact that the increase in the general government’s financing needs was counterbalanced by a corresponding rise in the private sector’s net savings.
Contributors to a higher budget deficit were rising expenses (e.g. hospitals, one-off support for the Hungarian State Railways and the supplementation of the income of public sector employees) and lower income (reduction in social taxes and contributions, the widening of personal income tax brackets, lower vat income due to lower consumption).
At the same time, however, the majority of these factors
− along with stronger use of EU transfers − increased private sector income and thus indirectly the financial savings of corporations and households.
The rise in the financing capacity of the household sector in particular was sizeable in Q2, which is difficult to explain on the basis of the information available to us on developments in household income and consumption. As we only have few data on some forms of savings (FX-denominated cash, savings deposited abroad), it is probable that another contributor to the significant increase in financial assets was the fact that part of the savings held abroad was brought home due to the uncertainty caused by the crisis. in 2010 Q2, further major contributors to the increase in net savings were a marked drop in loans from financial institutions, due to a change in the regulatory environment and the strong depreciation of the forint.
1.3 Hungarian economy continues to have a net saving position
Chart 1-12
Components of external financing capacity
(seasonally adjusted, as a proportion of GDP)
04 Q1 04 Q2 04 Q3 04 Q4 05 Q1 05 Q2 05 Q3 05 Q4 06 Q1 06 Q2 06 Q3 06 Q4 07 Q1 07 Q2 07 Q3 07 Q4 08 Q1 08 Q2 08 Q3 08 Q4 09 Q1 09 Q2 09 Q3 09 Q4 10 Q1 10 Q2 Per cent
−10−8−6−4−21002468
−10−8−6−4−21002468 Per cent
Balance of goods and services*
Income balance Transfer balance
External financing capacity*
* Adjusted by the difference caused by imports brought forward on account of EU accession and by the import increasing impact generated by customs warehouses terminated due to the EU accession and by the Gripen fighter aircraft purchases.
Note: Seasonal adjustment of the time series was made with direct adjustment. Therefore, the sum of the components of the external financing capacity does not necessarily equal the adjusted values of the external financing capacity.
4 Data on income flows related to direct capital investments in the Balance of Payments Statistics are based on estimates. The estimate will be replaced by data based on corporate reports next September.
evaluation of maCro-eConomiC Data
Developments in financing
in 2010 Q2, net direct capital outflows continued, which was also mainly due to seasonal impacts, in connection with dividends disbursed in the second quarter. The outflow of non-debt-type funds was further driven by the fact that non-residents reduced their investments in equity portfolios in Hungary. By contrast, there were further inflows of new FDI and intercompany loans.5
In addition to significant net lending and the withdrawal of direct capital, the outflow of debt-type funds was sizeable in the second quarter. Related predominantly to the general government, the reduction in net debt was the outcome of an increase in foreign currency reserves due to EU transfers. In addition, the external debt of the banking sector also declined slightly in the second quarter.
Despite the outflow of debt-type funds, the net external debt rate rose further in response to a weaker HUF exchange rate, amounting to nearly 58% of GDp. although there was some moderation in euro-denominated debt, due
to exchange rate changes, practically all debt indicators increased further, with gross external debt and net external liabilities approximating 120% of GDp and 115% of GDp, respectively.
5 The main underlying reason for this development is the management of losses, i.e. the replenishing of retained earnings, rather than new investments.
Chart 1-13
forms of financing as a percentage of GDp
−15
−10
−5 0 5 10 15 20
04 Q1 04 Q2 04 Q3 04 Q4 05 Q1 05 Q2 05 Q3 05 Q4 06 Q1 06 Q2 06 Q3 06 Q4 07 Q1 07 Q2 07 Q3 07 Q4 08 Q1 08 Q2 08 Q3 08 Q4 09 Q1 09 Q2 09 Q3 09 Q4 10 Q1 10 Q2 Per cent
−15
−10
−5 0 5 10 15 Per cent 20
Transactions related to financial derivatives Non debt generating financing
Debt generating financing
External financing requirement (from "below")
Note: Financing requirement is calculated by the “bottom-up” approach and is equal to the sum of the external financing requirement and the error and omission item of the balance of payments statistics.
In keeping with earlier practice, on the basis of the corporate reports received and as a result of some methodological developments there were major revisions in the balance of payments statistics published at the end of September. The most significant change in the current account balance was brought about by the new method of the estimation of transportation costs (adjustments for the CIF-FOB parity). As a result, the value of goods imports recognised in the balance of payments and in the GDP rose by EUR 300-500 million, with a resultant corresponding decrease in the real economic balance. Overall, as a result of the revisions, since 2004 the external financing requirement and the deficit of the current account rose by an annual 0.3% to 0.7% of GDP. However, the changes did not affect the main trends in the external financing requirement. There was no similarly consistent change in the external financing requirement calculated with the bottom-up method. The fact that, as a result of the revisions, the size of ‘Net errors and omissions’ has become lower in respect of recent years suggests more consistent data.
The revisions affected the structure of financing and portfolio statistics to a greater extent. The main reason for this change is
that based on corporate reports (available since 2008) inferences can be made to commercial loans. Accordingly, MNB provided new estimates for commercial loan receivables and debts regarding the 2004-2007 period. overall, gross debt excluding intercompany loans grew by 5% to 7% of GDp between 2004 and 2007; by contrast, data for 2008 and 2009 suggest a mild, 0.5 percentage point rise on average relative to earlier data. Net external debt rose by approximately 3% of GDp between 2004 and 2007;
however, in 2008 and 2009 it decreased by close to 0.6 percentage points relative to preliminary data.
The announcement of a multinational company operating in Hungary in its annual report that it had transformed its financing structure led to significant revision. In connection with the structural changes, the foreign owner appreciated the value of the company, as a result of which FDI stock increased.
Subsequently, a significant part of equity-type liability was replaced by intercompany loans. As a consequence, the structure of the inflow of fDi changed significantly: in 2009 Q4 equity-type liabilities fell markedly by EUR 4.4 billion, while intercompany loans rose by HUF 4.7 billion compared to data disclosed earlier.
Box 1-1
Impact of the revisions in the balance of payments
MAGYAR NEMZETI BANK
Recognition of the above transaction altered the overall picture regarding financing trends since the onset of the crisis: while there were heavy withdrawals of funds within the company group
since the outbreak of the crisis, on the whole, intercompany loans are increasing markedly and outflows of non-debt generating liabilities affect ‘traditional’ FDI.
Lagging somewhat behind the turnaround in the business cycle, there was also a reversal in private sector employment. In conjunction with rising labour demand, and due, predominantly, to government measures tightening the rules of retirement, activity has also been picking up since the end of last year, and thus, for the time being, higher employment has only resulted in unemployment stabilising at a high level.
In the private sector, the number of employed rose in both the manufacturing industry and the market services sector.
For the time being, however, the pick-up in labour demand is due, almost entirely, to the improved output of exporting companies, while the sectors supplying the domestic market continue labour-hoarding. An indication of this is that, in the case of service providing industries, net rise in the numbers employed in the first half of the year was due, nearly entirely, to the activity of temporary staffing
companies;6 excluding their activity, the numbers employed in the market services have not changed substantially, which coincides with information provided by labour surveys. This means that rise in the numbers employed in the services sectors is clearly attributable to manufacturing industries. Public sector headcount has been broadly flat in recent months, consistent with our understanding that public sector employment is likely to have reached a peak level early in the summer.
The reversal in the business cycle and in the labour market has been corroborated by other employment indicators from the manufacturing industry. In conjunction with higher output, the proportion of part-time employees and the hours worked have reached or even exceeded the pre-crisis level over the past months. Accordingly, only the employment of new labour will be able to satisfy a further rise in labour
1.4 rising activity, strengthening employment
Chart 1-14
employment and unemployment in the national economy
(seasonally adjusted monthly data)
220240 260280 300320 340360 380400 420440 460480 500
Jan. 02 Apr. 02 July 02 Oct. 02 Jan. 03 Apr. 03 July 03 Oct. 03 Jan. 04 Apr. 04 July 04 Oct. 04 Jan. 05 Apr. 05 July 05 Oct. 05 Jan. 06 Apr. 06 July 06 Oct. 06 Jan. 07 Apr. 07 July 07 Oct. 07 Jan. 08 Apr. 08 July 08 Oct. 08 Jan. 09 Apr. 09 July 09 Oct. 09 Jan. 10 Apr. 10 July 10
3,700 3,750 3,800 3,850 3,900 3,950 4,000 4,050 4,100 4,150 4,200 4,250 4,300 4,350
4,400Thousand persons Thousand persons
Unemployed (right-hand scale) Employed
Labour force
6 Temporary staffing companies, which − statistically − form part of the services sector and which pay the labour they hire, have outsourced a large number of mainly low-wage blue collars in recent months.
Chart 1-15
Developments in employment in the market services sector
(seasonally adjusted monthly data December 2009 = 0)
−15.0
−10.0
−5.0 0.0 5.0 10.0 15.0 20.0 25.0
Jan. 10 Feb. 10 Mar. 10 Apr. 10 May 10 June 10 July 10 Aug. 10 Sep. 10
Thousand persons
Wholesale and retail trade Transportation and storage Accomodation and food services
Information and communication Financial and insurance activities
Real estate
Professional, scientific and technical activities
Administrative and support service Market Services
MAGYAR NEMZETI BANK
demand. In the short run, export-oriented sectors are likely to continue to drive employment in the private sector, while, in the case of market services, due to the sizeable labour-hoarding, a pick-up in demand may, initially, materialise without any change in the numbers employed.
Loose labour market conditions are curbing wage growth.
Consistent with this, the wage index of the private sector slowed further in the third quarter and, falling well behind
our expectations, flattened out at a historically low level of 3.5%. the impact of a different business cycle is still reflected in wages. Wages in the manufacturing industry, where profitability has grown faster, exceeded those in the market services sectors.
Chart 1-16
number of working hours and part-time workers in the manufacturing sector
141 143 145 147 149 151 153 155
Jan. 03 June 03 Nov. 03 Apr. 04 Sep. 04 Feb. 05 July 05 Dec. 05 May 06 Oct. 06 Mar. 07 Aug. 07 Jan. 08 June 08 Nov. 08 Apr. 09 Sep. 09 Feb. 10 July 10
Per capita/per hours/per week
25,000 30,000 35,000 40,000 45,000 50,000 55,000 60,000 65,000 Persons
Working hours of full time workers Part time workers (right-hand scale)
moving average
Chart 1-17
average gross earnings in the private sector
(annual index, seasonally adjusted data)
−2 0 2 4 6 8 10 12 14
Jan. 04 Apr. 04 July 04 Oct. 04 Jan. 05 Apr. 05 July 05 Oct. 05 Jan. 06 Apr. 06 July 06 Oct. 06 Jan. 07 Apr. 07 July 07 Oct. 07 Jan. 08 Apr. 08 July 08 Oct. 08 Jan. 09 Apr. 09 July 09 Oct. 09 Jan. 10 Apr. 10 July 10 Per cent (annual change) Per cent (annual change)
−2 0 2 4 6 8 10 12 14
Private sector Manufacturing Market services
Data pertaining to the gross average private sector income is one of the macroeconomic indicators with the highest variability both over time and cross-sectionally. One of the reasons behind this is that the private sector is composed of heterogeneous sectors, which each establish regular wages, pay out premiums and change the size and composition of their labour force at different times. Seasonal adjustment would in theory smooth out some of this volatility, but seasonality is not entirely stable due to the abovementioned behaviour. Besides, seasonally adjusted data may be substantially revised in light of new information received.
The volatile wage index, the outliers observed in certain months and the revisions thereof render the estimation of not only short- term wage developments difficult, but also that of the underlying developments of the month under review and of the extent of inflationary pressure exerted by wages. To tackle this problem, we wish to glean valuable information from the cross-sectional data of sectoral wages and use it to manage outliers. The
alternative wage inflation indicators thus can better reflect underlying developments.7
The cross-sectional volatility is illustrated by the following histogram showing the wage indicators of 79 sectors for September 2010 (wage index adjusted for changes in labour force composition). While the seasonally adjusted annual wage index was 4.1% and traditional wage inflation was 4%, it is apparent that the change in wages in half of the sectors represented was between −1.0% and 2.0%. as a result, both the unweighted median and the median weighted by employment were lower than wage inflation. Wage inflation exceeding 10% in 12 sectors pulled the average upwards.
We calculated alternative indicators using seasonally adjusted gross average wages from 79 sectors. As seasonally adjusted month-on- month indices remain highly volatile, we used year-on-year indices.
Box 1-2:
alternative indicators for measuring wage inflation
7 We use the method presented to measure short term inflationary pressure on prices, presented in greater detail in box 1-2 of the november 2009 Report on Inflation and the study soon to be published.