QUARTERLY REPORT ON INFLATION
November 2009
Published by the Magyar Nemzeti Bank Publisher in charge: Judit Iglódi-Csató
1850 Budapest, 8–9 Szabadság tér www.mnb.hu
ISSN 1585-0161 (print) ISSN 1418-8716 (online)
Act LVIII of 2001 on the Magyar Nemzeti Bank, which entered into effect on 13 July 2001, defines the primary objective of Hungary’s central bank as the achievement and maintenance of price stability. Low inflation allows the economy to function more effectively, contributes to better economic growth over time and helps to moderate cyclical fluctuations in output and employment.
In the inflation targeting system, since August 2005 the Bank has sought to attain price stability by ensuring an inflation rate near the 3% medium-term objective. The Monetary Council, the supreme decision-making body of the Magyar Nemzeti Bank, performs a comprehensive review of the expected development of inflation every three months, in order to establish the monetary conditions consistent with achieving the inflation target. The Council’s decision is the result of careful consideration of a wide range of factors, including an assessment of prospective economic developments, the inflation outlook, money and capital market trends and risks to stability.
In order to provide the public with clear insight into the operation of monetary policy and to enhance transparency, the Bank publishes the information available at the time of making its monetary policy decisions. The Report presents the inflation forecasts prepared by the Monetary Strategy and Economic Analysis and Financial Analysis Departments, as well as the macroeconomic developments underlying these forecasts. The forecasts are based on certain assumptions. Hence, in producing its forecasts, the staff assumes an unchanged monetary and fiscal policy. In respect of economic variables exogenous to monetary policy, the forecasting rules used in previous issues of the Report are applied.
The analyses in this Report were prepared by staff in the MNB’s Monetary Strategy and Economic Analysis and Financial Analysis Departments under the general direction of Ágnes Csermely, Director. The project was managed by Barnabás Virág,Senior Economist of Monetary Strategy and Economic Analysis, with the help of Mihály Hoffman and Péter Bauer. The Report was approved for publication by Ferenc Karvalits, Deputy Governor.
Primary contributors to this Report include: Tamás Balás, Gergely Baksay, Péter Bauer, Katalin Bodnár, Mihály Hoffmann, András Hudecz, Éva Kaponya, Norbert Kiss M, Rita Lénárt-Odorán, Zsolt Lovas, Miklós Lukács, Ádám Martonosi, Benedek Nobilis, Gábor Pellényi, Olivér Miklós Rácz, Zoltán Reppa, István Schindler, Róbert Szemere, Béla Szörfi, Judit Várhegyi, Tímea Várnai.
Other contributors to the analyses and forecasts in this Report include various staff members of the Monetary Strategy and Economic Analysis and the Financial Analysis Departments.
The Report incorporates valuable input from the Monetary Council’s comments and suggestions following its meetings on 2nd November and 23rd November 2009. The projections and policy considerations, however, reflect the views of staff in the Monetary Strategy and Economic Analysis and the Financial Analysis Departments and do not necessarily reflect those of the Monetary Council or the MNB.
1. EVALUATION OF MACRO-ECONOMIC DATA ...10
1.1 DOMESTIC ECONOMIC ENVIRONMENT: INCREASINGLY STRONG DECLINE IN DOMESTIC DEMAND 15 1.2 INCREASINGLY STRONG WAGE ADJUSTMENTS IN THE SERVICE SECTOR...21
1.3 WEAK DEMAND DEPRESSING PRICES TO AN INCREASINGLY LARGE EXTENT...24
2. FINANCIAL MARKETS AND LENDING...29
2.1 GLOBAL INVESTOR SENTIMENT HAS REMAINED FAVOURABLE...29
2.2 EMERGING MARKETS HAVE FOLLOWED THE PATH OF GLOBAL SENTIMENT, THOUGH FISCAL IMBALANCES POSE A RISK IN A NUMBER OF REGIONAL COUNTRIES...32
2.3 DOMESTIC MARKETS WERE CHARACTERIZED MAINLY BY FAVOURABLE DEVELOPMENTS...33
2.4 DEVELOPMENTS IN MONETARY CONDITIONS WERE MIXED...36
2.5 ECONOMIC ADJUSTMENT CONTINUES TO PLAY A DOMINANT ROLE IN THE LENDING ACTIVITY OF THE DOMESTIC BANKING SYSTEM...37
3. INFLATION AND REAL ECONOMY OUTLOOK ...41
3.1 IMPROVING EXTERNAL DEMAND OUTLOOK...42
3.2 STRONG LABOUR MARKET CHANNEL – LOWER WAGE RECOMMENDATIONS COULD REDUCE THE EXPECTED DECLINE IN EMPLOYMENT...47
3.3 CONSISTENTLY BELOW-TARGET INFLATION BEYOND THE ONE-YEAR HORIZON...53
3.4 INFLATION AND GROWTH RISKS...55
3.5 INCREASING TENSIONS IN THE EXPENDITURE SIDE MAY JEOPARDIZE THE ATTAINABILITY OF THE 2010 FISCAL DEFICIT TARGET...59
3.6 ACCORDING TO OUR BASELINE SCENARIO THE HUGE IMPROVEMENT IN EXTERNAL FINANCING POSITION OF HUNGARY WILL BE PERMANENT...68
Summary Restrained domestic demand generates an increasingly
pronounced
disinflationary effect
As a result of the global recession, economic output has declined sharply in Hungary. Although domestic export sales have started to pick up in recent quarters in line with the stabilising international environment, the marked downturn in domestic demand continues to be manifested in falling GDP. This duality in growth structure is expected to remain pronounced in the quarters ahead as well, inhibiting the Hungarian economy’s recovery from the recession.
Consistent with our forecast published in August, we do not expect a rebound in economic growth until mid-2010.
Subdued domestic demand has accelerated the nominal adjustment of the economy. The price-reducing effect associated with the general trend of shrinking sales opportunities is increasingly strong.
Accordingly, following the indirect tax raises in July the ensuing increases in price levels were weaker than expected, and a strong disinflationary trend was observed even amongst market services, which have a history of persistently rising price levels. Increasingly subdued pricing decisions have been accompanied by deceleration in nominal wages as well. This process is also expected to remain characteristic in the coming years, contributing to the development of a sustained, low inflation path.
Exerting an unfavourable effect in terms of growth, developments in domestic demand significantly reduced the external financing requirement of the Hungarian economy, and thereby its vulnerability.
This more sustainable external equilibrium position may remain evident even when growth dynamics accelerate.
Investor sentiment and domestic processes have contributed to
improvement in perceptions of the risk associated with the Hungarian economy
The steady improvement in global investor sentiment has also had a favourable impact on perceptions of risk associated with the Hungarian economy. All measures of risk have continued to fall, and at the same time the exchange rate has remained at the appreciated level seen in the first half of the year. Domestic developments have also facilitated improvement in risk sentiment. The real economic adjustment has led to a sharp decline in the external financing requirement, and measures to attain fiscal sustainability have contributed to an improving assessment of the path of government debt, as confirmed by international comparisons.
Remanence of tight credit conditions may decelerate further the lending activity of corporate sector
Subdued lending activity, coupled with growth in deposits has led to a gradual decline in the loan-to-deposit ratio. While lending conditions tightened further for the corporate sector in recent months, similar development was not perceivable in case of households. Besides the supply conditions the effect of restrained demand continues to point to subdued lending activity. Declining domestic interest rate levels have made forint-denominated loans increasingly competitive, which may have an impact on new loan contracts.
Losses due to deterioration in loan portfolio quality caused by the adverse economic environment may rise gradually till the second half of 2010. Future developments in the capitalisation of European banks may pose a risk to the current projection. Write-downs on
loans in Europe may even speed up the adjustment by domestic banks currently operating with high leverage through their relationships with their parent banks. Such events may pose further downside risks to Hungarian growth.
The sharp fall in domestic demand was also reflected by rapid improvement in the external balance
The sweeping changes in the real economy have resulted in a substantial reduction in Hungary’s external financing requirement, which is a source of its vulnerability. The sharp fall in the country’s import demand, in addition to stabilisation in export volumes, has led to an improvement in external balance. Looking at the position of the main domestic sectors, it is worth highlighting that households’ consumption and saving behaviour has changed, which over the entire forecast period is expected to allow for a healthier balance between foreign and domestic financing than in the past, owing to increased reliance on domestic funding sources.
Global economic policy stabilisation proved successful, but growth remains very fragile
Following the outbreak of the crisis, the economic stimulus packages introduced by developed-country governments have succeeded in stabilising the global economy over the short term. Growth data for the second and third quarters suggest that an economic recovery may start. The positive short-term news, in addition to improvement in confidence indices, has also had a benign effect on the major international institutions’ macroeconomic forecasts. Consequently, the global economic environment is likely to provide a more favourable background for the Hungarian economy than anticipated at the time of the previous Report.
There is, however, uncertainty about the sustainability of this process. In particular, there are risks related to the sustainability of government debt, labour market developments, the position of the banking sector and rises in commodity prices. If these risks materialise, they would once more result in a more unfavourable international economic environment.
Despite more favourable external conditions, domestic growth developments are dominated by the downturn in domestic demand
The improvement in the foreign economic environment has also stimulated Hungarian exports, while declining domestic demand has continued to be a drag on the economy. As regards the main components of domestic demand, the dominant factors have been the fall in household consumption, postponements of planned investment in the corporate sector and the rapid rundown of stocks.
Although households’ consumption decisions were also affected positively by timing considerations even during the months preceding the indirect tax increase, demand may return to a downward trend in the second half of the year. Destocking by companies was faster and stronger than previously. This may have been caused by short-term financing problems, in addition to worsening prospects for economic activity.
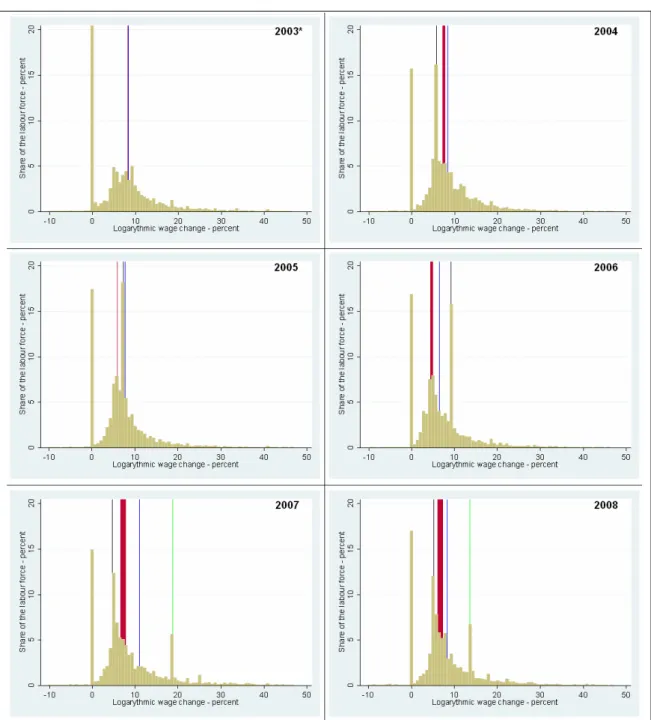
Wage adjustment in the services sector has intensified
With demand remaining slack, firms have continued their efforts to stabilise operations by reducing labour costs. As a result of this process, the rate of earnings growth in the private sector has fallen well below levels observed in previous years. There has been particularly marked wage adjustment in market services, which had exhibited persistently strong earnings growth in the past. In
manufacturing, earnings growth has continued to rise further from very subdued levels as exports have continued to pick up.
The number of whole-economy employees has remained stable in recent months. Rising employment in the government sector, owing to the ‘Pathway to Work’ programme, has been offsetting the continued, albeit slowing decline in private sector employment.
Compared with the past, a higher percentage of those losing their jobs manage to remain active in the labour market, which continues to create loose conditions in the labour market.
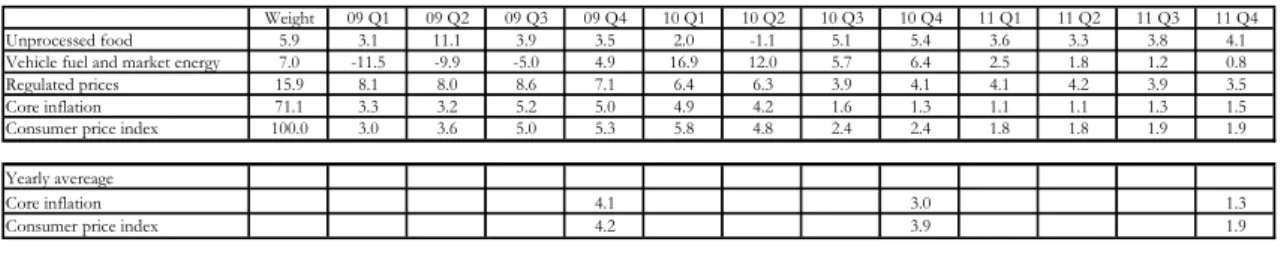
The recessionary environment has put increasing downward pressure on prices
Inflation data in recent months have been lower than the Bank expected, due in nearly equal parts to falling unprocessed food prices and better-than-expected core inflation developments. The latter suggests that the recessionary economic environment has recently exerted increasing downward pressure on prices, as suggested by the smaller-than-anticipated upward pressure on prices from the increase in indirect taxes compared with previous experience. Services price inflation has slowed steadily in recent quarters from the persistently high levels in previous years. That may be closely related to similar movements in earnings growth in the sector.
The downturn in the domestic economy is expected to be prolonged; inflation may fall below the medium-term target
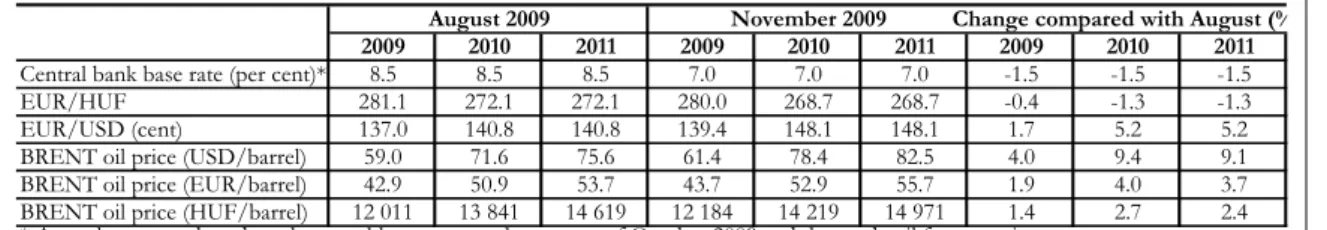
The projection in the November Report is based on the key assumptions that (i) the central bank base rate is held constant at 7.00%; (ii) the forint exchange rate remains at EUR/HUF 268.7; and (iii) the price of crude oil moves around EUR 80 per barrel. Provided that these assumptions hold, the Hungarian economy is likely to remain in recession for a protracted period. Although the benign global environment is likely to have a positive impact on domestic growth prospects for 2010, the projection assumes that the negative effects of the necessarily pro-cyclical fiscal and monetary policies and the private sector’s continued adjustment may be dominant. The Hungarian economy is only expected to recover strongly from the middle of 2010, lagging behind the developed European countries and the economies of Central and Eastern Europe.
As the upward pressure on the CPI index from the indirect tax increase unwinds, consumer price inflation may fall below the medium-term target from the middle of 2010 and is expected to be around 2 per cent in 2011. In the current projection, the inflationary effects of rises in oil prices are offset by lower expected core inflation. The persistently low inflation environment is likely to be supported by subdued domestic demand and labour market adjustment. Assessing the risks to inflation, the danger that inflation expectations may rise significantly due to the indirect tax increases has diminished in recent months.
Households' consumption and saving decisions indicate an increasingly precautionary motives
The crisis occurred during a period of rapid build-up in debt by Hungarian households, especially foreign currency debt. The worsening labour market outlook and falling lending activity have forced households to restructure their balance sheets, which has led to an increase in the sector’s net saving. Initially, net saving was
boosted by a sharp decline in lending, but in the second half of 2009 the accumulation of financial assets by the sector may pick up, reflecting the increased presence of precautionary motives. On the forecast horizon, households’ financial position continues to improve slightly.
Stabilisation in corporate profitability points to a modest increase in wage expenditures and restrained investment activity
Firms’ behaviour is driven by their adjustment to weak profitability.
In view of the current, historical low level of capacity utilisation, a considerable increase in investment projects cannot be expected in the coming quarters, while the generally observed lower profit levels relative to previous years may be consistent with a subdued increase in wage expenditures. Although the urgent downsizing of corporate inventories may have finished by the middle of 2009, we do not expect a strong turnaround in the inventory cycle. In the restrained demand environment, the sector is expected to maintain a lower inventory level than in previous years.
It may become possible to finance the domestic economy without net external borrowing
We anticipate positive developments in the net lending/borrowing of the economy this year. Although the rapid improvement in the external equilibrium position may have been supported by temporary factors as well, we expect that the domestic economy may be financed without net external borrowing across our forecast horizon, even as these factors phase out. While parallel to the normalisation of profitability the income balance is expected to deteriorate in the coming years, its balance-deteriorating effects will be offset by the improving real economy balance and inflows of EU funds.
The deficit target for 2010 may be achievable by abolishing the substantial amount of reserves in the budget
Against the backdrop of increasing tensions on the expenditure side, in our baseline projection we anticipate a slight overshooting of the budget deficit path targeted for 2009. The deficit target for 2010 may be achievable only by abolishing the larger portion of the reserves recorded in the budget. Potentially, if temporary measures are required in order to achieve the deficit target for 2009, they may further aggravate the existing expenditure-side tensions in the budget trajectory for 2010. In the absence of additional measures, the budget deficit is expected to remain unchanged in 2011.
In view of the current expenditure tensions, the growing consolidation requirement of indebted firms in state ownership represents an increasingly serious problem over our forecast horizon.
A future consolidation may generate a significantly higher deficit at the time it is executed.
Chart 1 Inflation projection fan chart
-3 -2 -1 0 1 2 3 4 5 6 7 8 9
06:Q1 06:Q2 06:Q3 06:Q4 07:Q1 07:Q2 07:Q3 07:Q4 08:Q1 08:Q2 08:Q3 08:Q4 09:Q1 09:Q2 09:Q3 09:Q4 10:Q1 10:Q2 10:Q3 10:Q4 11:Q1 11:Q2 11:Q3 11:Q4
Per cent
-3 -2 -1 0 1 2 3 4 5 6 7 8 9Per cent
Chart 2 GDP projection fan chart (Seasonally adjusted, smoothed data)
-8 -7 -6 -5 -4 -3 -2 -1 0 1 2 3 4 5 6
06:Q1 06:Q2 06:Q3 06:Q4 07:Q1 07:Q2 07:Q3 07:Q4 08:Q1 08:Q2 08:Q3 08:Q4 09:Q1 09:Q2 09:Q3 09:Q4 10:Q1 10:Q2 10:Q3 10:Q4 11:Q1 11:Q2 11:Q3 11:Q4
Per cent
-8 -7 -6 -5 -4 -3 -2 -1 0 1 2 3 4 5 6
Per cent
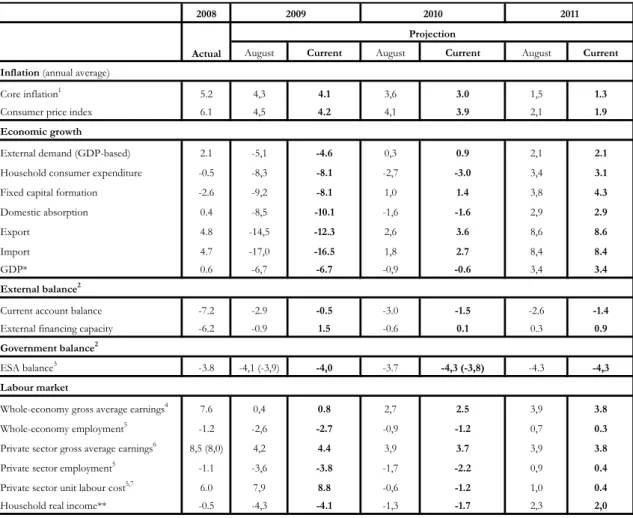
2008 2009 2010 2011 Actual
Inlation (annual average)
Core inflation1 5,2 4,1 3,0 1,3
Consumer price index 6,1 4,2 3,9 1,9
Economic growth
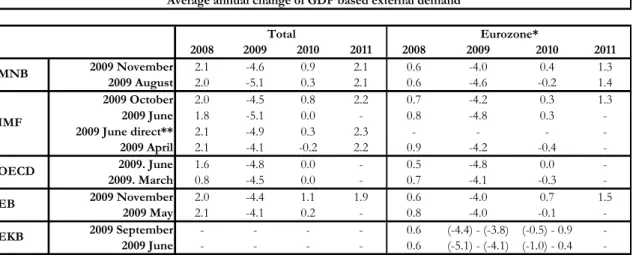
External demand (GDP based) 2,1 -4,6 0,9 2,1
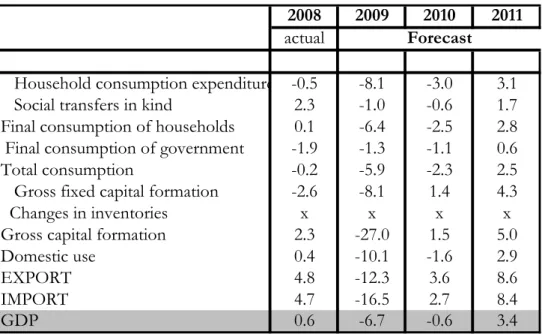
Household consumption expenditure -0,5 -8,1 -3,0 3,1
Gross fixed capital formation -2,6 -8,1 1,4 4,3
Domestic absorption 0,4 -10,1 -1,6 2,9
Export 4,8 -12,3 3,6 8,6
Import 4,7 -16,5 2,7 8,4
GDP* 0,6 -6,7 -0,6 3,4
External balance2
Current account balance -7,2 -0,5 -1,5 -1,4
External financing capacity -6,2 1,5 0,1 0,9
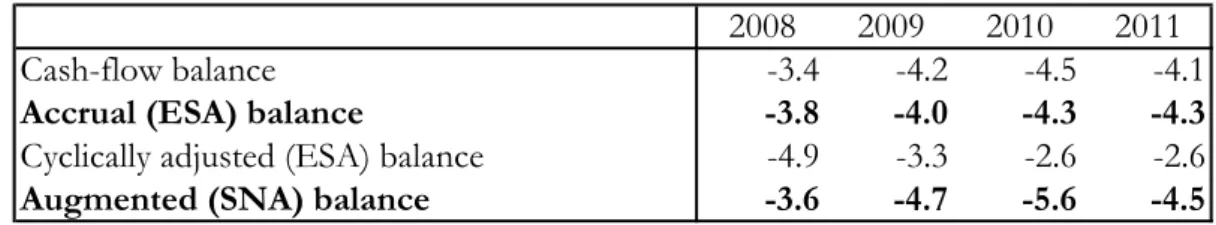
Government balance2
ESA balance3 -3,8 -4,0 -4,3 (-3,8) -4,3
Labour market
Whole-economy gross average earning 7,6 0,8 2,5 3,8
Whole-economy employment5 -1,2 -2,7 -1,2 0,3
Private sector gross average earnings6 8,5 (8,0) 4,4 3,7 3,8
Private sector employment5 -1,1 -3,8 -2,2 0,4
Unit labour costs in the private sector5 6,0 8,8 -1,2 0,4
Household real income** -0,5 -4,1 -1,7 2,0
Summary table of baseline scenario
Projection
1 From May 2009 on, calculated according to the joint methodology of the CSO and MNB. 2 As a percentage of GDP 3The numbers in brackets refer to the deficit achievable in case of abolishing the major part of budgetary reserves. 4Calculated on a cash-flow basis. 5According to the CSO LFS data. 6According to the original CSO data for full-time employees. The numbers in brackets refer to wages excluding the effect of whitening and the changed seasonality of bonuses.
7 Private sector unit labour cost calculated with a wage index excluding the effect of whitening and the changed seasonality of bonuses.
* Data are not adjusted for calendar effects.
** MNB estimate.
(The forecasts are conditional: the baseline scenario represents the most probable scenario, which applies only if the assumptions presented in Chapter 3 materialise; unless otherwise indicated, it represents
percentage changes on the previus year.)
1. Evaluation of macro-economic data Pace of economic deterioration slowing since mid-2009
The global financial and economic crisis hit an ailing Hungarian economy. Due to significant external imbalances and debts as well as certain government measures, domestic trends were characterised by subdued household consumption and rather sluggish investment activity in the years immediately preceding the onset of the global recession.
External demand conditions, which started to deteriorate significantly in September 2008, and an environment of increasingly tight lending forced all economic participants to adjust further, which led to a marked fall in output.
In developed economies, economic policy measures engineered to boost economic activity have succeeded in adequately stabilising the global economy in recent quarters. Overall, industrial production and export sales have been on the increase since early this year, and in the third quarter most economies experienced positive GDP dynamics. In the light of Q3 data, it is becoming increasingly obvious that the room for manoeuvre available for economic policy during the crisis has been exerting an increasingly spectacular impact on the speed of recovery. In economies where both public and private indebtedness rose quickly and asset price bubbles evolved in recent years, the significant decrease in internal demand continues to restrain economic performance. The fall in output is likely to be substantially sharper in these groups of countries, and recovery will also start later here than in the countries where measures were taken to boost the economy. A lack of room for manoeuvre for economic policy is also clearly reflected in the Hungarian growth trends.
Chart 1-1 Economic growth in Hungary (year on year)
-12,5 -10,0 -7,5 -5,0 -2,5 0,0 2,5 5,0 7,5 10,0
1961 1964 1967 1970 1973 1976 1979 1982 1985 1988 1991 1994 1997 2000 2003 2006 Q1-Q3 2009
Per cent
In the first 9 months of 2009, Hungary’s GDP fell by over 7% relative to a year earlier. A similar loss in output was last seen in domestic trends during the years immediately following the political changeover. Although external demand affected export sales favourably, it was only partially able to offset the marked fall in domestic demand. In line with this, Q3 data suggest only a moderate slowdown in the pace of the downturn, and no notable pick-up is expected for the time being. The government measures adopted to
establish a sustainable debt trajectory are restraining domestic demand to a significant degree, while monetary policy must also act in pro-cyclical manner if it is to ensure financial stability. Accordingly, the domestic macro-economic environment continues to be shaped by a pro-cyclical monetary and fiscal policy, subdued lending and external demand conditions which are more unfavourable compared to earlier years.
The structure of the Q2 decline in GDP deviated from our expectations slightly. On the final use side, due to some temporary factors, the major components of demand (consumption, investment) and net exports generated a better-than-expected contribution to growth, but this positive impact was neutralised by fast, strong downsizing of inventories. The temporary effects on domestic demand are likely to have adjusted in the third quarter, and thus in spite of growing export sales domestic GDP has been on the decline since the end of the previous year.
Chart 1-2 Contribution of absorption-side items to output*
-20 -15 -10 -5 0 5 10 15
00:Q1 00:Q4 01:Q3 02:Q2 03:Q1 03:Q4 04:Q3 05:Q2 06:Q1 06:Q4 07:Q3 08:Q2 09:Q1
% (annual change)
-20 -15 -10 -5 0 5 10 15
% (annual change)
Domestic use Inventories and statistical discrepancies Net exorts
*Considering that time-series with chain-type indices are not additive, aggregation errors were distributed between the individual items according to their weight.
Dynamics calculated from the resulting adjusted time series are less reliable from a quantitative perspective (they differ from the original data); nevertheless, the chart may still accurately reflect the prevailing trends.
On the production side, the major sectors of the economy made a significant negative contribution. Within this, the decline in the industrial sector remained dominant until mid- 2009. As the environment for external demand was increasingly stable, this is likely to have been caused by weak domestic sales and the dramatic downsizing of inventories in the first half of the year. Consolidation in industrial production (led by export sales) continued in Q3, and the value added of this sector is likely to have surpassed the level for the previous quarter. The recession also affected the performance of market service providers to an increasingly large degree, with these impacts particularly evident in the data for the third quarter. The decline in output was especially pronounced in the sectors most vulnerable to declines in domestic demand (commerce, tourist industry, transport). Companies in the financial services sector have still only suffered moderate profit losses. Output in sectors with a lower weight is likely to have been declined further in the past quarters, while the government’s growth contribution is expected to have remained neutral.
Chart 1-3 Contribution of the major sectors of the economy to output (quarterly growth, based on seasonally adjusted data)
-4 -3 -2 -1 0 1 2 3 4
00:Q1 00:Q4 01:Q3 02:Q2 03:Q1 03:Q4 04:Q3 05:Q2 06:Q1 06:Q4 07:Q3 08:Q2 09:Q1
% (quarterly growth)
-4 -3 -2 -1 0 1 2 3 4
% (quarterly growth)
Industry Agriculture and construction
Market services Government
GDP
In an environment characterised by extremely subdued demand, companies adjusted their labour costs and delayed their capital investment decisions rather than increasing prices in order to stabilise their income positions. As a result, wage dynamics declined further in the private sector, especially in the service sector. Although manufacturing companies’ wage and headcount adjustment in the labour market has slowed down, this is likely to reflect the more favourable economic developments in recent months.
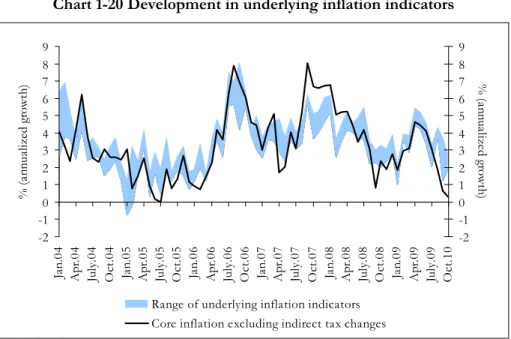
The decline in domestic demand has had an increasingly strong impact on domestic pricing decisions. As a result of the increases in indirect taxes in July, the CPI rose above 5% again, but after these tax effects are filtered out, our underlying inflation indicators suggest an increasingly strong disinflationary environment again, following a pause in the second quarter.
In the developed economies, economic policy measures designed to boost demand have successfully stabilised the global economy over the short term. As a result of these measures, one year after the outbreak of the crisis, GDP is growing again in the world’s more developed regions. It should be noted that important one-off effects (e.g. ‘cash for clunkers’ programmes, restocking of corporate inventories which were seriously depleted during the crisis) were also instrumental in global GDP growth in the third quarter. With these impacts wearing off, the global recovery is likely to proceed more slowly than in recent months.
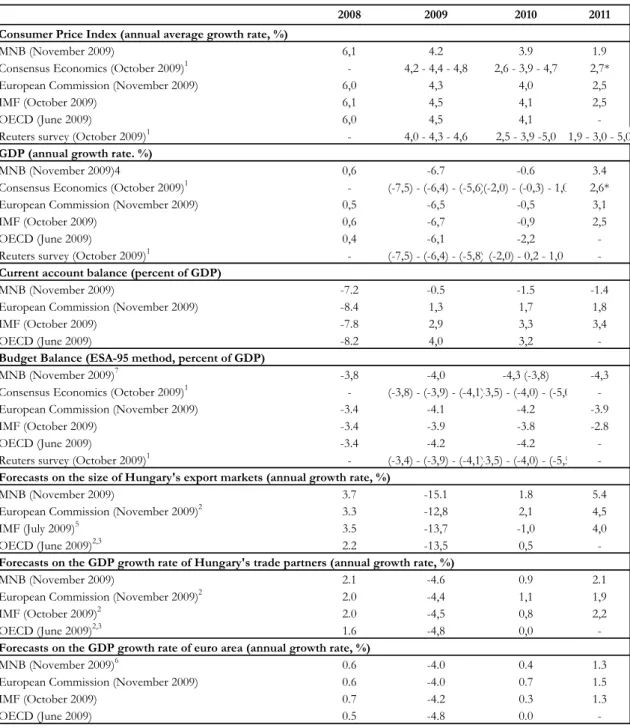
In response to the improving situation, major international institutions also upgraded their growth forecasts. In their view, the global economic recovery will start earlier than expected, which will also translate into some pick-up in economic activity in the euro area in 2010 already.
Chart 1-4 Growth in the euro area and confidence indicators
-3,0 -2,5 -2,0 -1,5 -1,0 -0,5 0,0 0,5 1,0 1,5 2,0
00:Q1 00:Q4 01:Q3 02:Q2 03:Q1 03:Q4 04:Q3 05:Q2 06:Q1 06:Q4 07:Q3 08:Q2 09:Q1
% (quarterly change, SA)
-60 -50 -40 -30 -20 -10 0 10 20 30 40
Balance
Final consumption GFCF
Changes in inventories Net export IFO climate (right axis)
The economic policy measures also stabilised economic performance in Germany, Hungary’s most important foreign trade partner. GDP increased in the third quarter; new industrial orders also picked up, influencing export sales in the economies of the region favourably.
Chart 1-5 Developments in industrial production in the region, the Euro area and Germany (annual change)
-30 -25 -20 -15 -10 -5 0 5 10 15 20
Jan.01 Aug.01 Mar.02 Oct.02 May.03 Dec.03 July.04 Feb.05 Sept.05 Apr.06 Nov.06 Jun.07 Jan.08 Aug.08 Mar.09
Per cent (%)
-30 -25 -20 -15 -10 -5 0 5 10 15 20
Per cent (%)
Euro area Czech Republic Germany
Hungary Poland Slovakia
The global recession also caused significant growth losses in the countries in the region.
On average, GDP fell by 5 to 8% on a year-on-year basis in the first half of 2009. The only exception is Poland, where – due to relatively good export sales and consistent growth in household demand – GDP dynamics remained in positive territory. In respect of the structure of growth and trends in third-quarter GDP data, however, the room for economic policy manoeuvre available to the individual countries led to increasingly clear differences. Countries which had either accumulated significant debts before the onset of
the crisis (Hungary) or had rapidly become indebted and had an asset price bubble (Romania) had little leeway to take actions in terms of short-term economic policy stimulus, and given the generally unfavourable labour market impacts, this led to a marked decline in household consumption. By contrast, economies that pursued significant fiscal and monetary easing (the Czech Republic and Slovakia) have already experienced some quarterly GDP growth since the second quarter, thanks to consistently growing domestic consumption. These dissimilar economic policy approaches may cause significant difference in the growth path in the quarters ahead. At the regional level, rapid downsizing of inventories, restrained capital investments and improved external balances were common.
Chart 1-6 Contribution of final use items to annual changes in GDP in the region
-2 0 -1 5 -1 0 -5 0 5 1 0 1 5 2 0
2007 2008 2009Q1 2009Q2 2009Q3 2007 2008 2009Q1 2009Q2 2009Q3 2007 2008 2009Q1 2009Q2 2009Q3 2007 2008 2009Q1 2009Q2 2009Q3 2007 2008 2009Q1 2009Q2 2009Q3
Czech Republic Poland Hungary Romania Slovakia
Contribution (percentage point)
-20 -15 -10 -5 0 5 10 15 20
Annual change (per cent)
Final consumption Gross fixed capital formation Change in inv entories and other Net exports
GDP (right axis)
Up until the beginning of this year, the recession resulted in significant adjustments in global commodity prices. After the first quarter of 2009, however, these prices started to rise again and they are currently at a level well above their historical average. Along with the improvement in demand prospects, underlying reasons may include speculative decisions by money market participants with sizeable surplus liquidity. Overall, consistently high and rising commodity prices pose further risks to the sustainability of the global economic recovery.
Chart 1-7 Developments in global commodity prices
0 50 100 150 200 250 300 350 400 450 500
Jan.00 Apr.00 July.00 Oct.0 Jan.01 Apr.01 July.01 Oct.0 Jan.02 Apr.02 July.02 Oct.0 Jan.03 Apr.03 July.03 Oct.0 Jan.04 Apr.04 July.04 Oct.0 Jan.05 Apr.05 July.05 Oct.0 Jan.06 Apr.06 July.06 Oct.0 Jan.07 Apr.07 July.07 Oct.0 Jan.08 Apr.08 July.08 Oct.0 Jan.09 Apr.09 July.09 Oct.0 2000=100
0 50 100 150 200 250 300 350 400 450 2000=100 500
Food Metal All commodity Petroleum
1.1 Domestic economic environment: increasingly strong decline in domestic demand
From Hungary’s perspective, it is an important issue how the economy responds to the changes in external economic activity, which is showing signs of recovery. After a steep downturn that lasted until early this year, domestic industrial production also showed signs of stabilisation, but no positive shift from a low level has been experienced until September. The improvement in Hungarian industrial performance is increasingly lagging behind regional developments. Although domestic industry’s export sales have picked up in line with the regional average in recent quarters, falling domestic sales have also hit industrial output adversely. It should be noted, however, that based on previous experience a large volume of domestic sales was linked to export sales. Therefore, in addition to declining domestic demand, other impacts (e.g. lack of funds facing small and medium-size businesses) may have also contributed to falling domestic sales. Overall, output in the domestic export sector responded positively to the improvement in external demand but due to the subdued domestic demand, industrial production in Hungary has grown more slowly than in the rest of the region.
Chart 1-8 Manufacturing production and sales
-40 -30 -20 -10 0 10
Czech Republic Hungary Poland Slovakia Czech Republic Hungary Poland Slovakia Czech Republic Hungary Poland Slovakia Czech Republic Hungary Poland Slovakia
Production Sales Domestic sales Export sales
Change (%)
Change between 08:Q3 and 09:Q1 Change between 09:Q1 and 09:Q3
The downturn in market services did not grow more severe until mid-year. The underlying reasons for this also included several one-off, temporary factors. Purchases brought forward in response to the government measures introduced on 1 July (tightening of the housing subsidy scheme, a rise in indirect taxes) temporarily raised sales volumes in the market of new homes and those of certain durables. These one-off effects are no longer being felt in the third quarter, and adjustments for such have been made, the dampening impact of an unfavourable macro-economic environment and pro-cyclical economic policy on demand will become increasingly clear. The downturn is being felt in a large number of sectors. In line with the unfavourable internal demand conditions, performance in commerce and the tourist industry have continued to deteriorate; likewise, in line with subdued commodity transport demand, transport also experienced a downturn. After the impact of purchases brought forward had worn off, retail sales suffered a double-digit fall in the second half of the year. By contrast, in the first half of the year the value added of financial services was higher than expected, due to the favourable results from investment activity in the financial intermediation system, which is, however, as annual comparison suggests, less likely to be similarly impressive in the second half.
In terms of sectors with a lesser weight, last year’s record harvests in agriculture increased the value added generated by the sector. Although crop yields have been higher than average this year as well, this will not influence growth data because of the extremely high basis from last year. In the second quarter, construction industry production was better than we had expected, which was due mainly to infrastructure investments financed from EU funds. This impact is expected to be temporary and be followed by a fall in output in the third quarter.
Weak performance in the private sector was somewhat offset by the public sector’s favourable contribution, which was due mainly to the “Pathway to Work” programme.
However, given its temporary nature, the medium-term growth impact of the programme remains moot.
On the final use side, developments in the major components of domestic demand were influenced by several temporary factors. As the effect of these temporary factors tapered
off, however, the marked decline in domestic demand has been increasingly dominant since the middle of the year, which remains a determining factor in respect of developments in domestic GDP despite the pick-up in global economic activity. In line with improved export sales and weak import demand (the latter attributable to subdued domestic demand), the contribution of net exports to growth remains decidedly positive, while inventories are falling fast.
Household real incomes have fallen due to increasingly strong labour market adjustment, rising inflation caused by increases in indirect taxes and government measures. In addition, the rapid rise in debt over the past few years also prompted households to adjust their balance sheets. This factor, coupled with restrained lending in the banking sector, resulted in lower consumption. Despite the above impacts, consumption data for the second quarter were better than expected. The underlying reasons included mainly temporary impacts. In response to increases in indirect taxes, consumers brought forward their purchases of certain goods. These timing considerations are likely to have temporarily changed the path of consumption in respect of expensive durables and goods subject to excise duties; in the latter case, the price increase was significant. Retail data for the third quarter reveal that this impact shifted conspicuously in the case of the goods mentioned, and thus, we expect household consumption to fall further in the second half of the year.
Growth in net household savings is likely to have continued in the third quarter. The process was facilitated by a growing financial asset portfolio, in addition to subdued lending, which suggests that the precautionary motive has become an increasingly important consideration.
Chart 1-9 Development in retail sales*
-30 -25 -20 -15 -10 -5 0 5 10 15 20
Jan.01 Apr.01 July.01 Oct.01 Jan.02 Apr.02 July.02 Oct.02 Jan.03 Apr.03 July.03 Oct.03 Jan.04 Apr.04 July.04 Oct.04 Jan.05 Apr.05 July.05 Oct.05 Jan.06 Apr.06 July.06 Oct.06 Jan.07 Apr.07 July.07 Oct.07 Jan.08 Apr.08 July.08 Oct.08 Jan.09 Apr.09 July.09
% (compared to the same month of the previous year)
-30 -25 -20 -15 -10 -5 0 5 10 15 20 % (compared to the same month of the previous year)
Durable goods Non-durable goods Semi-durable goods
* Durables: vehicles, furniture, household appliances, construction material and other industrial goods; semi-durables: clothing, footwear, medicine, second-hand goods, mail order services; fast-moving goods: foods, fuels.
The continuous decline in whole-economy capital investments, which had lasted for nearly two years, came to an end in the second quarter. This change for the better was due mainly to the government’s infrastructure investments, mentioned in connection with construction industry production, the underlying reason for which is a more efficient use of EU funds.
Companies continued to invest sparingly, which is due to slow improvement in profitability prospects, historically low profitability and tight lending conditions.
The downsizing of inventories continued, which led to a negative growth contribution of an unprecedented scale for this item. This process is likely to have been reinforced by one- off factors, but the downsizing of inventories can also be interpreted as a natural response of the corporate sector to the crisis. The decrease in inventories is especially conspicuous in the case of the input goods of the manufacturing industry and in commerce.
Box 1-1 Inventory developments in the whole-economy
As a result of the economic crisis, the sales prospects and financing conditions of the corporate sector have changed significantly. In their production-related decisions, firms reacted to these by modifying the levels of inventories. Accordingly, the growth contribution of inventory accumulation to gross domestic product was highly negative in the first half of the year, and the magnitude of this fall was unprecedented. Our analysis briefly reviews the motivations of firms’ inventory decisions and the recent evolution of inventories.
Firms do not only invest in buildings and machinery, but also keep inventories, which may be inputs for use in production or finished products waiting to be sold. Unfinished products or services (e.g. blocks of flats built for selling or legal services) are also qualified as inventories. The constantly changing business environment forces firms to continuously adapt, and inventory accumulation is one channel for this. Producers can ensure smooth operation and cope with price fluctuations on markets by accumulating inputs. Storing finished products allows for the continuous satisfaction of demand which arises and the maintenance of a stable level of production.
Short-term developments in inventory levels are mainly determined by firms’ expectations of business conditions and their financial condition. Over the long term, the level of inventories may be influenced by developments in the production and inventory management methods applied.
In Hungary, in past quarters changes in aggregate inventories were mainly determined by the behaviour of firms in the manufacturing and trade sectors. These sectors’ production and sales were especially affected by domestic and external demand effects. The significant tightening of financing conditions further deepened short-term problems. Firms tried to stabilise their respective positions by rapidly reducing their inventories, which was also reflected in the decline in aggregate inventories. In addition to the reaction to the crisis, domestic inventories were also affected by several one-off effects,1 which may have also played a role in the unprecedented negative growth effect.
1 The changes in Hungarian gas imports over the year and their effects on inventories were described in detail in the August 2009 Quarterly Report on Inflation.
Chart 1-10 Changes in inventories in the whole-economy
-4 0 0 -2 0 0 0 2 0 0 4 0 0 6 0 0 8 0 0 1 0 0 0 1 2 0 0
I. II. III. IV. I. II. III. IV. I. II. III. IV. I. II. III. IV. I. II. III. IV. I. II. III. IV. I. II. III. IV. I. II. III. IV. I. II.
2 0 0 1 2 0 0 2 2 0 0 3 2 0 0 4 2 0 0 5 2 0 0 6 2 0 0 7 2 0 0 8 2 0 0 9
b illio n H U F
-4 0 0 -2 0 0 0 2 0 0 4 0 0 6 0 0 8 0 0 1 0 0 0 1 2 0 0
billion HUF
P u rc ha se d inv e ntorie s (tra de ) P u rc ha se d inv e ntorie s (other se ctors) P u rc ha se d inv e ntorie s (m a nu fa ctu ring) S e lf-produ c e d inv entorie s (tota l ec onom y )
Inv e ntorie s plu s sta tistic a l d isc re pa nc y (from G D P sta tistic s, tota l ec onom y ) Inv e ntorie s (from G D P sta tistics, tota l e c onom y )
In line with the improving economic prospects, recovering confidence indicators and – according to commercial bank surveys – the expected easing in financing conditions, a turnaround is expected in the inventory cycle in the upcoming quarters. This may also be reinforced by the fading of one-off effects within the year (e.g. the filling of gas storage facilities). However, the positive growth effects of inventory accumulation are uncertain from several aspects. The statistical accounting of quarterly inventory changes is a difficult measuring problem, especially in case of small and medium-sized enterprises. This uncertainty may also contribute to the fact that in the past – especially in recessions – inventories and the statistical error on the absorption side of GDP tended to move in opposite directions. The negative correlation between the two items may also mitigate the effect of the change in inventories on GDP growth in the upcoming quarters.
Chart 1-11 Changes in the level of inventories as a proportion of GDP
30 35 40 45 50 55 60 65 70
I. II. III. IV. I. II. III. IV. I. II. III. IV. I. II. III. IV. I. II. III. IV. I. II. III. IV. I. II. III. IV. I. II. III. IV. I. II. III. IV. I. II. III. IV. I. II.
1999 2000 2001 2002 2003 2004 2005 2006 2007 2008 2009 Per cent
Inventories/GDP moving average
Strong growth of corporate inventories may be further questioned taking into account longer-term developments. The current level of inventories relative to GDP can be considered high even with the recent, significant adjustment. During the last global economic slowdown, an even stronger decline was observed. Long-term prospects of firms have not improved substantially, and therefore they are only expected to rebuild their inventories slowly. Following the current recession, the level of inventories is expected to be permanently lower than in previous years, due in part to the continuous development of applied stockpiling and logistics methods.
The consolidation of export processes and the decline in export demand significantly improved Hungary’s foreign trade balance. Within export sales, the sales of goods with a high added value, typically machinery, fell markedly, while food exports fared better. The latter was also facilitated by the lower-than-average exchange rate of the forint. Similarly to sales of food, service exports also only experienced a moderate decline. As regards growth contribution, however, only the sharper-than-expected fall in imports came as a surprise in the past quarters.
Chart 1-12 Developments in industrial production*
-50 -40 -30 -20 -10 0 10 20 30
Jan.05 July.05 Jan.06 July.06 Jan.07 July.07 Jan.08 July.08 Jan.09 July.09
Annual change (%)
-50 -40 -30 -20 -10 0 10 20 30
Annual change (%)
Food (10%) Light industry (4,5%)
Chemical industry (21,2%) Metal commodity industry (7,9%) Machine industry (46,4%)
* The weight of the sector in goods exports is shown in brackets.
We believe that the reason underlying the process was a change in domestic import demand. As regards structural changes, in a recessionary domestic environment, deterioration in income positions and prospects affected purchases with a high import ratio particularly adversely. This resulted in a relatively sharp fall in sales of durables in the case of consumption, and in machinery investments in the case of capital investments and in manufacturing exports compared with service exports, in the case of exports. Lower import demand may also persist in the quarters to come, although to a lesser extent than at present.
Chart 1-13 Changes in import demand and imports*
R2 = 0,6856
-10 -8 -6 -4 -2 0 2 4 6 8 10
-6 -4 -2 0 2 4 6
Domestic use + export quarterly change (%)
Import quarterly change (%)
* Data for the last four quarters are in yellow.
1.2 Increasingly strong wage adjustments in the service sector
Rapidly deteriorating profitability triggered by the crisis forced corporations to stabilise their income positions. As falling domestic demand was depressing prices to an increasingly large extent, corporations were reducing their costs to ensure their ability to operate. In order to do so, in the short run they postponed capital investments and reduced wage costs. In keeping with this trend, increases in private sector wages continued to slow and private sector employment was further downsized in the past quarter.
Chart 1-14 Wage developments in the private sector (annual index, seasonally adjusted data)
0 2 4 6 8 10 12 14 16
Jan.04 May.0 Sept.0 Jan.05 May.0 Sept.0 Jan.06 May.0 Sept.0 Jan.07 May.0 Sept.0 Jan.08 May.0 Sept.0 Jan.09 May.0
Per cent
0 2 4 6 8 10 12 14 Per cent 16
Private sector Manufacturing Market services