QUARTERLY REPORT ON INFLATION
MAY 2007
Published by the Magyar Nemzeti Bank
Publisher in charge: Judit Iglódi-Csató, Head of Communications 1850 Budapest, 8–9 Szabadság tér
www.mnb.hu ISSN 15850161 (print) ISSN1418-8716 (online)
Act LVIII of 2001 on the Magyar Nemzeti Bank, which entered into effect on 13 July 2001, defines the primary objective of Hungary’s central bank as the achievement and maintenance of price stability. Low inflation allows the economy to function more effectively, contributes to better economic growth over time and helps to moderate cyclical fluctuations in output and employment.
In the inflation targeting system, from August 2005 the Bank seeks to attain price stability by ensuring an inflation near the 3 per cent medium term objective. The Monetary Council, the supreme decision-making body of the Magyar Nemzeti Bank, performs a comprehensive review of the expected development of inflation every three months, in order to establish the monetary conditions that are consistent with achieving the inflation target. The Council’s decision is the result of careful consideration of a wide range of factors, including an assessment of prospective economic developments, the inflation outlook, money and capital market trends and risks to stability.
In order to provide the public with a clear insight into the operation of monetary policy and enhance transparency, the Bank publishes the information available at the time of making its monetary policy decisions. The Report on Inflation presents the inflation forecasts prepared by the Economics and Monetary Policy Directorate, as well as the macroeconomic developments underlying these forecast. The Report is published biannually, while twice a year partial updates of the forecasts are also prepared. The forecasts of the Economics and Monetary Policy Directorate are based on certain assumptions. Hence, in producing its forecasts, the Economics and Monetary Policy Directorate assumes an unchanged monetary and fiscal policy. In respect of economic variables exogenous to monetary policy, the forecasting rules used in previous issues of the Report are applied.
The analyses in this Report were prepared by the Economics and Monetary Policy Directorate’s staff under the general direction of Ágnes CSERMELY,Deputy Director. The project was managed by Mihály András KOVÁCS,Deputy Head of Economic Analysis, with the help of Zoltán Gyenes, Gergely Kiss, Szabolcs Lőrincz and Barnabás Virág. The Report was approved for publication by Ferenc Karvalits, Deputy Governor.
Primary contributors to this Report also include, Péter Gál, Cecília Hornok, Hedvig Horváth, Éva Kaponya, Gergely Kiss, András Komáromi, Zsolt Lovas, Balázs Párkányi, Dániel Palotai, Márton Peresztegi, Barnabás Tóth Máté. Other contributors to the analyses and forecasts in this Report include various staff members of the Economics and Monetary Policy Directorate.
The Report incorporates valuable input from the Monetary Council’s comments and suggestions following its meetings on 7 May 2007 and 21 May 2007. However, the projections and policy considerations reflect the views of the Economics and Monetary Policy Directorate staff and do not necessarily reflect those of the Monetary Council or the MNB.
Table of contents
1. Financial markets 6
2. Inflation and the major factors behind its development 12
2. 1. Economic activity 12
2. 2. Labour market 23
2. 3. Inflation trends 31
3. Outlook for inflation and the real economy 37
4. Background information and balance 46
4. 1. Background information to our projections 46 4. 2. Developments in general government deficit indicators 53
4. 3. External balance 60
Boxes and Special topics in the Report, 1998–2007 64
Overview
Gradual consolidation, the inflation target might be achieved within the policy horizon
This May issue of the Report contains a forecast for 2009 for the first time, as it was deemed necessary in order to be able to provide a better assessment of the developments taking shape over the 5- to 8-quarter forecast horizon relevant for monetary policy. In this forecast which covers close to three years, we expect gradual consolidation once the direct impacts of the fiscal adjustments fade. Inflation is projected to start a gradual decline in the second quarter of 2007 and, according to our baseline forecast, the inflation target will be reached at the horizon relevant for monetary policy. After this year’s considerable slowdown, the economy is expected to recover, although the GDP growth rate will not be able to reach its potential by the end of the horizon. Primarily in this year, we predict substantial improvements in fiscal indicators and external balance indices, due to the government measures implemented recently.
Slower
disinflation up to the end of 2008
Relative to our February forecast, we expect the disinflationary process to slow down until the end of next year. One reason for this is the upward trend in oil prices seen in recent months, which is likely to generate greater and longer lasting inflationary impacts due to the cuts in the gas price compensation scheme. Another factor pointing towards higher inflation is the rapid wage growth seen in the private sector. This very strong growth in wages in recent months – which can only be attributed to whitening to a lesser degree – is certainly not consistent with price stability over the medium term.
The tightening of monetary conditions in recent months will only be able to offset these impacts to a certain degree. As the output gap will remain negative over the entire forecast horizon, the real economy will have a disinflationary effect.
Wages well above productivity in the service sector
Based on trend indicators, which are adjusted for the impact of the regulatory environment (including the changing seasonal pattern of bonus payments and whitening), within the private sector as a whole, there is a distinct difference between the inflationary impact of wage dynamics in the manufacturing sector and in the service sector. In the manufacturing sector, the high rate of productivity is consistent with the wage dynamics observed. By contrast, in the service sector wages tend to generate increasing cost pressure, and consequently reduce the rate of profitability in the corporate sector. Over the medium run, there are potentially three main channels for adjustment; namely prices, wages and employment. In the baseline scenario, over the near term we expect to see strong wage adjustment and modest price pressure; this view is supported by the modest increase in the prices of wage dynamics would not decline to the extent we have expected market services during the first few months of this year. Nevertheless, the risk of wage dynamics higher than our expectation still persist, and this would mean greater price increases than our baseline scenario. This outcome carries inflationary risks especially if it is related to persistently higher price and wage expectations.
Substantial slowdown in growth in 2007
The starting point of the forecast of the real economy is robust external economic activity and the weaker-than-expected domestic demand in the second half of 2006. We continue to believe that the Hungarian economy will slow down even further in 2007, due primarily to declining household
consumption. Once the impacts of fiscal measures fade, the economy may slowly recover and domestic components play a greater role in growth.
Vibrant export growth, turning point in investment
Thanks to the favourable external environment, exports will remain strong in the coming years, as was the case last year. In our forecast we still project consumption smoothing by households, while their incomes will continue to fall this year, although not quite as much as we previously expected. In the following years the growth rate of consumption is expected to increase in line with a renewed increase in household incomes.
Following last year’s decline, investment is expected to gradually recover this year, but significant growth is unlikely before 2009 in spite of the fact that the absorption of EU funds is expected to grow.
Lower-than- expected budget deficit in 2007 and 2008, increasing risks in 2009
According to our forecast, the accrual-based budget deficit (ESA deficit) may come in below the deficit target indicated in Hungary’s convergence programme for both 2007 and 2008, due largely to the stronger-than-expected growth in revenues. Our baseline forecast in 2009 is slightly in excess of the government’s objectives, with an approximately symmetrical risk distribution.
Improving
external balance External balance indicators are likely to improve further in the coming years.
This year’s reduction in external financing requirement is attributed mainly to the sharp decrease in the budget deficit, while the private sector’s financing requirement may increase in the wake of consumption smoothing and a more intense investment environment.
During the 2008–2009 period we forecast a smaller reduction in the external financing requirement. On the one hand, the rate of reduction in the budget deficit will be slower than the rate we have seen this year, and on the other hand the financing requirement of the corporate sector may increase as the economy continues to pick up, and these two impacts can be off-set only by growing household savings.
Upside risks in inflation
In summary, it can be stated that in line with the main scenario, a significant decline in inflation may begin in the second half of this year, bringing the price index to a level consistent with the inflation target over the relevant monetary policy horizon of 5–8 quarters. Consistent with our previous forecasts, the baseline scenario is surrounded by significant bi-directional uncertainties and, on the whole, the risks are on the upside. The adjustment of the labour market constitutes the major risk factor pointing toward higher inflation, if it is related to higher price and wage expectations. If the disinflationary impact of the negative output gap is stronger than our forecast, or if there is a greater decline in demand components, this may result in lower inflation. The distribution of risks relating to the GDP forecast is symmetrical in our view in both years.
Inflation forecast fan chart
-1 0 1 2 3 4 5 6 7 8 9 10
05:Q1 05:Q2 05:Q3 05:Q4 06:Q1 06:Q2 06:Q3 06:Q4 07:Q1 07:Q2 07:Q3 07:Q4 08:Q1 08:Q2 08:Q3 08:Q4 09:Q1 09:Q2 09:Q3 09:Q4
Per cent
-1 0 1 2 3 4 5 6 7 8 9
10 Per cent
GDP forecast fan chart
0 1 2 3 4 5 6
05:Q1 05:Q2 05:Q3 05:Q4 06:Q1 06:Q2 06:Q3 06:Q4 07:Q1 07:Q2 07:Q3 07:Q4 08:Q1 08:Q2 08:Q3 08:Q4 09:Q1 09:Q2 09:Q3 09:Q4
Per cent
0 1 2 3 4 5 6
Per cent
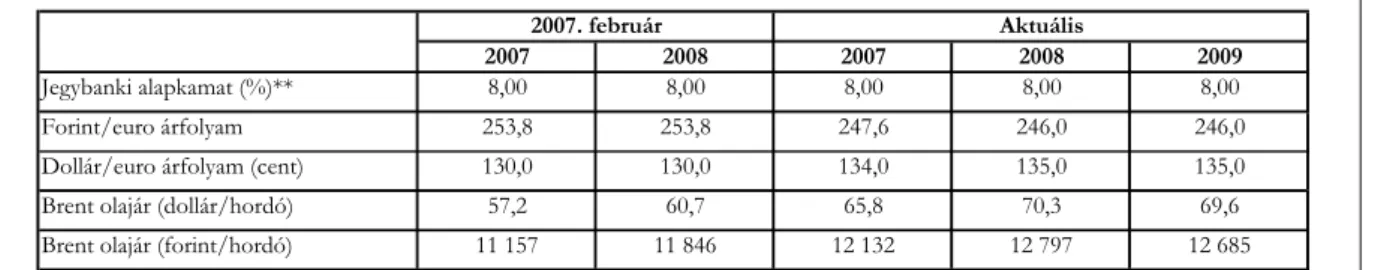
Summary table of the main scenario
(The forecasts are conditional: the main scenario reflects the most probable scenario only if all the assumptions presented materialise; unless otherwise specified, percentage changes on a year earlier)
2005 2006 2007 2008 2009
Actual Projection Inflation (annual average)
Core inflation1 2.2 2.4 5.7 3.4 3.1
Consumer price index 3.6 3.9 7.3 3.6 2.8
Economic growth**
External demand (GDP-based) 2.0 3.8 3.0 2.4 2.4
Impact of fiscal demand2 0.8 0.8 -3.4 -1.6 -0.3
Household consumption 2.1 1.2 -0.8 0.6 1.8
Gross fixed capital formation 6.7 -1.8 2.3 4.6 5.9
Domestic absorption** 0.8 0.5 0.0 1.7 3.2
Exports 10.7 18.0 15.3 11.8 9.5
Imports3, ** 6.5 12.6 12.2 10.7 9.4
GDP3 4.1 (4.3)* 3.9 (4.0) 2.5 2.8 3.4
Current account deficit3,**
As a percentage of GDP 6.8 5.8 4.7 4.4 4.2
EUR billions 6.0 5.2 4.9 4.9 4.9
External financing requirement3,**
As a percentage of GDP 6.0 5.0 3.3 2.3 1.8
Labour market
Whole-economy gross average
earnings4 8.9 8.7 7.2 6.2 5.0
Whole-economy employment5 0.0 0.6 -0.6 -0.1 0.1
Private sector gross average earnings 6.9 9.5 8.6 7.1 6.3
Private sector employment5 0.3 1.3 0.0 0.1 0.1
Private sector unit labour cost 2.2 5.8 5.9 4.6 3.2
Household real income 3.6*** 0.1*** -2.8 2.3 2.3
1 For technical reasons, the indicator that we project may temporarily differ from the index published by the CSO; over the longer term, however, it follows a similar trend. 2 Calculated from the so-called augmented (SNA) type indicator; a negative value means a narrowing of aggregate demand. 3As a result of uncertainty in the measurement of foreign trade statistics, from 2004 actual current account deficit and external financing requirement may be higher than suggested by official figures or our projections based on such figures. 4 Calculated on a cash-flow basis. 5 According to the CSO labour force survey.
* In 2005 calendar effects caused a downward distortion of GDP by some 0.2 percentage points. In order for trends in growth to be assessed, these effects must be applied to adjust the original data; corrected values are shown in brackets.
** Our projection includes the impact of the Hungarian Army’s Gripen purchase, which raises the current account deficit and increases community consumption and imports.
*** MNB estimate.
1. Financial markets
Apart from some temporary disturbances, the environment for international investments remained favourable over the last six months by historical standards. Investors’ high risk appetite continues to be supported by low interest rates in the developed markets, and the dynamic growth of emerging markets with improving fundamentals and an attractive yield environment.
The relative stability seen in the global money and capital markets is also attributed to the fact that the monetary tightening cycle in the advanced economies did not cause any major surprise and that the economic outlook did not go through any substantial changes.
Chart 1-1 Bond and credit indices
150 200 250 300 350 400
03.jan.05 02.febr.05 04.márc.05 05.ápr.05 05.máj.05 06.jún.05 06.júl.05 05.aug.05 06.szept.05 06.okt.05 07.nov.05 07.dec.05 06.jan.06 07.febr.06 09.márc.06 10.ápr.06 10.máj.06 09.jún.06 11.júl.06 10.aug.06 11.szept.06 11.okt.06 10.nov.06 12.dec.06 11.jan.07 12.febr.07 14.márc.07 13.ápr.07 Basis point
10 20 30 40 50 Basis point 60
EMBI MAGGIE High yield MAGGIE A (r.h.s.)
On the other hand, the negative shocks in risk appetite had a global impact during the aforementioned half-year period. The primary source of these shocks was the less favourable growth outlook of the US economy and the deteriorating attractiveness of carry trade strategies.
Towards the end of February bad news emerged about the Chinese and the American economies, and the dispute about Iran’s nuclear programme flared up again. Consequently, a significant capital reallocation took place, moving funds from risky investment instruments to less risky ones.
On the stock markets major adjustments took place. The implied stock market volatility quotations nearly doubled from an all-time low, and approached the levels seen during the money and capital market turbulence last May. The sudden drop in risk appetite, however, resulted in significantly less adjustments in the foreign exchange market, and the volatility of exchange rates rose slightly relative to the stock markets. In the foreign exchange markets the high-yield currencies (Brazil real, South African rand, Turkish lira) were hit the hardest, and together with the substantial gain of the Japanese yen this indicated the scaling back of carry trade positions.
As it turned out, the adjustments in the money and capital markets were only temporary. Asset prices recovered relatively quickly and were soon back up to the levels prior to the sell-off.
Subsequently, the interest premium on risky debt instruments once again dropped to an all-time low, or close to it. All in all, the magnitude of the adjustments and the path leading to it shows that the willingness of investors to undertake risk could be vulnerable under the present circumstances, and that there is only limited room for any further improvement in risk appetite.
Chart 1-2 Stock market indices (1 January 2007=0)
-10 -5 0 5 10 15
Jan 2007 Jan 2007 Jan 2007 Feb 2007 Feb 2007 Mar 2007 Mar 2007 Apr 2007 Apr 2007 May 2007
Per cent
-10 -5 0 5 10 15
Hungary (BUX) Poland (WIG 20) Czech Republic (PX50)
Brazil (Bovespa) Mexico (Bolsa) Germany (DAX)
Japan (Nikkei) USA (Dow Jones)
Per cent
Chart 1-3 Implied stock market volatility
5 10 15 20 25 30
2005. Jan. 2005. Feb. 2005. Mar. 2005. Apr. 2005. May. 2005. Jun. 2005. Jul. 2005. Aug. 2005. Sep. 2005. Oct. 2005. Nov. 2005. Dec. 2006. Jan. 2006. Feb. 2006. Mar. 2006. Apr. 2006. May. 2006. Jun. 2006. Jul. 2006. Aug. 2006. Sep. 2006. Oct. 2006. Nov. 2006. Dec. 2007. Jan. 2007. Feb. 2007. Mar. 2007. Apr.
Per cent
5 10 15 20 25 30
VIX Index (S&P 500) Dj Stoxx volatility index
Per cent
The global economic outlook nonetheless remains favourable. Analysts expect the global economy to grow around 5 per cent this year, as in the past years. However, the rate of growth in the various regions may differ from what it has been in recent years. The most important change from the perspective of financial markets is that the growth rate in the euro area is expected to reach the growth rate of the American economy. The majority of market participants expect to see the rate of economic expansion in the US slow down somewhat this year from the long-term rate, while the euro area is predicted to grow a little above potential.
The pricing of money market instruments is consistent with somewhat looser monetary policy from the Fed around the end of this year and with a continuation of the monetary tightening cycle by the ECB. Due to the expansion of the euro area economy and the steady rise in forward reference euro interest rate expectations, the euro appreciated sharply during the last six months vis-à-vis the currencies of the developed economies, reaching an absolute high against the yen and the dollar.
Chart 1-4 Trends in emerging market currencies and the euro-dollar (1 November 2006=0)
-3 -2 -1 0 1 2 3 4 5 6 7 8 9
2006. Nov 2006. Dec 2007. Jan 2007. Feb 2007. Mar 2007. Apr 2007. May
Per cent -9
-8 -7 -6 -5 -4 -3 -2 -1 0 1 2 3
Hungarian forint/euro Polish zloty/euro
Turkish lira/dollar Brazilian real/dollar
South Africa rand/dollar euro/dollar (right-hand, reversed scale) Per cent
Chart 1-5 Volatility of exchange rates in the developed markets (G7) and in the emerging markets (EM) as calculated by JP Morgan
5 6 7 8 9 10 11 12 13
2005. Apr. 2005. May. 2005. Jun. 2005. Jul. 2005. Aug. 2005. Sep. 2005. Oct. 2005. Nov. 2005. Dec. 2006. Jan. 2006. Feb. 2006. Mar. 2006. Apr. 2006. May. 2006. Jun. 2006. Jul. 2006. Aug. 2006. Sep. 2006. Oct. 2006. Nov. 2006. Dec. 2007. Jan. 2007. Feb. 2007. Mar. 2007. Apr. 2007. May.
Per cent
5 6 7 8 9 10 11 12 13
JPM G7 VolatilityIndex JPM EM VolatilityIndex Per cent
Looking ahead, from the perspective of the environment for international investments, the uncertainty surrounding the US economy constitutes the greatest risk. On the one hand, if the rate of slowdown is higher than forecasted, it could trigger a renewed reallocation of capital to less risky instruments (above all to developed market government bonds), which in turn could lead to significant adjustments in stock market prices and in exchange rates of high-yield currencies in emerging markets. In spite of the fact that inflation trends in the US have improved slightly in the past six months, the level of inflation is still higher than what is considered desirable by the Fed. Therefore, on the other hand, any unfavourable developments on the inflation front may once again trigger inflation fears and higher interest rate expectations, similar to last May, and that could have a negative impact on asset prices in the emerging markets.
On the whole, financial markets expect to see favourable environment for international investments, dynamic global economic growth and a gradual reduction in the current imbalances.
However, looking at the prices of risky instruments, it appears that investors’ demand for these instruments rose to unusual highs even by historical comparison, which means that the risk
appetite of investors could be very sensitive to unfavourable economic and geo-political developments.
Amidst the favourable external conditions, starting from the end of November there was a shift in investors’ sentiment toward Hungarian instruments. The forint exchange rate appreciated from EUR/HUF 260 in late November to EUR/HUF 245-250 by April. In addition to the favourable environment for international investments, macroeconomic developments in Hungary also played a decisive role in the forint gaining strength and hence in the improving confidence of investors in Hungary.
During the last half-year period we have seen a positive change in Hungarian macroeconomic balance indicators. In the fourth quarter of 2006 the current account deficit turned out better than what analysts had expected, and the general government deficit in 2006 and during the first four months of 2007 also reflected more favourable numbers than what had been anticipated by the Ministry of Finance. All in all, investors appear to have been convinced that the economy has embarked on a path of reducing the significant internal and external imbalances. At the same time, the gradual reduction in the uncertainty related to the rise in inflation over the past six months, and its stabilization at the level expected by the central bank and the market participants alike, triggered appreciation of the forint and stronger rate cut expectations. Based on the yield curve, at the end of November investors were expecting the base rate to settle at 7.5 per cent by the end of 2007, and at 7 per cent by the end of 2008; by mid May these expectations had dropped to 6.75 per cent for the end of 2007 and 6.5 per cent for the end of 2008.
Chart 1-6 EUR/HUF exchange rate
240 245 250 255 260 265 270 275 280 285
2005. Jan 2005. Feb 2005. Mar 2005. Apr 2005. May 2005. Jun 2005. Jul 2005. Aug 2005. Sep 2005. Oct 2005. Nov 2005. Dec 2006. Jan 2006. Feb 2006. Mar 2006. Apr 2006. May 2006. Jun 2006. Jul 2006. Aug 2006. Sep 2006. Oct 2006. Nov 2006. Dec 2007. Jan 2007. Feb 2007. Mar 2007. Apr E UR/HUF
240 245 250 255 260 265 270 275 280 285 E UR/HUF
E xchange rate
Chart 1-7 Central bank base rate and the base rate estimated from the yield curve for the end of 2007 and 2008
5,756,00 6,25 6,50 6,757,00 7,25 7,50 7,75 8,00 8,25 8,50 8,75
2006. May 2006. Jun 2006. Jun 2006. Aug 2006. Aug 2006. Oct 2006. Nov 2006. Dec 2007. Jan 2007. Feb 2007. Mar 2007. Apr
Per cent
5,756,00 6,25 6,50 6,757,00 7,25 7,50 7,75 8,00 8,25 8,50 Per cent 8,75
MNB policy rate
policy rate expected for 31.12.2008 policy rate expected for 31.12.2007
Late last year and in the first months of this year, due to the decline in uncertainty from domestic political turmoil and steps taken by the credit rating institutions, the exchange rate settled in at EUR/HUF 251-259. S&P improved its rating of Hungarian debt servicing capacity from negative to stable, while Moody’s downgraded its rating from A1 to A2. In the latter case, however, the extent of the downgrade was below market expectations, and therefore, on the whole it had a positive impact on the markets.
At the same time, the fact that required premiums on long-term forint investments did not decrease substantially was a sign that investors were taking a more cautious position. The markets adopted a wait-and-see approach, for at this time the first results of the macroeconomic adjustments were not yet visible and because there was considerable uncertainty as to how high inflation might rise. However, the drop in the prices of Hungarian instruments triggered by negative shocks in the demand of investors for risky instruments in late February was minor and temporary, thanks in part to favourable sentiment of investors toward the region, and also to improving confidence in macroeconomic developments in Hungary.
Chart 1-8 Five-year forward premium above euro yields on currencies of the region 5 years ahead
-25 0 25 50 75 100 125 150 175 200 225 250 275
2003. Jan 2003. Mar 2003. Jun 2003. Aug 2003. Nov 2004. Jan 2004. Apr 2004. Jun 2004. Aug 2004. Oct 2004. Dec 2005. Feb 2005. Apr 2005. Jun 2005. Sep 2005. Dec 2006. Feb 2006. May 2006. Jul 2006. Oct 2007. Jan 2007. Apr
Basis point
-25 0 25 50 75 100 125 150 175 200 225 250 275 Basis point
Poland Hungary Czech Republic Slovakia
In early March, the demand for forint investments started to increase again quickly. The lower level of premium settled in April, which may indicate that in investors’ view the sustainability of macroeconomic adjustments has increased considerably since last November, thereby boosting their confidence in forint instruments. On the other hand, the fact that the premium is still considered high within the region indicates a great degree of uncertainty surrounding the Hungarian convergence process.
Beside the aformentioned factor, the revaluation of the Slovakian currency exchange rate band also led to forint appreciation, causing the Hungarian currency to break out of the EUR/HUF 251-259 trading range of the previous months. There was talk among market participants about the possibility of the Hungarian exchange rate band being abolished. According to market information, the majority of investors did not expect any shift in the Slovakian exchange rate band, and several of them took on a speculative position instigated by the rumours floating about the abolishment of the Hungarian exchange rate band. Consequently, the exchange rate appreciated all the way up to EUR/HUF 245. In the month of March the forint positions of foreign investors increased by close to 400 billion forints, and their holdings of government bonds reached an all-time high.
In line with market expectations, the central bank held its reference interest rate at 8 per cent throughout this past half-year period. At the same time, market participants gradually reduced their expectations for the year-end base rate essentially in parallel with the appreciation of the forint and with inflation following the projected path. According to Reuters surveys the number of analysts expecting any further increase in the interest rate dropped from month to month, while the projected date for the first interest rate cuts was also brought forward on several occasions. Monetary conditions became stricter during the past half-year period due primarily to appreciation of the nominal exchange rate. However, the one-year forward real interest rate dropped slightly in recent months in response to the reduction in short-term yields, while the level of real interest rate is at 3–4 per cent, as seen in previous years.
Chart 1-9 Monetary conditions
0 1 2 3 4 5 6 7 8 9 10
1997. Jan 1997. Jul 1998. Jan 1998. Jul 1999. Jan 1999. Jul 2000. Jan 2000. Jul 2001. Jan 2001. Jul 2002. Jan 2002. Jul 2003. Jan 2003. Jul 2004. Jan 2004. Jul 2005. Jan 2005. Jul 2006. Jan 2006. Jul 2007. Jan
Per cent
95 100 105 110 115 120 125 130 135 140 145 Per cent
1 year real interest rate CPI based real exchange rate (r.h.s.)
2. Inflation and the major factors behind its development
2. 1. Economic activity
In 2006, the rate of economic growth reached 3.9 per cent (4.0 per cent adjusted for the calendar effect), close to the average recorded in previous years.1 GDP growth, however, slowed during the year in the wake of fiscal adjustments, while the composition of growth is characterised by increasing duality. Growth in internal demand was somewhat less dynamic, whereas net exports – thanks to increasingly robust external economic activity – were better than expected last year.
There was a decline in consumption despite outstanding wage growth, and investments slowed down in spite of favourable export conditions, while lacklustre demand in the government sector was below expectations as well, considering the fact that 2006 was an election year. The historically high contribution of net exports to growth was the result of stronger exports driven by favourable international economic activities, combined with slower growth in imports prompted by weaker internal demand.
Chart 2-1 Contribution of domestic expenditures and net exports to real GDP growth (annual volume indices)
-6 -4 -2 0 2 4 6 8 1 0 1 2 1 4
1 9 9 6 1 9 9 7 1 9 9 8 1 9 9 9 2 0 0 0 2 0 0 1 2 0 0 2 2 0 0 3 2 0 0 4 2 0 0 5 2 0 0 6 P e r c e n t
-6 -4 -2 0 2 4 6 8 1 0 1 2 1 4 P e r c e n t
D o m e stic u se (w ith o u t in v e n to rie s ) C h a n ge s in in v e n to rie s
E xt e rn a l tra d e b a la n c e o f g o o d s a n d s e rv ic e s G ro s s d o m e stic p ro d u c t, to t a l
Good performance in external markets, however, was insufficient to offset the unfavourable developments in Hungary. From the second half of the year it became apparent that Hungary’s economic growth was losing momentum compared to other countries in the region, and our advantage relative to the economic growth of the euro area vanished.
1 The preliminary Q1 GDP data for 2007 was published by the Central Statistical Office after the information set for the Report had been closed. The data shows 2.9 percent (3.0 per cent without calendar effects) real GDP growth for the first three month of the year compared to corresponding period of the previous year. Bearing in mind the uncertainty of the preliminary data, the growth number is in line with our expectations, hence, at least until the details are known, our overall conjunctural assessment of the Hungarian economy remains largely unchanged.
Chart 2-2 Economic growth in the Central and Eastern European region*
-2 0 2 4 6 8 10 12
96:Q1 96:Q3 97:Q1 97:Q3 98:Q1 98:Q3 99:Q1 99:Q3 00:Q1 00:Q3 01:Q1 01:Q3 02:Q1 02:Q3 03:Q1 03:Q3 04:Q1 04:Q3 05:Q1 05:Q3 06:Q1 06:Q3
Per cent
-2 0 2 4 6 8 10 12 Per cent
Euro area Czech Republic Poland
Slovakia Szlovákia Hungary
* Volume indices of real GDP
The dualistic nature of growth is well illustrated by the fact that over the last two years the growth rate of domestic income in real terms (RGDI) remained below the growth rate of real GDP (gross domestic product), primarily due to a decline in the terms of trade triggered by rising energy prices.2 This difference is considered high compared to previous figures and also relative to other countries in the region. In addition, it is consistent with the fact that domestic absorption in Hungary was at an all-time low and the component of GDP growth driven by the export sector was higher than the historical average.
2 GDI is calculated by the following formula:
GDIreal = GDPreal + { ( X – M )/[(Px + Pm)/2] – (X/Px – M/Pm) } ,
where X and M stand for exports and imports at current costs, Px and Pm are the deflators of exports and imports.
When GDP grows faster than GDI, it means that – in real terms – the income of domestic economic agents grew slower than what is indicated in the GDP growth rate.
Chart 2-3 The difference of GDP and GDI in the region*
-4 -3 -2 -1 0 1 2 3 4
1996 1997 1998 1999 2000 2001 2002 2003 2004 2005 2006
Per cent
-4 -3 -2 -1 0 1 2 3
4 Per cent
Hungary Poland Slovenia Slovakia Czech Republic
* Differences of annual volume indices in percentage points
Hungarian exports are dynamic, but can they be sustained?
The unexpected growth in external demand triggered a stronger-than-expected increase in exports. At the same time, the foreign trade balance of goods and services was positive for the first time in many years.
Chart 2-4 Trade balance of goods and services in current prices and the developments of the terms of trade
-900 -600 -300 0 300 600 900
1996 1997 1998 1999 2000 2001 2002 2003 2004 2005 2006 billion HUFs
0,70 0,75 0,80 0,85 0,90 0,95 1,00 1,05 1996=11,10
goods services
goods and services terms of trade (right scale) terms of trade without energy items (right scale)
Hungary’s foreign trade balance improved despite the deterioration in the terms of trade caused by higher imported energy prices. The favourable shift in volumes – i.e. export volumes were significantly higher than imports – compensated for this impact. However, the improvement in
the trade balance was not exclusively caused by the efficiency of the export sector, as weak import demand due to sluggish domestic demand was also a contributing factor.3
The principal reason for the upturn in exports was the unexpectedly high import demand from the German economy and its closest partners. Business confidence indicators (e.g. IFO) reflecting the views and expectations of managers in Germany have been at historic highs for several months.
Chart 2-5 Export and import of goods, import-based foreign demand and IFO business indicators
-10 -5 0 5 10 15 20 25 30 35 40
00:Q1 00:Q3 01:Q1 01:Q3 02:Q1 02:Q3 03:Q1 03:Q3 04:Q1 04:Q3 05:Q1 05:Q3 06:Q1 06:Q3 07:Q1
Per cent
80 84 88 92 96 100 104 108 112 116 120 levels
import-based foreign demand ** IFO business situation (left scale) IFO business expectations (left scale) Export *
Import *
*Year on year volume indices from trend
** Year on year volume index
Accordingly, foreign trade data from the early part 2007 also indicate the robust expansion in exports. At the same time, according to the latest information there are some signs of stronger import dynamics well, which may foreshadow a pause in the improving trend of foreign trade balance.
In order to determine the degree of sustainability of Hungarian export dynamics, we should compare it to other countries’ performance in the region, over a longer time horizon. The results of our analysis point to question marks as to how competitive Hungarian exports are in international markets: while our market share in terms of volume is considered favourable (similarly to our competitors), our relative export prices have declined since the turn of the millennium (see box below).
Box 2-1 How good is Hungarian export performance in a regional comparison?
Over the past two years, the export output of the Visegrád Four has been far better than expected, thanks to buoyant economic activity in Europe. In late 2006 and early 2007, the rate of growth in exports of goods and services surged up to 20 per cent on average throughout the region, with Hungary taking second place behind Slovakia. Taking the perspective of a longer timeframe, apart from the brisk economic activity in Europe, entry into new markets also enhanced the dynamic growth of exports. On general principle, sales of goods to markets outside the EU-25 increased considerably, in other words, the
3 It must be noted that, however, that even though the foreign trade balance has been improving continuously since 2004, its development must be judged with caution due to the methodological problems originating form the underestimation of imports and overestimation of exports. The degree of uncertainty is around 2-3 per cent of GDP.
For more details on this issue, please see Box II-1 and IV-5 in the Inflation Report of August 2005.
volume of export sales shifted from the relative slow growing Western European markets to markets outside the EU-25, mostly to Eastern European markets (Chart 1).
Hungary took the lead in shifting the main stream of the export of goods to markets outside the EU-25.
While the overall volume of Hungarian exports grew at a rate similar to our competitors between 2000 and 2006, it showed the slowest growth rate in the EU-25 and the fastest growth rate outside this area.
This phenomena is consistent with the conclusions set forth in the studies conducted concerning the foreign trade integration within the region, notably that Hungary’s integration in foreign trade with the EU-15 – unlike other countries in the region – came close to reaching an equilibrium at the turn of the millennium, which could also be the reason for the slower export dynamics in the EU markets.4
Chart 2-6 growth of export of goods in the region between 2000 and 2006 (growth percentage in euro value and volume)
0 50 100 150 200 250
EU25 extra- EU25
EU25 extra- EU25
EU25 extra- EU25
EU25 extra- EU25 Czech Republic Hungary Poland Slovakia Per cent
0 50 100 150 200 250 Per cent Volume
Value in euros
Growth of imports to EU25 (volume) Growth of imports to EU25 (value)
Source: Eurostat.
Looking more closely at the export performances in the region, which appear favourable on the whole, it is found that trends in Hungary are on a path somewhat different from the three competitors, which could also raise doubts concerning the sustainability of the good export performance, particularly because contrary to the dynamic growth in volume Hungarian export sales paint a gloomier picture measured in terms of current prices. Measured in euro, between 2000 and 2006 Hungary was the last in the region in terms of growth in exports, which means that the relative export prices decreased compared to our competitors. While the export price indices went up in the other three countries of the region, the unit price of Hungarian exports stagnated on the EU-25 markets, and decreased in markets outside the EU-25.
At this juncture, it is important to point out that changes in the export unit price index could reflect the common price trends in the destination market relative to a specific product structure, and/or a shift in the product structure of the country toward higher priced products. On general principle, the world market prices of goods supplied in foreign trade were decreasing during the period under review, due mostly to increasingly strong globalisation pressure. In this light, trends in Hungarian export prices did not come as a surprise. However, lower world market prices have a different effect on the various products.
While Hungary specialised in products whose prices had been typically declining (office machines and telecommunications equipment), the product structure of other countries in the region contained goods fetching higher prices (e.g. motor vehicles).
4 See Jakab-Kovács-Oszlay: Where foreign trade integration is headed?, MNB Working Papers 2000/1, or Bussiere et al.: Trade Integration of Central and Eastern European Countries. Lessons from a Gravity Model, ECB Working Paper No. 545.
Furthermore, another factor contributing to the relative decline of Hungarian export prices is that the product structure of other countries in the region comprises more advanced (meaning higher priced) products. A review of the export product structure of our competitors in the region supports the conclusion that this type of composition could well be the reason behind the relative export price trends under review. Between 2000 and 2006, the product structure of our competitors shifted toward a more advanced product line, and especially in the Czech Republic and in Slovakia the ratio of high-tech export goods increased considerably. On the other hand, the Hungarian product structure in the high tech segment failed to improve any further, due in part to the fact that it started off from the highest level in the region.
Chart 2-7 Changes in the export structure in the region according to technological development (in percentage of the euro value of all export sales)
0%
20%
40%
60%
80%
100%
2000 2006 2000 2006 2000 2006 2000 2006
high-tech medium-high tech medium-low tech low-tech
Czech Republic Hungary Poland Slovakia
Sources: Eurostat, Comext database. Technological classification based on the OECD’s classification.
The phenomena illustrated above carry a variety of messages regarding the sustainability of Hungary’s export. The good news is that the difference between the export growth rate in terms of volume, that is considered good by regional comparison, and the unfavourable growth rate at current prices (in other words, the lower relative export prices) are attributed, for the most part, to world market trends, and also to current developments in other countries of the region concerning technological convergence, that took place in Hungary before the turn of the millennium. In spite of all these factors, the Hungarian export structure retained its leading position in the region in 2006, and it showed signs of flexibility in exploring sales opportunities outside the EU-25 markets.
Nevertheless, the phenomena illustrated above also raise questions about the future of the export sector in Hungary. It should definitely be noted that the volume of high tech products in exports did not increase during the past six years. Although the product structure of Hungarian exports is considered advanced by international standards, there is still room for improvement as demonstrated by the examples of more developed nations (such as Ireland first and foremost).5 Furthermore, regional trends indicate that we can expect increasing competition in the product structure from the emerging countries of the region in our traditional markets. Although we could shift our main stream of export sales from the EU-25 markets to markets outside the EU-25, according to previous experience the markets outside the EU are able to receive lower priced products (meaning goods of presumably lesser technology and lower quality), therefore, the product structure of Hungarian exports could be drawn in an unfavourable direction.
5 See: OECD Science, Technology and Industry Scoreboard 2005.
Investments: temporary dip or long-term decline?
In 2006, there was a fall in the volume of investments for the first time in more than ten years.
This downward process started in the second quarter, before the announcement of the fiscal adjustment and was widespread across different breakdowns. The two main types of investments, construction and machinery, declined in tandem, and estimates of the various sectors indicate downward trends in the corporate and the household sector, with a significant slowdown observed for the government sector as well.
Chart 2-8 Volume indices of total investments and its main components*
-10 -5 0 5 10 15 20 25 30
1995 1996 1997 1998 1999 2000 2001 2002 2003 2004 2005 2006 Per cent
-10 -5 0 5 10 15 20 25
30 Per cent
Total Construction (~ 55%) Machinery and equipment (~40%)
*Average shares of components are shown in parantheses. Annual 2006 data are weighted averages of 2006 quarters.
In the wake of fiscal adjustments, the slower investment activity in the non-tradable corporate sector (mostly in services) is consistent with slowing domestic demand expectations. The driving factor behind the decline in the volume of household investments – apart from falling real incomes due to fiscal adjustment – is the general depression seen in the real estate market. The moderate investment activity of the government-related sectors is the direct result of the cutback on fiscal expenditures.
However, the declining willingness of industrial companies, which rely mostly on external demand, to embark on new investments is surprising in light of favourable external demand conditions. For a long time, economic agents underestimated the current robust economic activity in terms of strength and durability. Consequently, they focused on improving their capacity utilisation rather than increasing their investments. This phenomena was observed in other countries of the region and also in our export markets. However, in line with the improving business outlook, the investments dynamics in these countries began to increase over recent quarters, while in Hungary, the trend is just the opposite, both in overall economy investments as well as in the manufacturing industry.
The frail investment climate can be explained by the fact that Hungary consistently fell behind the other countries of the region in competitiveness rankings.6 Additionally, the unsustainable fiscal path prior to the adjustment and the ensuing corrections that had been unknown for a long time, caused a considerable amount of uncertainty for the corporate sector in terms of planning.
The fiscal adjustment mitigated this uncertainty to some extent, however, over the short run, it
6 For more information consult our publication entitled “Report on Convergence (December 2006)”.