C
ORVINUSU
NIVERSITY OFB
UDAPESTCEWP 0 4 /2020
Economic growth and income distribution implications of public spending and tax
decisions
Zsolt Darvas
http://unipub.lib.uni-corvinus.hu/5975
Economic growth and income distribution implications of public spending and tax decisions Zsolt Darvas1
1 October 2020
Abstract
The level and composition of public expenditures and revenues both have implications for economic development, as shown by the ‘fiscal multiplier’ and the ‘quality of public finance’
literature. Public finance decisions also influence the distribution of income. Based on a review of the literature, I argue for a fair distribution of income as reflected in low-income inequality, not particularly because of the impact of income inequality on long-term growth (which is a controversial issue), but primarily because income inequality typically implies inequality of opportunity. European Union countries have very diverse public finance structures and
different levels of effectiveness and there is room for improvement in the growth and equality impacts in all countries. A general guideline would be that the most effective approach
comprises progressive taxes and inheritance taxes, spending on education, health and public infrastructure, and better government effectiveness. At the height of the 2008 global crisis and the subsequent European financial and economic crises, the fiscal consolidation strategies of EU countries largely relied on cutting public investment and social spending (except pensions), which is the opposite of what is suggested in the literature. Better fiscal rules and good fiscal institutions are needed to safeguard growth- and distribution-friendly expenditures in a crisis.
Keywords: taxation, public pending, economic growth, income inequality JEL codes: D63, H20, H50, O40
The first version of this paper was prepared for the Budapest Public Finance Seminar 2019 on ‘Growth implications of state budget income and expenditure structure’, 23 May 2019, Budapest, Hungary, organised by the Hungarian State Treasury. I thank Boris Cournède and conference participants for useful comments and suggestions.
1 Senior Fellow at Bruegel and Senior Research Fellow at Corvinus University of Budapest. Email:
zsolt.darvas@uni-corvinus.hu
1. Introduction
Extensive literature shows that both the level and composition of public expenditures and revenues have implications for economic development. There are two main strands of the literature. The discussion on the short-term impacts of public finance decisions was especially active after the 2008 global crisis and the subsequent European financial and economic crises, when several countries implemented fiscal consolidation strategies. This literature is frequently referred as the ‘fiscal multiplier’ discussion (eg Auerbach and Gorodnichenko, 2012; Blanchard and Leigh, 2013). The other main relevant theme in the literature focuses on the longer-term impacts of the public finance structure on the level, or even the growth, of the economy, which can be referred to the ‘quality of public finance’ discussion (eg European Commission, 2012).
The composition of, and changes in, tax revenues have the greatest impact when taxes are paid.
Thereby, tax compliance and the broadness of tax bases are similarly important issues, as well as the effectiveness of public sector spending, which underpins all public sector actions.
In this paper I combine public finance structure and effectiveness issues, which can influence aggregate economic growth, with their impacts on the distribution of income. Striving for fairness in income distribution is crucial for societies to be stable and for citizens not to feel disenchanted. The concept of ‘inclusive growth’ provides a conceptual framework to analyse the social implications of economic growth. Growth is considered inclusive if it creates opportunities for all segments of the population and treats them fairly2. To understand inclusive growth, we must first understand inequality, which has two crucial categories. The first is the inequality of opportunity in access to education, jobs, healthcare, finance or the judicial system, for example. The second is inequality of outcomes, such as income, wealth, health and educational attainment.
While the level of income inequality in European Union (EU) countries is generally lower than in other advanced and emerging countries, there are large differences between EU member states and recent changes in the income distribution cannot always be regarded as ‘fair’. For example, as Darvas (2019) showed, the very rich in Bulgaria doubled their real incomes from the mid- 2000s to the mid-2010s, while the poorest five percent of the society benefitted from only a 20 percent increase – and from much lower levels. In contrast, in Germany, the poorest five percent benefitted from faster income growth than the richest five percent during the same period. I therefore also consider the reasons why income distribution developments matter, and how public finance structure decisions can influence the distribution of income.
Section 2 highlights the importance of fair distribution of income. Section 3 scrutinises the diversity of fiscal structures of EU member states. Section 4 surveys the literature on the growth and distributional impacts of public spending and tax decisions. Section 5 offers three concluding remarks.
2 https://www.oecd.org/inclusive-growth/.
2. Why does the fair distribution of income matter?
In our reading of the vast academic literature (see Darvas and Wolff, 2016), the main reason for the importance of a fair income distribution is not its impact on long-term economic growth.
The literature about the impact of income inequality on long-term growth is inconclusive.
About half of the studies we surveyed concluded that income inequality reduces economic growth, but about a quarter of the works concluded that it is in fact good for growth, while another quarter concluded that the impact is not significant. These varying results originate not just from different methodologies and empirical samples, but also from theories, which make diverse predictions about the impact of income inequality on growth.
Greater inequality and financial market imperfections might reduce the capacity of low-income households to invest in education, lowering economic growth (Galor and Zeira, 1993). Under- investment in human capital by poorer segments of society might reduce social mobility and adequate allocation of talent across occupations (Banerjee and Newman, 1993; Fershtman et al, 1996; Owen and Weil, 1998). Greater inequality might also reduce growth if it leads to political instability and social unrest (Alesina and Perotti, 1996; Keefer and Knack, 2002). If inequality becomes unacceptable for voters, they might insist on higher taxation and regulation and mistrust businesses, reducing incentives to invest (Bertola, 1993; Alesina and Rodrick, 1994).
On the other hand, greater inequality could increase growth if it provides incentives to work harder and take risks in order to capitalise on high rates of return (Mirrlees, 1971). Large differences in rates of return for education might encourage more people to seek education.
Greater inequality could foster aggregate savings and capital accumulation, because the rich save relatively more (Kaldor, 1957; Bourguignon, 1981). Fuentes and Leamer (2019) provided theory and evidence that worker effort played a major role in the increase in income inequality in the United States between 1980 and 2016.
These inconclusive theoretical predictions and empirical results do not allow a firm conclusion to be drawn on the impact of income inequality on economic growth3. But there are several other economic, social and political issues which imply that high levels of income inequality should be avoided.
Among economic issues, a high level of inequality might lead households to rely on debt financing to maintain living standards, a factor that might have been a significant driver of the housing boom in the pre-crisis period in the US, and the consequent bust (Rajan, 2011; Van
3 There are also some works that can rationalise the diverging empirical results on, and theoretical predictions about, the relationship between income inequality and economic growth (or economic efficiency). For example, Anderson and Maibom (2016) found that countries at the frontier of economic performance and income equality face a trade-off between efficiency and equity, but most countries are behind the frontier and therefore they can improve both. Aghion et al (2015) found a significant positive correlation between top income inequality and growth in those US states that are close to the most productive US state (‘frontier growth’), but negative correlation between top income inequality and non-frontier growth.
Treeck, 2014). Greater inequality could reduce the level and duration of periods of growth (Berg et al, 2018), and could also be linked to greater financial instability (Skott, 2013;
Vandemoortele, 2009). For the euro area, Darvas and Wolff (2014) showed that in countries with greater inequality, households tended to borrow more prior to the crisis, resulting in more subdued consumption growth during the crisis. The resulting high private debt, high
unemployment, poverty and more limited access to education have undermined long-term growth and social and political stability.
Perhaps the most important reason for a political goal of reducing income inequality is that higher inequality is found to be associated with less inter-generational (or social) mobility: the children of poor families tend to stay poor, while the children of rich families tend to stay rich (Corak, 2013; Andrews and Leigh, 2009)4. That is, greater inequality tends to be associated with a greater likelihood that economic advantage/disadvantage will be passed from parents to their children. By studying wealth inequality in Europe, Darvas and Midões (forthcoming) found that the average gain in wealth due to inheritance is greater than the gain associated with having a university degree instead of primary school education, highlighting the crucial role of family background and that education might not fully compensate for that. While ‘fairness’ is a complex concept, whatever definition is adopted, it cannot be regarded as ‘fair’ that two persons reach different outcomes when they have the same talents and make the same effort, just because of their different family backgrounds. Inequality arising from different levels of effort or luck should be welcomed, but inequality from unequal opportunity is not.
High income inequality can also influence politics by boosting protest votes in referendums and elections
.
Darvas (2016) concluded that income inequality boosted the vote for Brexit in the UK’s EU membership referendum in June 2016. Darvas and Efstathou (2016) concluded that income inequality boosted the vote for Donald Trump in the 2016 US presidential election5. These results can be regarded as protest votes against the status quo, with profound political implications.3. The diversity of fiscal structures in EU member states
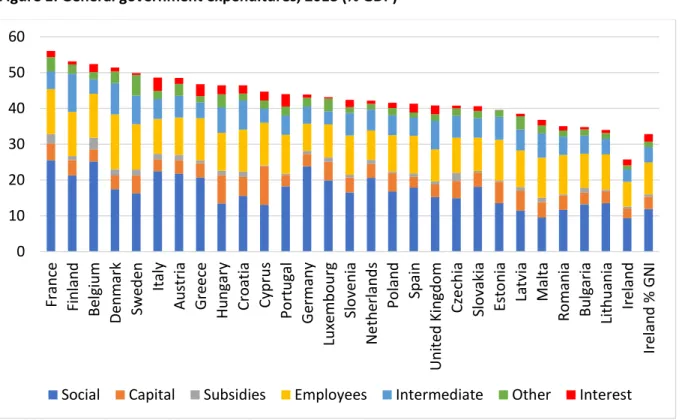
There is a great variation both in the size and the composition of general government budgets in the EU (Figure 1). The size in 2018 varied between 26 percent of GDP in Ireland6 to 56
4 For example, in some Nordic countries (Finland, Denmark, Norway), where income inequality is relatively low, social mobility is relatively high. In contrast, in countries where income inequality is relatively high (Italy, United Kingdom, United States), social mobility is relatively low. While there are differences in intergenerational mobility in different regions in each country, Bratberg et al (2016) found that the most socially-mobile region in the US is substantially less socially mobile than the least mobile regions of Norway and Sweden.
5 These studies on the Brexit and Trump votes controlled for various other factors influencing voters, including age, education, income, unemployment, location, immigration and race.
6 Irish GDP is significantly increased by profits of foreign companies booked in Ireland. Therefore the last column of Figure 1 shows spending as a share of GNI in Ireland, which is 33 percent, still the lowest among EU countries.
percent of GDP in France, while the EU average was 43 percent. Social spending relative to GDP is particularly high in France, Belgium and Germany, but rather low in Ireland, Malta, Latvia and Romania. Gross investment as a share of GDP is by far highest in Cyprus and Hungary, but low in Ireland, Spain and Portugal. Belgium and France provide the most subsidies relative to GDP, while the compensation of public sector employees is clearly highest in Denmark, followed by Sweden, France, Finland and Belgium. Irish, German and Dutch public sector employees receive the least as a share of GDP. These large differences likely reflect different societal preferences for the size of public sector and corresponding tax rates.
Interest spending relative to GDP is highest in Italy, followed by Portugal, Greece7 and
Hungary. Estonia hardly pays any interest due to its very low public debt level (gross public debt was only 8 percent of GDP in 2018). Sweden and Luxembourg also pay less than half a percent of GDP for interest, and there are seven countries that pay between half and one percent of GDP.
Figure 1: General government expenditures, 2018 (% GDP)
Source: Bruegel based on the AMECO dataset, May 2019.
Note: All values are expressed as % GDP, except the last column, which shows % GNI values for Ireland, a country in which GDP is significantly boosted by profits of foreign companies. ‘Social’ is composed of ‘Social benefits other
7 The data reported correspond to accrual accounting, but on a cash-flow basis, Greece pays much lower interest, because most of the interest due on European Financial stability Facility (EFSF) loans has been deferred and the accumulated value of that deferred interest will be added to the stock of outstanding public debt in 2022.
0 10 20 30 40 50 60
France Finland Belgium Denmark Sweden Italy Austria Greece Hungary Croatia Cyprus Portugal Germany Luxembourg Slovenia Netherlands Poland Spain United Kingdom Czechia Slovakia Estonia Latvia Malta Romania Bulgaria Lithuania Ireland Ireland % GNI
Social Capital Subsidies Employees Intermediate Other Interest
than social transfers in kind’ and ‘Social transfers in kind supplied to households via market producers’; ‘Capital’
includes ‘Gross fixed capital formation’ and ‘Other capital expenditure, including capital transfers’; ‘Employees’
refer to ‘Compensation of employees’; ‘Intermediate’ refers to ‘Intermediate consumption’; ‘Other’ refers to ‘Other current expenditure’; ‘Interest’ refer to the interest paid by the general government on public debt.
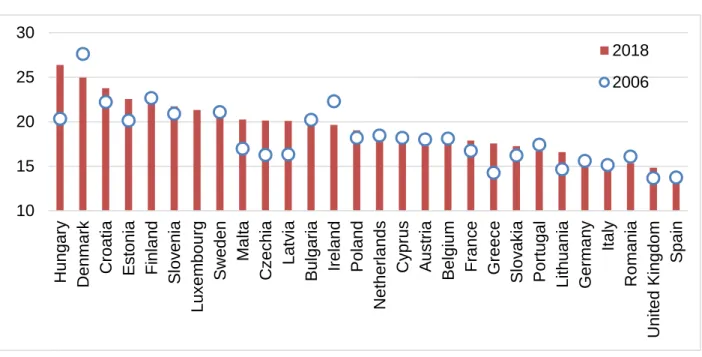
There are also huge differences in tax rates across the EU. The so-called ‘implicit tax’ rate measures the effective average tax rate, and thereby incorporates the impacts of tax rates and the broadness of the tax base, including various exemptions. The differences in consumption tax rates (Figure 2), labour tax rates (Figure 3), corporate income tax rates (Figure 4) and environmental tax rates (Figure 5) are enormous. In 2018, the implicit consumption tax ranged from 14 percent in Spain to 26 percent in Hungary, labour taxes (including social security contributions paid by both the employer and the employee) ranged from 25 percent in Bulgaria to 44 percent in Slovakia, while energy taxes are three-times higher in Denmark and Italy than in Hungary, Bulgaria and Lithuania. The effective corporate income tax rate is at or below 10 percent in the three Baltic countries, Cyprus, Luxembourg, Hungary, the Netherlands and Ireland, while it is over 35 percent in France.
Low corporate taxation, along with lenient regulation, might create conditions similar to tax havens even within the European Union. By taking a data-driven approach to identify offshore financial centres (OFCs), based on a dataset covering global corporate ownership networks, in which over 98 million firms are connected through 71 million ownership relationships, Garcia- Bernardo et al (2017) concluded that the Netherlands and Ireland (along with the United Kingdom, Switzerland and Singapore) are conduit-OFCs, which are attractive intermediate destinations in the routing of international investments and enable the transfer of capital without taxation. They also found that Luxembourg and Cyprus (along with Malta and 21 non- EU countries) are sink-OFCs, which attract and retain foreign capital via low taxation and lenient regulation.
Figure 2: Implicit tax rate on consumption, 2006 and 2018 (%)
Source: Bruegel based on European Commission, data on taxation,
https://ec.europa.eu/taxation_customs/business/economic-analysis-taxation/data-taxation_en
Note: The implicit tax rate on consumption is defined as all consumption taxes divided by the final consumption expenditure of private households on the economic territory (domestic concept).
Figure 3: Implicit tax rate on labour, 2006 and 2018 (%)
Source: Bruegel based on European Commission, data on taxation,
https://ec.europa.eu/taxation_customs/business/economic-analysis-taxation/data-taxation_en 10
15 20 25 30
Hungary Denmark Croatia Estonia Finland Slovenia Luxembourg Sweden Malta Czechia Latvia Bulgaria Ireland Poland Netherlands Cyprus Austria Belgium France Greece Slovakia Portugal Lithuania Germany Italy Romania United Kingdom Spain
2018 2006
20 25 30 35 40 45
Slovakia Greece Italy Austria Belgium France Czechia Sweden Finland Hungary Germany Slovenia Denmark Spain Poland Netherlands Estonia Ireland Lithuania Luxembourg Croatia Romania Portugal Latvia Cyprus Malta United Kingdom Bulgaria
2018 2006
Note: The implicit tax rate on labour is defined as the sum of all direct and indirect taxes and employees’ and employers’ social contributions levied on employed labour income divided by the total compensation of employees.
It is calculated for employed labour only (so excluding the tax burden falling on social transfers, including pensions).
Figure 4: Implicit tax rate on corporate income, 2006 and 2018 (%)
Source: Bruegel based on European Commission, data on taxation,
https://ec.europa.eu/taxation_customs/business/economic-analysis-taxation/data-taxation_en Note: The implicit tax rate on corporate income is defined as the ratio between revenue from taxes on income/profits of corporations (including holding gains) and all taxable capital and business income of
corporations. The numerator comprises taxes raised on corporate income and the denominator is defined as the sum of the net operating surplus and property income balance of the corporate sector. A full definition and description of the methodology can be found in Annex B of European Commission (2018b). This indicator is called the ‘traditional’ version by European Commission (2018b). There is an alternative ‘no dividends’ version of this indicator, which excludes all dividends from the denominator, due to the widespread tax exemption of received dividends.
0 5 10 15 20 25 30 35 40
France Portugal Belgium Czechia Sweden United Kingdom Germany Slovenia Slovakia Denmark Austria Greece Italy Spain Finland Poland Romania Bulgaria Ireland Netherlands Estonia Hungary Luxembourg Latvia Cyprus Lithuania
2018 2006
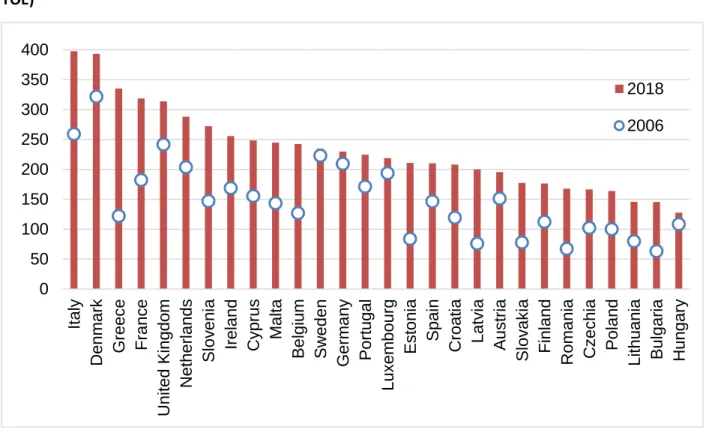
Figure 5: Implicit tax rate on energy, 2006 and 2018 (energy taxes in euro per tonne of oil equivalent – TOE)
Source: Bruegel based on European Commission, data on taxation,
https://ec.europa.eu/taxation_customs/business/economic-analysis-taxation/data-taxation_en
Note: This indicator is defined as the ratio between energy tax revenues and final energy consumption calculated for a calendar year. Energy tax revenues are measured in euro and the final energy consumption as TOE (tonnes of oil equivalent).
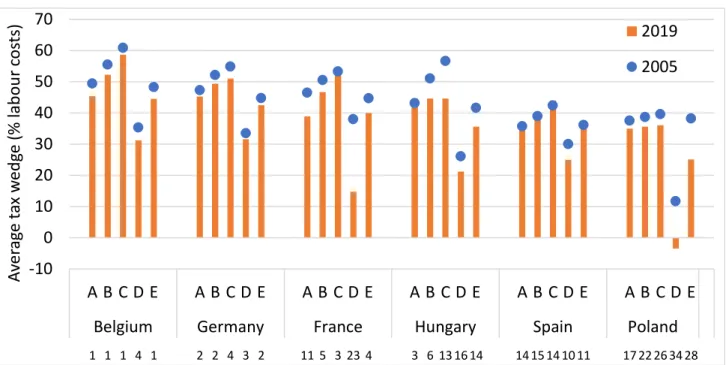
Since my focus is also on the income distribution implications of public spending and tax decisions, I look at labour taxes for different type of earners based on their income, family status and number of children (Figure 6). The tax wedge is a measure of the taxes on labour income (including social security contributions) paid by employees and employers, minus family benefits received, as a percentage of the labour costs of the employer. The columns A, B and C in Figure 6 compare the tax wedge for single persons without a child at 67 percent, 100 percent and 167 percent of average earnings, respectively. Among the six countries included on the chart, in 2019 the tax wedge was progressive in Belgium, France, Germany and Spain, it was almost flat in Poland and perfectly flat in Hungary. Having two children reduces the tax wedge in all countries, which can be seen by comparing column D (single person at 67 percent of average earnings, with two children) with column A (single person at 67 percent of average earnings, no child). The reduction is especially stark in Poland, when a single person at 67 percent of average earning with two children benefits from a negative tax wedge, implying that family benefits received are larger than taxes and social security contributions paid.
0 50 100 150 200 250 300 350 400
Italy Denmark Greece France United Kingdom Netherlands Slovenia Ireland Cyprus Malta Belgium Sweden Germany Portugal Luxembourg Estonia Spain Croatia Latvia Austria Slovakia Finland Romania Czechia Poland Lithuania Bulgaria Hungary
2018 2006
The changes since 2005 suggest a general reduction in tax wedges for almost all categories reported on the chart, with the exception of low earners in Hungary, who faced a higher tax wedge in 2019 than in 2005. The Hungarian data also shows that Hungary has changed
progressive income taxes to flat taxes, which has particularly benefitted higher-income earners.
Figure 6: Tax wedge of different earners, 2005 and 2019
Source: Bruegel based on OECD Taxing Wages Dataset, https://stats.oecd.org/Index.aspx?DataSetCode=AWCOMP.
Note: The tax wedge is a measure of the taxes on labour income paid by employees and employers, minus family benefits received, as a percentage of the labour costs of the employer. A - Single person at 67% of average earnings, no child; B - Single person at 100% of average earnings, no child; C - Single person at 167% of average earnings, no child; D - Single person at 67% of average earnings, with two children; E - Two-earner married couple, one at 100% of average earnings and the other at 67%, 2 children. The numbers below the country names indicate the rank among 36 countries in 2019 for each of the earner categories (low number = high tax wedge).
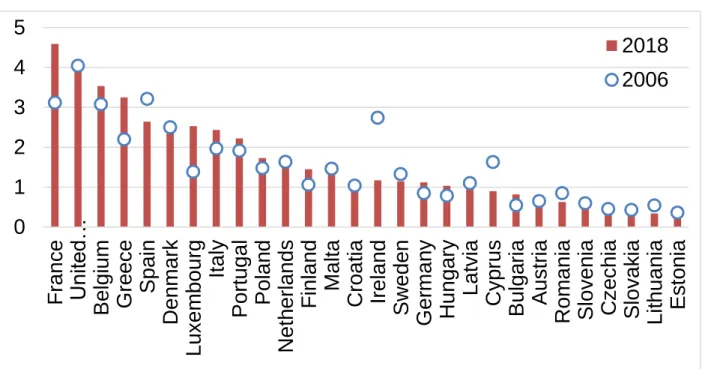
Finally, I look at the taxation of property. Unfortunately, the implicit tax rate on property is not calculated, probably due to the difficulties in measuring the value of property, so I report the share of property tax revenue in GDP (Figure 7). There are again major differences between EU countries. France and the UK collect about 4.5 percent of GDP in property taxes, closely
followed by Belgium and Greece, while in 16 EU countries the revenue amount to 1.2 percent of GDP or less.
1 1 1 4 1 2 2 4 3 2 11 5 3 23 4 3 6 13 16 14 14 15 14 10 11 17 22 26 34 28
-10 0 10 20 30 40 50 60 70
A B C D E A B C D E A B C D E A B C D E A B C D E A B C D E
Belgium Germany France Hungary Spain Poland
Average tax wedge (% labour costs) 2019
2005
Figure 7: Property tax revenue, 2006 and 2018 (% GDP)
Source: Bruegel based on European Commission, data on taxation,
https://ec.europa.eu/taxation_customs/business/economic-analysis-taxation/data-taxation_en
The large variation in public expenditure and revenue structures might reflect societal preferences. Nevertheless, whatever amount is collected by the public sector, it should be spent efficiently. Sapir (2006) argued that the efficiency of the Mediterranean social model is low and at the same time inequality levels are high. Darvas and Wolff (2014) corroborated this finding by showing that most Mediterranean countries, and also some central and eastern European and some western European countries, achieve comparatively lower reductions of income inequality for any given amount of social expenditure and for a given level of average personal income taxes. For example, the share of social expenditure in GDP is similar in Greece, Italy and Finland, but while the Finnish system was able to reduce income-inequality of pre- redistribution gross incomes by more than 45 percent, the Italian and Greek systems reduced it only by 30 percent8. For countries with less efficient redistribution systems, a reform of the social model would therefore appear to be a promising avenue. It could reduce substantially income inequality with the same level of government spending and taxation, or reduce
government spending and taxation without increasing income inequality. For example, Vtyurina (2020) analysed spending reviews for Spain and reported that about 80 percent of family
benefits are not means-tested9, implying that more well-off households receive a substantial
8 A caveat is that some social spending might not be targeted at reducing income inequality, but rather at pursuing other social goals.
9 Means-tested social benefits refer to benefits where entitlement is explicitly or implicitly conditional on the beneficiary's income/wealth.
0 1 2 3 4 5
F ranc e U nit ed… Belgi um Gre ec e Spain D enm ark Lux em bourg It aly Port ugal Polan d N et h erlands F inland Malt a C roat ia Ireland Sw eden Ger m an y H ungary Lat v ia C y p rus Bulga ria Aus tria R om ania Slov enia C z e c hia Slov ak ia Lit huania Es to nia
2018
2006
portion of the benefits. Furthermore, there are shortcomings in adequacy and coverage. Better targeting the most vulnerable would make Spanish social spending more effective.
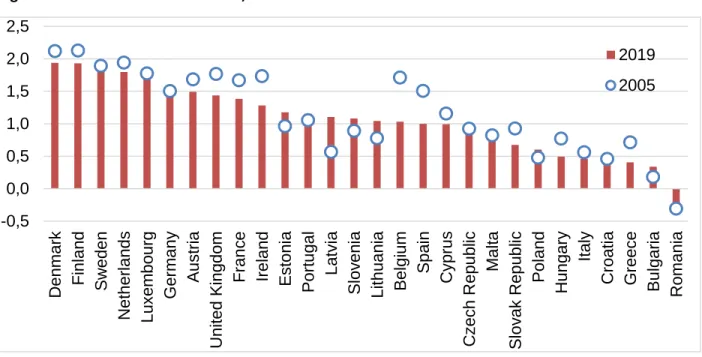
Last but not least, an effective government is indispensable for public-finance decisions to achieve their desired impact. While it is difficult to measure government effectiveness, the World Bank developed a useful indicator among its governance indicators. The indicator reflects perceptions of the quality of public services, the quality of the civil service and the degree of its independence from political pressures, the quality of policy formulation and implementation, and the credibility of the government's commitment to such policies. The indicator draws on various sources and is then standardised, so the world average is zero and the standard deviation is one. Figure 8 shows that all EU countries but Romania achieved a positive score, yet there are notable differences within the EU. The best performing countries include northern (Denmark, Finland, Sweden) and western (the Netherlands, Luxembourg, Germany) European countries, while the worst performers are from south and eastern Europe (Romania, Bulgaria, Greece, Italy, Hungary). Undoubtedly, southern and eastern EU countries should take decisive steps to improve their government effectiveness.
Figure 8: Government effectiveness, 2005 and 2019
Source: Bruegel based on World Bank Worldwide Governance Indicators, https://info.worldbank.org/governance/wgi/.
4. Growth and distributional impacts of fiscal structures
After reviewing the large variety of public spending and taxing practices across EU countries, I now scrutinise the academic literature on the growth and income distribution implications of
-0,5 0,0 0,5 1,0 1,5 2,0 2,5
Denmark Finland Sweden Netherlands Luxembourg Germany Austria United Kingdom France Ireland Estonia Portugal Latvia Slovenia Lithuania Belgium Spain Cyprus Czech Republic Malta Slovak Republic Poland Hungary Italy Croatia Greece Bulgaria Romania
2019 2005
public spending and revenue decisions. There has been wide-ranging research on this topic, which is not always conclusive.
A meta-analysis of 42 studies on the impact of taxes on economic growth in Organisation for Economic Co-operation and Development countries by Alinaghi and Reed (2018) supports the prediction of theories: tax policies predicted by growth theory to be growth-retarding, such as the use of distortionary taxes to fund unproductive expenditures, are significantly associated with lower economic growth, while tax polices predicted to be growth-enhancing, such as the use of non-distortionary taxes to fund productive expenditures, are significantly associated with higher economic growth10.
As regards distortionary/non-distortionary taxes and productive/unproductive expenditures, Alinaghi and Reed (2018) adopted the classification of Kneller et al (1999). Those taxes are considered distortionary, with effects on the investment decisions of agents (with respect to physical and/or human capital), creating tax wedges and hence distorting the steady-state rate of growth. Non-distortionary taxation does not affect saving/investment decisions because of the assumed nature of the preference function, and hence has no effect on the rate of growth.
In this classification, distortionary taxes are the various kinds of taxes and social security contributions on income and profit, as well as taxes on property, while consumption taxes are classified as non-distortionary.
Those public expenditures are considered productive which directly or indirectly influence the production of private firms and thereby affect the steady-state rate of growth. If they are not then they are classified as unproductive expenditures. Within this classification, productive public expenditures include general public services, defence, education, health, housing, transport and communication, while unproductive expenditures include social security and welfare expenditure, recreation and economic services.
However, as noted by Alinaghi and Reed (2018), in practice, no tax is truly non-distortionary, so the distinction hinges on the degree to which the allocation of resources is affected. Similarly, there cannot be a clear dividing line between productive and unproductive expenditure. For example, social safety net spending to preserve or even enhance the human capital of
unemployed people should boost growth, while, for example, more spending on public services might not necessarily improve the efficiency of public administration and thereby cannot be regarded as unambiguously productive.
As regards redistribution, which is related to the size of public budgets, earlier literature typically concluded that more redistribution and larger public budgets are detrimental to economic growth, because higher taxes and subsides reduce the incentives to work and invest (Okun, 1975). More recently, Jaimovich and Rebelo (2017) concluded that low tax rates have a
10 Alinaghi and Reed (2018) also reported a publication bias in results, whereby there is a preference for estimates that are significant, and/or that accord with theoretical or ideological predispositions in published articles. They corrected for this bias.
very small impact on long-run growth rates, but as tax rates rise, their negative impact on growth rises dramatically.
Berg et al (2018) questioned these views. They concluded that fiscal redistribution, unless it is extreme, may be a win-win policy because of its equality-inducing effects. They do find some mixed evidence that very large-scale redistribution may have direct negative effects on growth duration, but for non-extreme redistributions, there is no evidence of any adverse direct effect.
A comprehensive study by Cournède et al (2018) presented a very useful analysis of both the growth and distributional impacts of public finance decisions. They considered both the direct impacts (eg change in a certain tax rate) and indirect impacts (behavioural change because of the change in a tax rate) of such decisions. In order to provide comparable scenarios, they considered fiscally-neutral changes, such as raising a certain tax rate while cutting all other tax rates proportionally. They presented econometric estimates for the effects of public finance structure on real output per capita and the distribution of real household disposable income, which were then combined in simulations to quantify disposable income impacts for each income decile group. Some of their most interesting findings were the following:
• Boosts growth and reduces income inequality: lower tax wedge on low-income earners, higher inheritance and gift taxes, greater government effectiveness;
• Boosts growth, while no significant impact on income inequality: higher public
investment, lower public pension expenditure, higher recurrent property taxes, higher quality education, lower corporate income tax;
• Boosts growth and widens income inequality: lower total public spending, lower public subsidies, lower wealth taxes, lower labour tax wedge on above-average income earners;
• No growth impact but reduces income inequality: higher child and family benefits11, lower environment taxes; however, shifting taxation away from low-paid labour towards environmental taxes can generate economic and distributional benefits, and improve the environment;
• No major impact: value added tax.
Cournède et al (2018) also noted that there are limits to the reallocation of the tax burden from more towards less distortive taxes such as value-added taxes. Many European countries seem close to the point where higher rates reduce revenue by generating significant economic distortions and strong disincentives for compliance. Broadening the tax base and improving collection should be favoured instead.
11 European Commission (2018a, Part III) also concluded that education and health spending, as well as sickness, disability, family and child benefits, significantly reduced income inequality in the EU on average from 1980 to 2014.
The need for progressive taxes was also supported by Diamond and Saez (2011), who critically assessed the academic research on optimal taxation. Their three main conclusions are: first, very high earners should be subject to high and rising marginal tax rates on earnings; second, low-income families should be encouraged to work with earnings subsidies, which should then be phased-out with high implicit marginal tax rates; and third, capital income should be taxed.
The case for inheritance taxes in a theoretical optimal taxation framework was made by Piketty and Saez (2013), who concluded that the optimal tax rate is positive and quantitatively large if the elasticity of bequests to the tax rate is low, bequest concentration is high, and society cares mostly about those receiving little inheritance. In contrast, the optimal tax rate can be negative when society cares mostly about inheritors.
5. Concluding remarks
Instead of a detailed summary, let me close with three key take-aways.
First, public finance structure and effectiveness matter for economic growth and income inequality. The literature provides useful guidelines on the most growth- and equality-friendly composition of taxes and expenditure, and emphasises the need to broaden taxes bases and improve tax compliance.
Second, EU countries have very diverse public finance structures and different levels of effectiveness. While each country’s situation should be analysed considering its special circumstances, there is room for improvement in terms of the growth and equality impacts in all countries. A general guideline would be that there should be progressive taxes and
inheritance taxes, spending on education, health and public infrastructure, and better government effectiveness.
Third, despite the conclusions of academic research, at the height of the 2008 global crisis and the subsequent European financial and economic crises, the fiscal consolidation strategies of EU countries largely relied on cutting public investment and social spending, except pensions (see Darvas and Wolff, 2016), thereby worsening both the growth outlook and income inequality.
Better fiscal rules and good fiscal institutions are needed to safeguard growth- and distribution- friendly expenditures in a crisis.
References
Aghion, Philippe, Ufuk Akcigit, Antonin Bergeaud, Richard Blundell and David Hemous (2015)
‘Innovation, income inequality, and social mobility’, 28 July, VOX – CEPR’s Policy Portal, available at: https://voxeu.org/article/innovation-income-inequality-and-social-mobility
Alesina, Alberto and Roberto Perotti (1996) ‘Income distribution, political instability, and investment’, European Economic Review 40.6, 1203-1228, available at:
https://doi.org/10.1016/0014-2921(95)00030-5
Alesina, Alberto and Dani Rodrik (1994) ‘Distributive politics and economic growth’, The Quarterly Journal of Economics 109(2), 465-490, available at:
https://www.jstor.org/stable/2118470
Alinaghi, Nazila and W. Robert Reed (2018) ‘Taxes and economic growth in OECD countries: a meta-analysis’, Working Papers in Economics 18/09, University of Canterbury, Department of Economics and Finance, available at:
http://www.econ.canterbury.ac.nz/RePEc/cbt/econwp/1809.pdf
Anderson, Torben M. and Jonas Maibom (2016) ‘The trade-off between efficiency and equity’, 29 May, VOX – CEPR’s Policy Portal, available at: https://voxeu.org/article/trade-between- efficiency-and-equity
Andrews, Dan and Andrew Leigh (2009) ‘More inequality, less social mobility’, Applied Economics Letters 16(15), 1489-1492, available at:
https://doi.org/10.1080/13504850701720197
Auerbach, Alan J. and Yuriy Gorodnichenko (2012) ‘Measuring the output responses to fiscal policy’, American Economic Journal: Economic Policy 4(2), 1–27, available at:
https://www.aeaweb.org/articles?id=10.1257/pol.4.2.1
Banerjee, Abhijit V. and Andrew F. Newman (1993) ‘Occupational choice and the process of development’, Journal of Political Economy 101(2), 274-298, available at:
https://www.jstor.org/stable/2138820
Barrios, Salvador and Andrea Schaechter (2008) ‘The quality of public finances and economic growth’, Economic Papers 33, Directorate-General for Economic and Financial Affairs, European Commission, available at:
https://ec.europa.eu/economy_finance/publications/pages/publication13101_en.pdf Barro, Robert J. (1990) ‘Government spending in a simple model of endogenous growth’, Journal of Political Economy 98(5), 103–125, available at: https://doi.org/10.1086/261726 Berg, Andrew, Jonathan D. Ostry, Charalambos G. Tsangarides and Yorbol Yakhshilikov (2018)
‘Redistribution, inequality, and growth: new evidence’, Journal of Economic Growth 23(3), 259- 305, available at: https://link.springer.com/article/10.1007%2Fs10887-017-9150-2
Bertola, Giuseppe (1993) ‘Factor shares and savings in endogenous growth’, The American Economic Review 83(5), 1184-1198, available at: https://www.jstor.org/stable/2117555
Blanchard, Olivier J. and Daniel Leigh (2013) ‘Growth forecast errors and fiscal multipliers’, American Economic Review, vol. 103(3), pages 117-20, available at:
https://www.aeaweb.org/articles?id=10.1257/aer.103.3.117
Bourguignon, Francois (1981) ‘Pareto superiority of unegalitarian equilibria in Stiglitz’ model of wealth distribution with convex saving function’, Econometrica 49(6), 1469-1475, available at:
https://www.econometricsociety.org/publications/econometrica/1981/11/01/pareto- superiority-unegalitarian-equilibria-stiglitz-model
Bratberg, Espen, Jonathan Davis, Bhashkar Mazumder, K. Vaage, M. Nybom and D. Schnitzlein (2016) ‘A comparison of intergenerational mobility curves in Germany, Norway, Sweden and the US’, The Scandinavian Journal of Economics 119(1), 72-101, available at:
https://doi.org/10.1111/sjoe.12197
Corak, Miles (2013) ‘Income inequality, equality of opportunity, and intergenerational mobility’, The Journal of Economic Perspectives 27(3), 79-102, available at:
https://www.aeaweb.org/articles?id=10.1257/jep.27.3.79
Cournède, Boris, Jean-Marc Fournier and Peter Hoeller (2018) ‘Public finance structure and inclusive growth’, OECD Economic Policy Paper 2018/25, available at: https://www.oecd- ilibrary.org/economics/public-finance-structure-and-inclusive-growth_e99683b5-en Darvas, Zsolt (2016) ‘Brexit vote boosts case for inclusive growth’, 13 July, Bruegel blog, available at: https://bruegel.org/2016/07/brexit-vote-boosts-case-for-inclusive-growth/
Darvas, Zsolt (2019) ‘EU enlargement 15th anniversary: upward steps on the income ladder’, 30 April, Bruegel blog, available at: http://bruegel.org/2019/04/eu-enlargement-15th-anniversary- upward-steps-on-the-income-ladder/
Darvas, Zsolt and Catarina Midões (forthcoming) ‘Wealth distribution and social mobility’, Research report, Eurofound
Darvas, Zsolt and Guntram B. Wolff (2014) ‘Europe's social problem and its implications for economic growth’, Policy Brief 2014/03, Bruegel, available at:
https://bruegel.org/2014/03/europes-social-problem-and-its-implications-for-economic- growth/
Darvas, Zsolt and Guntram B. Wolff (2016) ‘An anatomy of inclusive growth in Europe’, Blueprint 26, Bruegel available at: https://bruegel.org/2016/10/an-anatomy-of-inclusive- growth-in-europe/
Darvas, Zsolt and Konstantinos Efstathou (2016) ‘Income inequality boosted Trump vote’, 9 November, Bruegel blog, available at: https://bruegel.org/2016/11/income-inequality-boosted- trump-vote/
Diamond, Peter and Emmanuel Saez (2011) ‘The case for a progressive tax: from basic research to policy recommendations’, Journal of Economic Perspectives 25(4), 165-190, available at:
https://www.aeaweb.org/articles?id=10.1257/jep.25.4.165
European Commission (2012) ‘The quality of public expenditures in the EU’, Occasional Papers 125, Directorate-General for Economic and Financial Affairs, European Commission, available at:
https://ec.europa.eu/economy_finance/publications/occasional_paper/2012/op125_en.htm European Commission (2018a) 'Report on Public Finances in EMU 2017’, Institutional Paper 069, available at: https://ec.europa.eu/info/publications/economy-finance/report-public- finances-emu-2017_en
European Commission (2018b) 'Taxation trends in the European Union',
https://ec.europa.eu/taxation_customs/sites/taxation/files/taxation_trends_report_2018.pdf Fershtman, Chaim, Kevin M. Murphy and Yoram Weiss (1996) ‘Social status, education, and growth’, Journal of Political Economy 104(1), 108-132, available at:
https://www.jstor.org/stable/2138961
Fuentes, J. Rodrigo and Edward E. Leamer (2019) ‘Effort: the unrecognized contributor to US income inequality’, Working Paper No. 26421, National Bureau of Economic Research, available at: https://www.nber.org/papers/w26421
Galor, Oded and Joseph Zeira (1993) ‘Income distribution and macroeconomics’, The Review of Economic Studies 60(1), 35-52, available at: https://www.jstor.org/stable/2297811
Garcia-Bernardo, Javier, Jan Fichtner, Frank W. Takes and Eelke M. Heemskerk (2017)
‘Uncovering offshore financial centers: conduits and sinks in the global corporate ownership network’, Nature, Scientific Reports 7, Article number: 6246, available at
https://www.nature.com/articles/s41598-017-06322-9
Jaimovich, Nir and Sergio Rebelo (2017) ‘Nonlinear effects of taxation on growth’, Journal of Political Economy 125(1),
Kaldor, Nicholas (1957) ‘A model of economic growth’, The Economic Journal 67(268), 591-624, available at: https://doi.org/10.2307/2227704
Keefer, Philip and Stephen Knack (2002) ‘Polarization, politics and property rights: links between inequality and growth’, Public Choice 111(1-2), 127-154, available at:
https://link.springer.com/article/10.1023/A:1015168000336
Kneller, Richard, Michael F. Bleaney and Norman Gemmell (1999) ‘Fiscal policy and growth:
evidence from OECD countries’, Journal of Public Economics 74(2), 171-190, available at:
https://doi.org/10.1016/S0047-2727(99)00022-5
Mirrlees, James A. (1971) ‘An exploration in the theory of optimum income taxation’, The
Review of Economic Studies 38(2), 175-208, available at: https://www.jstor.org/stable/2296779 Okun, A. M. (1975). Equality and efficiency: The big trade-off. Washington: Brookings Institution Press, available at: https://www.jstor.org/stable/10.7864/j.ctt13wztjk
Owen, Ann L. and David N. Weil (1998) ‘Intergenerational earnings mobility, inequality and growth’, Journal of Monetary Economics 41(1), 71-104, available at:
https://doi.org/10.1016/S0304-3932(97)00067-6
Piketty, Thomas and Emmanuel Saez (2013) ‘A theory of optimal inheritance taxation’, Econometrica 81(5), 1851-1886, available at: https://doi.org/10.3982/ECTA10712
Rajan, Raghuram G. (2011) ‘Fault lines: how hidden fractures still threaten the world economy’, Princeton University Press, available at:
https://press.princeton.edu/books/paperback/9780691152639/fault-lines
Sapir, André (2006) ‘Globalization and the reform of the European social model’, Journal of Common Market Studies 44(2), p. 369-390, available at: https://doi.org/10.1111/j.1468- 5965.2006.00627.x
Skott, Peter (2013) ‘Increasing inequality and financial instability’, Review of Radical Political Economics 45(4), 478-488, available at: https://doi.org/10.1177/0486613412475188
Van Treeck, Till (2014) ‘Did inequality cause the US financial crisis?’ Journal of Economic Surveys, 28(3) 421-448, available at:
https://onlinelibrary.wiley.com/doi/full/10.1111/joes.12028
Vandemoortele, Milo (2009) ‘Within-country inequality, global imbalances and financial instability’, Overseas Development Institute Research Report, London, United Kingdom, https://www.odi.org/sites/odi.org.uk/files/odi-assets/publications-opinion-files/5066.pdf Vtyurina, Svetlana (2020) ‘Effectiveness and Equity in Social Spending - The Case of Spain’, Working Paper No. 20/16, International Monetary Fund, available at:
https://www.imf.org/en/Publications/WP/Issues/2020/01/30/Effectiveness-and-Equity-in- Social-Spending-The-Case-of-Spain-48936