Examination of Income Inequalities of Hungarian Households in 2012 Using a Microsimulation Model∗
Ilona Cserháti Head of Department
Office of Public Administration and Justice
ECOSTAT Division for Impact Assessment
E-mail: ilona.cserhati@kih.gov.hu
Tibor Keresztély Senior Councillor
Office of Public Administration and Justice
ECOSTAT Division for Impact Assessment
E-mail:
tibor.keresztely@kih.gov.hu
Tibor Takács Senior Councillor
Office of Public Administration and Justice
ECOSTAT Division for Impact Assessment
E-mail: tibor.takacs@kih.gov.hu
The paper estimates the distribution of income of the Hungarian households in 2012. Since the first sta- tistical data concerning the incomes of 2012 will be available only in 2014, the figures have been deter- mined by a microsimulation model. It ages the income data of the official Household Budget Survey (HBS) of 2010 published in 2012 by the Hungarian Central Sta- tistical Office. The early information on income distri- bution among different social strata is useful for both policy makers and for researchers. The HBS is a repre- sentative sample of households; therefore their weights have to be adjusted in every step of the microsimula- tion, assuring the best fit to already known macroeco- nomic data. This means that the model is dynamic al- though statically aged. The income inequalities are presented by income deciles, by the number of de- pendent children, by age structure of households, by activity status and by region and settlement types.
KEYWORDS: Income inequalities.
Microsimulation.
Household budget survey.
∗ The authors would like to express their gratitude to László Mihályffy, Statistical Key Advisor of the Hun- garian Central Statistical Office, who carried out the reweighting and also to István Molnár, Professor of Bloomsburg University (USA) for his very useful comments and suggestions. All errors are the authors’
alone.
T
he financial crisis that erupted at the end of 2008 had serious immediate effects on the Hungarian economy. The growth potential was relatively low in that year (about 2 percent) and the main indicators of the economic equilibrium were ex- tremely unfavourable. The debt of the general government had been already continu- ously increasing for the seven previous years, and by 2008 exceeded 70 percent of the GDP. It was then the fourth highest rate in the EU. In addition, foreign exchange reserves were relatively low, while the deficit of the current account balance ex- ceeded 7 percent of the GDP. Suddenly, the government could not finance itself from the market. The International Monetary Fund (IMF), the World Bank and the EU had to assure the necessary credits, the condition of which was the introduction of fiscal consolidation measures. Although these measures were necessary, they proved to be procyclical, leading to a negative growth of 6.7 percent in 2009. Meanwhile the Hungarian currency depreciated resulting in the decrease of disposable income of the household sector which had a high rate of foreign currency based mortgage loans.All these developments increased the inequalities of the different strata that were analysed in Cserháti–Takács [2010] by a microsimulation model. Further measures affecting the income distribution were taken in 2011–2012. A flat tax on the personal incomes has been introduced combined with a family tax benefit. At the same time, tax credit was decreased, and it will disappear starting from 2013. The new tax sys- tem may further increase income disparities. This was supported by the results of Cserháti and Takács [2011], which presented preliminary results for 2011. Espe- cially the reduction of the tax credit may have a negative effect in the lower income deciles. Employees in the government sector received compensation in 2011–2012 in order to prevent the decrease of nominal wages: this compensation had to be pro- vided for 56 percent of the state employees. Meanwhile, on the one hand, several measures have been taken to ease the indebtedness of the household sector. On the other hand, further austerity measures have been introduced to keep the deficit of the general government under 3 percent, since the flat rate could not boost the economy as it was expected. These developments have had also significant effect on the households. The main purpose of the present paper is to assess the distribution of the disposable income among different strata in 2012 using microsimulation.
There are several papers analysing the austerity measures dealing with this prob- lem. Agnello and Sousa [2011] examine the economic policy of 18 countries in the 1980–2010 period. The conclusion of the paper is that austerity measures increase social inequalities during the time of fiscal consolidation and the inequalities further grow after the adjustment period. Callan et al. [2011] examined six countries by mi-
crosimulation, and found that the austerity measures after the financial crisis may have different effects on income distribution, depending on the specific adjustment measures applied in the particular countries. Their research was based on the Euro- pean Union Statistics on Income and Living Conditions (EU-SILC
)
database, which contains only income data, that is, they could quantify only the effect of direct tax increases. Authors found that the distribution of burden shows a different picture, but if the effects of indirect taxes are taken into consideration, the adjustment measures put an onus especially on the low-income households. Similar results have been pre- sented in Callan et al. [2012], which simulates incomes for different types of fami- lies for 2012 by another microsimulation model. Matsaganis and Leventi [2011]found that the austerity measures introduced recently in Greece have only slightly in- creased inequalities. Belyó and Molnár [2006] investigated the opportunities of simu- lating the capital income for Hungarian data.
The ECOS-TAX to be presented is a microsimulation model, which was basically developed to analyse the impacts of the changes of direct taxes. Its preliminary ver- sion was developed in co-operation with the experts of the HCSO (Cserháti et al.
[2007]). Later, the model was further developed and applied for impact analyses (see for example Cserháti–Takács [2010], [2011]).
The structure of the paper is as follows. First, the methodology of research will be outlined in Section 1. The results of the model runs will be presented in Section 2, and finally the conclusions will be drawn in Section 3. The contribution of the paper to current scientific achievements is the quantification of expected income inequalities in Hungary in 2012. Income distribution processes which are one of most hotly debated economic policy issues in Hungary can be analyzed in real time by the model.
1. Methodology
The distribution of household incomes can be based on the information of the Household Budget Survey (HBS) published by the Hungarian Central Statistical Of- fice (HCSO). However, this survey has several disadvantages. On the one hand, the data normally underestimates the incomes, and on the other hand, it does not cover all elements of disposable incomes (that is, only the actually withdrawn interests are reported). Another problem is that the data are published only with more than a year delay. If decision makers wish to get a picture about the actual income distribution, the microsimulation seems to be a good tool. The HCSO and the National Employ- ment Service (NES) provide actual statistics on wages, but it is only a part of dispos-
able incomes and this information is not suitable for analysis of income distribution among different strata. However, with microsimulation, changes can be modelled on the level of the households, starting from the last available HBS data. These data contain very detailed information on the households and on the observed persons, therefore it is possible to determine special response functions for the particular households (practically for different groups of households). Then the actual effects of economic policy measures can be determined for different groups of households. In order to eliminate the former problems of the HBS information, the actual data have to be adjusted and/or completed by using external data sources. The method is suit- able for assessing the results of the previously introduced measures by simulating the case of the “no-measures” scenario, and the same is true for the evaluation of planned measures (Callan et al. [2011], [2012]).
1.1. Adjustment of weights
The ECOS-TAX is a static ageing dynamic microsimulation model, adjusting the weights of the observations. However, the weights of the households are ad- justed in each year of the examination in order to assure the optimal fit to the ag- gregated data published by the HCSO or by other authorities like NES. Such ad- justments are needed also for the starting year of the examination. At present, the HBS data of 2010 are already available. We note that integrated weights are ap- plied to the HBS data, that is, the weights of persons belonging to a certain house- hold equal to the weight of that household. There are certain incomes, which char- acterize the whole household and there are ones belonging to persons. The wage is a typical example of this latter type: it is followed therefore on the level of persons.
On the contrary, the taxable income is determined on the level of the family in or- der to take the family tax benefit into account. The ECOS-TAX follows the devel- opment of wages in a sophisticated way. The original weights of the HBS data were calculated primarily on the basis of demographic data, although some eco- nomic conditions were also taken into consideration. In our investigations eight groups of employees have been determined by the appropriate adjustment of weights. Employees in the government sphere, in the corporate sector and in non- profit institutions are distinguished, and also the fostered workers are treated sepa- rately. For each of these four groups, employees covered by the institutional wage statistics of the HCSO are separated from others. The weights have been recalcu- lated in such a way that the number of these groups should optimally fit the actual values of the labour statistics. Also the number of the unemployed is taken into ac- count. The recalculation of weights requires the solution of a nonlinear optimiza- tion problem (Éltető–Mihályffy [2002]).
1.2. Adjustment of data
Since the income data in the HBS are underestimated, it was necessary to correct the data, in particular the wages, on the basis of an external data source. Three types of data sources are available. Although the personal income tax database contains the data of all employees, it does not contain information on the duration of employment and does not distinguish employees according to institutional sectors. The institutional wage statistics of the HCSO is based on average wages (only one record characterizes every corporation), therefore it is less suitable for the examination of distribution. The wage survey of the NES contains information on full-time and part-time employment and also on the (government or corporate) sector. However, its main drawback is that it gives a picture for only about one month of the year. We have therefore chosen a spe- cial two-step method of wage adjustment. In the case of employees covered by the HCSO institutional wage statistics (full-time employees and corporations with at least 5 employees), the adjustment was based on the NES wage tariff data. In this first step it was ensured that the distribution among the deciles corresponds to that of the NES data. In the second step, both the HBS and the personal income tax data were grouped according to regions, age categories and income deciles. Then all the HBS wage data were multiplied by the multiplier of its particular group.
The pension is also underreported in the HBS, although it is a decisive part of the aggregate disposable income of the household sector. We started from the aggregated value of pension in the starting year (in 2010), which is published by the HCSO (STADAT system). The HBS data were adjusted in such a way that the pension per capita value corresponded to the value of the STADAT.
One of the most serious drawbacks of the HBS is that it has very little information on property incomes. Even in the case of interest incomes, only the actually withdrawn interests are reported, which is probably underestimated. Nor does the personal income tax data provide any information about it, since the tax on interest is paid by the finan- cial institution directly. Therefore, we started from the aggregated value of the National Accounts 2010 (D.4. according to ESA95). Since we assumed that interest incomes might vary according to region, this amount has been broken down firstly among re- gions proportionally to the regional GDP (the STADAT contains information on re- gional GDP). Secondly, these regional volumes have been further analyzed by deciles.
We assumed that there is no interest income in the lowest three deciles at all. If Si de- notes the interest income on the regional level and decji is the aggregated net income of decile j in region i (i = 1,...,7, j = 4,...,10), the following condition is required:
4 5 6 7 8 9
10
α α α α 2 α 2 α
3 α ,
i i i i i i i i i i i i i
i i
S dec dec dec dec dec dec
dec
= ⋅ + ⋅ + ⋅ + ⋅ + ⋅ ⋅ + ⋅ ⋅ +
+ ⋅ ⋅
where αi can be determined. This formula assures that the interest income is not as- sumed to be simply proportional to the overall income; some progressivity is forced by the coefficients assuming that the saving ratio in the richer deciles tends to be higher.
1.3. Ageing of incomes and simulation of taxation
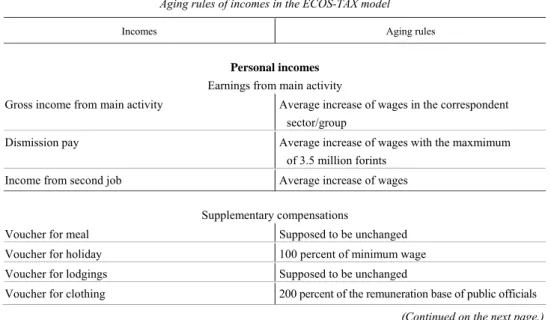
In the case of certain income categories there were unambiguous rules according to which the new values of 2011 and 2012 could be determined, that is, the increase of pensions must equal to the annual inflation rate. In other cases there were macrostatis- tical data that were taken into consideration. For example, gross earning of a particu- lar person was multiplied by the wage index of his/her corresponding category (gov- ernment or corporate sector, non-profit institutions, fostered workers). There were in- comes that were frozen, for example child-care allowance. Certainly, for certain cate- gories, we could rely only on experts’ judgements. Table 1 presents the applied aging rules of the main types of incomes. After aging the gross incomes, the net incomes have been calculated by the actual rules of personal taxations. The application of inte- grated weights provides an opportunity to determine the family tax benefits. Finally, real incomes are determined by taking into account the actual inflation rate.
Table 1 Aging rules of incomes in the ECOS-TAX model
Incomes Aging rules
Personal incomes Earnings from main activity
Gross income from main activity Average increase of wages in the correspondent sector/group
Dismission pay Average increase of wages with the maxmimum
of 3.5 million forints Income from second job Average increase of wages
Supplementary compensations
Voucher for meal Supposed to be unchanged
Voucher for holiday 100 percent of minimum wage
Voucher for lodgings Supposed to be unchanged
Voucher for clothing 200 percent of the remuneration base of public officials (Continued on the next page.)
(Continuation.)
Incomes Aging rules
Voucher for transport Experts’ judgement
Support for starting school Changed by the growth rate of minimum wage
Internet access Supposed to be unchanged
Other in-kind support Changed by the inflation rate Company car provided for private use Supposed to be unchanged Mobile phone provided for private use Supposed to be unchanged
Income from self-employment, total Annual revenue in the case of simplified corporate tax Experts’ judgement Income from self-employment Experts’ judgement Income from corporate enterprises (dividend and wage) Average increase of wages Dividend payment from self-employment Average increase of wages
Other income from work, total
Income from single commission Average increase of wages Income from authorship Average increase of wages Income from casual work Average increase of wages
Tip, gratuity Changed by the inflation rate
Pensions, supplementary pension
Pension Changed by the inflation rate
Pension for disabled persons Changed by the inflation rate
Pension for widows Changed by the inflation rate
Supplementary pension for widows Changed by the inflation rate
Disability benefit Changed by the growth rate of the minimum pension Old age benefit Changed by the growth rate of the minimum pension
Unemployment benefits Unemployment allowance According to the law
Unemployment aid Changed by the growth rate of minimum wage Regular social allowances Changed by the growth rate of the minimum pension Other support Changed by the growth rate of the minimum pension (Continued on the next page.)
(Continuation.)
Incomes Aging rules
Support related to children
Child-care fee Average increase of wages not exceeding the maxi- mum fixed by the law (or changed by the growth rate of minimum wage if there is no gross income from main activitiy)
Child-care allowance Changed by the growth rate of the minimum pension Child-care support Changed by the growth rate of the minimum pension
Pregnancy aid Average increase of wages
Maternity aid Changed by the growth rate of the minimum pension Other social income, total
Attendance fee Changed by the growth rate of the minimum pension
Scholarship Experts’ judgement
Regular allowances Changed by the growth rate of the minimum pension Non-regular allowances Changed by the growth rate of the minimum pension
Property income
Income from leasing of movables and immovables Experts’ judgement Perpetuity for indemnification Experts’ judgement
Income from abroad
Wages and salaries from abroad Average increase of wages Income from self-employment abroad Experts’ judgement Social income from abroad Average increase of pensions
Income from abroad, other Mean of the average increases of wage/pension Other
Transport contribution for disabled persons Experts’ judgement
Sick pay Average increase of wages not exceeding 200 percent
of minimum wage in 2012 Household incomes
Agricultural income Experts’ judgement
Agricultural expenditures Experts’ judgement Consumption from own production Experts’ judgement
Family allowance According to the law
Orphan's allowance Average increase of pensions not less than the prescribed minimum
(Continued on the next page.)
(Continuation.)
Incomes Aging rules
Income of children younger than 16 years Average increase of wages
Support on housing Experts’ judgement not exceeding 30 000 forints/month Other income, total (income in kind included) Experts’ judgement
Income from interest and dividend payment Experts’ judgement Reimbursement from insurance companies Experts’ judgement
As a result of the structure of the model, it is not possible to test and to validate the equations using the traditional methodology. In the absence of actual income data, the only option to validate the results is to check the goodness of fit of gross and net earnings for 2011. It was found that the model estimations satisfactorily approximated the actual macroeconomic data regarding gross earnings both for the corporate and the government sectors. Also, the calculated net earnings proved to be plausible, since a remarkable growth rate surplus was experienced, caused by the family tax benefit introduced in 2011. However, it would not have been correct from the methodological point of view to validate the net earnings data, since the official family tax benefit adjusted net earnings calculations were based also on our ECOS-TAX model (Cserháti–Dobszayné–Takács [2012]). The complete ex post validation of data will be possible only in 2014 when the final national accounts will be available.
2. Analysis of simulation results
A great number of new laws and changes affected household incomes and the in- come distribution during the past one and a half years in Hungary. The most impor- tant change was obviously the introduction of the flat rate personal income tax com- bined with the family tax benefit. Meanwhile, the tax credit was removed from the system. This change itself led to the increase of income inequalities (Cserháti–
Takács [2011]). However, the linear taxes could not boost economic growth in short term, but decreased the revenues of the state budget. The government compensated this loss partly by introducing special taxes for certain sectors and partly by cutting social benefits. It also affected the unemployment benefit; therefore, the government supported the increase of fostered work. We wanted to quantify the result of all these changes in the income inequalities among the different social strata.
Inequality can be characterized by standard indices, like the Lorenz-curve based Gini-index1 or the income ratio of the highest and lowest quintiles. Eurostat also provides these indices for the EU countries; the last data refer to 2010. It shows that inequality in Hungary was relatively low then. (We note that these indices are calcu- lated on the basis of EU SILC data, which may be biased since households with ex- tremely low income are typically missing.) The purpose of our investigation was to examine how the incomes developed in the last one and a half year.
We analysed the income distribution from different viewpoints. First, all the in- come deciles were examined, which basically shows the income inequality of the whole society. The number of dependent children was an important view of the anal- ysis because of the introduction of the new family tax benefit. Also, the generation structures of households have been studied. We have calculated the differences ac- cording to the activity status of the household head and to the number of economi- cally active family members. Since there are relevant differences among regions, the geographical distribution has also been analysed. Finally, the income distribution ac- cording to various types of settlements has been examined. We note that income have been determined for the so-called consumption unit according to the recent concept of the OECD. This means that the weight of the first adult (aged 18 and over) is 1, while that of subsequent adults is 0.5, and 0.3 is given to persons under 18. If the income is determined simply per person, it would unrealistically underes- timate the income.
According to the simulation results, the overall increase of disposable net real in- come was 3 percent in 2011, while it may decrease in 2012 by 2.1 percent as a result of the fiscal consolidation program and the weak growth. (The forecasted inflation rate for 2012 is 5.2 percent.) Table 2 shows the real income distribution per con- sumption unit among the deciles. The results demonstrate that the income polariza- tion has slightly increased, the loss of the lowest deciles are definitely higher than those of the upper three deciles.
The Gini-index has grown moderately in 2010–2012 from 0.299 to 0.312. This latter value is already higher than the average of the EU27. The ratio of the highest and lowest quintiles (S80/S20) shows a similar picture: it has grown from 4.45 to 4.73. Eurostat reported 5.0 for the EU27 for 2010. Éltető [1997] calculated a spe- cial index for Hungary (see also Éltető–Frigyes [1968]), this is the ratio of the av- erage income of those above the mean to the average income of those below the mean. This index was around 2 in the 1980s, while it is 2.25 in 2012 according to our model. The index is slightly increasing year by year. According to a widely ac- cepted definition, the poor are those with incomes below 60 percent of the median income. After a slight decrease in 2011, the ratio of the poor (poverty headcount
1 It may vary between 0 and 1, where 0 means perfect equality.
ratio) may reach 13.6 percent in 2012 according to the model results. The income gap ratio – showing the average relative distance from the poverty threshold among the poor – is around 23-24 percent; it has also increased in 2012 according to our computation.
Table 2 Distribution of incomes per consumption unit by decile
Income deciles Real change 2012/2011 (percent)
Decile 1 (the lowest incomes) 97,1
Decile 2 97,5
Decile 3 97,7
Decile 4 97,1
Decile 5 97,6
Decile 6 97,5
Decile 7 97,9
Decile 8 98,5
Decile 9 98,6
Decile 10 (the highest incomes) 99,0
Total 97,9
Source: Here and hereinafter ECOS-TAX model results.
Table 3 Income polarization per consumption unit by the number of dependent children Household category according
to the number of children Consumption units Real change 2012/2011 (percent)
No children 3 773 482 98,0
One child 1 262 260 97,4
Two children 961 773 97,9
Three or more children 496 879 98,3
Total 6 494 394 97,9
If the distribution by dependent children is considered, one can see in Table 3 that families with at least three children have the smallest loss. The main cause is obviously the realizable family tax benefit. Although this type of benefit already existed in 2011,
the parents may be able to realize more benefits as a result of the increase of gross sala- ries (primarily in the corporate sector). Considering the age structure of the families, the dynamics is different compared to our earlier examinations for 2010 (Cserháti–
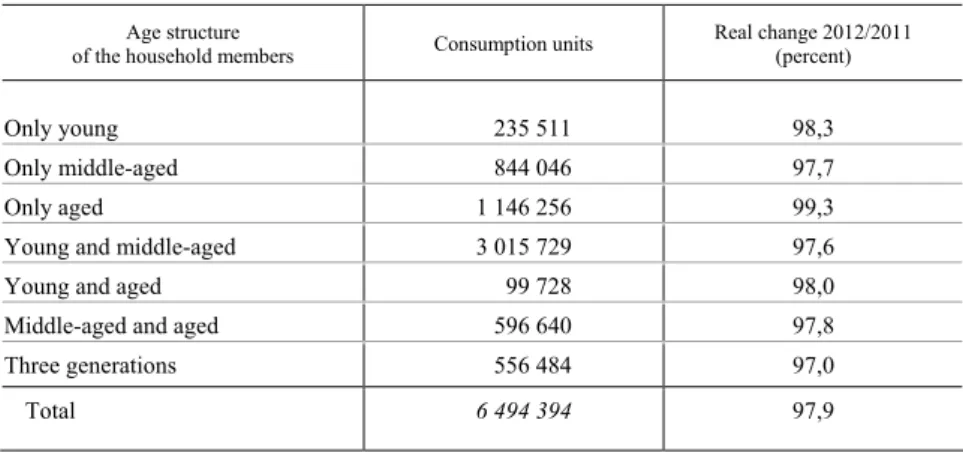
Takács [2010]). The relatively small loss of families with only aged members can be explained by the fact that pensions are still being increased in line with inflation. The increase of taxes burdened primarily families with middle-aged members, who cannot realize the tax benefit (see Table 4). This may explain also the figures of Table 5, where households only with inactive members have the smallest loss.
Table 4 Income polarization per consumption unit by the age structure of the household
Age structure
of the household members Consumption units Real change 2012/2011 (percent)
Only young 235 511 98,3
Only middle-aged 844 046 97,7
Only aged 1 146 256 99,3
Young and middle-aged 3 015 729 97,6
Young and aged 99 728 98,0
Middle-aged and aged 596 640 97,8
Three generations 556 484 97,0
Total 6 494 394 97,9
Table 5 Income polarization per consumption unit by activity status of the household head
Activity status Consumption units Real change 2012/2011 (percent)
Households only with non-active members 1 959 132 98,6
Wage earner, active household head 3 648 492 97,8
Pensioner, inactive household head 423 004 97,4
Other inactive household head 463 766 96,4
Total 6 494 394 97,9
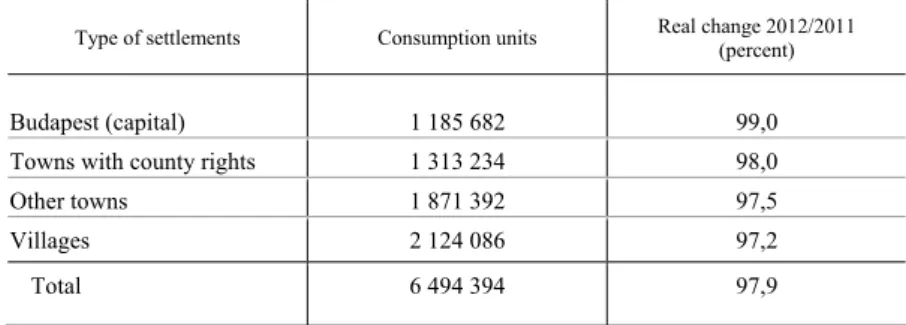
Regarding the geographic aspects, the capital Budapest has the most favourable position (we have examined it separately from Pest County to which it belongs). This means that the relative position of the traditionally developed parts of the country may increase their advantage, in other words, the regional polarization may become
greater. Similarly, Budapest and the towns increase their advantage if the different types of settlements are compared. The unemployment rate is high in small settle- ments, which may explain the worsening of their position.
Table 6 Income per household by region
Region Number of households Real change 2012/2011 (percent)
Budapest 756 843 99,0
Pest County 424 702 98,3
Central Transdanubia 412 474 98,0
Western Transdanubia 354 799 97,5
Southern Transdanubia 342 844 97,3
Northern Hungary 431 240 97,7
Northern Great Plain 529 747 96,2
Southern Great Plain 523 732 97,5
Total 3 776 381 97,9
Table 7 Income polarization per consumption unit by type of settlements
Type of settlements Consumption units Real change 2012/2011 (percent)
Budapest (capital) 1 185 682 99,0
Towns with county rights 1 313 234 98,0
Other towns 1 871 392 97,5
Villages 2 124 086 97,2
Total 6 494 394 97,9
3. Conclusions
This paper has analysed the effects of fiscal consolidation measures on income dis- tribution by the ECOS-TAX microsimulation model. The general experience in the different countries confirms that such austerity measures increase income inequalities,
although the effects of the changes of direct taxes – ceteris paribus – may show a dif- ferent picture. Our examination was based on the income data of households, so it is suitable primarily for quantifying the effect of direct taxes and that of transformations in social policy. The results suggest that these changes themselves increase income polarization: the Gini-index grew by 1.3 percentage points during the last two years.
The basic indices of poverty have not changed significantly in this period, but the head count poverty ratio has remained near 14 percent, according to the median in- come criterion. The increase of minimum wage and the relevant growth of the number of fostered workers could contribute to the stabilization of these indices. Families of at least three dependent children have a relatively smaller loss as a consequence of the increase in the realizable family tax benefit. Although the fiscal consolidation re- quired the reduction of social benefits, there has been no change in the rule of grow- ing pensions: they increase by the annual inflation. As a result, families with only aged members will have a relatively small loss in 2012. Income polarization can also be examined from a geographical point of view; the advantage of the traditionally de- veloped parts of the country has grown in the examined period. Correspondingly, the position of the capital and of the larger settlements has improved relatively to others.
The model ECOS-TAX proved to be a very useful tool to follow the actual in- come processes. The timeliness is very important for both fiscal and monetary deci- sion-makers; hence the official data on the income distribution among different so- cial strata are published two years later. The model is also suitable for ex ante policy analyses as well.
References
AGNELLO,L.–SOUSA,R.M.[2011]:Fiscal Consolidation and Income Inequality. NIPE Working Paper 34. Universidade do Minho. Braga.
BELYÓ,P.–MOLNÁR,I.[2006]:Use of Microsimulation Models for Political Decision Making.
Public Finance Quarterly. Vol. LI. No. 3. pp. 353–365.
CALLAN,T.–LEVENTI,C.–LEVY,H.–MATSAGANIS,M.–PAULUS,A.–SUTHERLAND,H.[2011]:
The Distributional Effects of Austerity Measures: A Comparison of Six EU Countries. EURO- MOD Working Paper. No. EM6/11. University of Essex. Essex.
CALLAN,T.–KEANE,C.–SAVAGE,M.–WALSH,J.R.[2012]: Distributional Impact of Tax, Wel- fare and Public Sector Pay Policies: 2009–2012. Quarterly Economic Commentary. The Eco- nomic and Social Research Institute. Dublin. http://hdl.handle.net/2262/63908
CSERHÁTI,I.–DOBSZAYNÉ HENNEL,J.–HAVASI,É.–KERESZTÉLY,T.–KŐVÁRI,ZS.–SZÉP,K.– TAKÁCS, T.–TALLÉR, A.–TAMÁSI,B. –VARGA, ZS. [2007]: A háztartások jövedelemala- kulásának elemzése mikroszimulációs modellel. ECOSTAT-KSH. Budapest.
CSERHÁTI, I. – DOBSZAYNÉ HENNEL, J. –TAKÁCS, T. [2012]: Mikroszimuláció alkalmazása a munkaügyi statisztikában. Statisztikai Szemle. Vol. 90. No. 9. pp. 844–861.
CSERHÁTI,I.–TAKÁCS,T. [2010]: Analysis of Income Disparities by Microsimulation. Hungarian Statistical Review. Special No. 14. pp. 110–124.
CSERHÁTI,I.–TAKÁCS,T. [2011]: Flat Rate Tax in Hungary. Journal of International Scientific Publication: Economy and Business. Vol. 5. Part 3. http://www.science-journals.eu, pp. 489–
497.
ÉLTETŐ,Ö.[1997]: Disparities in the Economic Well-Being of Hungarian Society from the Late 1970s to the 1980s. In: Gottschalk, P. – Gustaffson, B. – Palmer, E. (eds.): Changing Patterns in the Distribution of Economic Welfare. Cambridge University Press. Cambridge.
ÉLTETŐ, Ö – FRIGYES,E. [1968]: New Income Inequality Measures as Efficient Tools for Causal Analysis and Planning. Econometrica. Vol. 36. No. 2. pp. 383-396.
ÉLTETŐ,Ö.–MIHÁLYFFY,L. [2002]: Household Surveys in Hungary. Statistics in Transition. Vol.
5. No. 4. pp. 521–540.
MATSAGANIS,M.–LEVENTI,C.[2011]: The Greek Crisis in Focus: Austerity, Recession and Paths to Recovery. In: Monastiriotis, V. (ed.): The Greek Crisis in Focus. Hellenic Observatory Pa- pers on Greece and Southeast Europe. Special Issue. pp. 1–43. The London School of Econom- ics and Political Science. London.