EXAMINATION OF INEQUALITIES IN HUNGARY BY MICROSIMULATION IN CONSISTENCY WITH MACRO DATA
Ilona Cserháti
Office of Public Administration and Justice, Department for Research Corvinus University of Budapest, Department of Statistics
E-mail: ilona.cserhati@kih.gov.hu Tibor Keresztély
Office of Public Administration and Justice, Department for Research Corvinus University of Budapest, Department of Statistics
E-mail: tibor.keresztely@kih.gov.hu
Tibor Takács
Office of Public Administration and Justice, Department for Research Corvinus University of Budapest, Department of Economic Policy
E-mail: tibor.takacs@kih.gov.hu
Abstract
Effective decision making uses various databases including both micro and macro level datasets. In many cases it is a big challenge to ensure the consistency of the two levels.
Different types of problems can occur and several methods can be used to solve them. The paper concentrates on the input alignment of the households’ income for microsimulation, which means refers to improving the elements of a micro data survey (EU-SILC) by using macro data from administrative sources. We use a combined micro-macro model called ECONS-TAX for this improvement. We also produced model projections until 2015 which is important because the official EU-SILC micro database will only be available in Hungary in the summer of 2017. The paper presents our estimations about the dynamics of income elements and the changes in income inequalities. Results show that the aligned data provides a different level of income inequality, but does not affect the direction of change from year to year. However, when we analyzed policy change, the use of aligned data caused larger differences both in income levels and in their dynamics.
JEL-codes: C15, C54, D31
Keywords: income distribution, income inequality, microsimulation, micro-macro link, well- being
1. Introduction
Measurement and analysis of inequality is increasingly important when evaluating the economic and social performance of a country. According to the ‘Stiglitz-Sen-Fitoussi’
Commission on the Measurement of Economic Performance and Societal Progress “more prominence should be given to the distribution of income, consumption and wealth”, complementing the average measure of income with indicators that reflect income disparity among groups of population. The United Nation’s new Agenda, The 2030 Agenda for Sustainable Development (United Nations 2015) also aimed at decreasing income inequalities in the world by 2030 by ensuring that the income of the bottom 40 per cent of the population grows at a rate higher than the national average. One of the critical elements of evaluating income disparity both on micro and macro level is the method of quantification. Assuring consistency of micro- and macro level information is a key element for effective policy making. Modelling micro-level information for policy simulations is getting more and more widespread. Multi-dimensional micro information is suitable not only for macroeconomic income distribution analysis for the whole society, but also for analysing specific effects on specific groups of people. Using the same questionnaire information, one can also make international comparisons very easily.
It is a relevant question whether higher inequality in incomes has a negative impact on the economic growth. A new OECD research (OECD 2014) shows that when income inequality rises, economic development falls. The authors argue that poorer people are less able to invest in their education. Another reason can be that rich people spend their money on non- productive consumption. On the other side, the lack of inequality can also cause economic depression. When all the members of a society realize the same income, there will be no motivation to work better and more, to improve efficiency, or to think innovatively. So we can assume that there is an optimal level of income inequality. According to the OECD (2015), in most countries the actual level of inequality is much above the optimum and it is increasing nearly all around the world.
If we want to analyse inequality, the key issue is the timeliness of the income data, including the distribution parameters. This can be very problematic because inequality has changed rapidly in the last decades, so nonstop monitoring is needed. The best instrument for it is the EU-SILC database. Although this database is the best available, it is not perfect. The first problem is “macro-inconsistency”. EU-SILC is a sample-based survey, so we can improve it by using administrative databases which cover the whole population. The second difficulty is under-reporting: people tend to cover about 20% of their total income, even when the survey is anonymized. The third problem is the invisibility of the 1st and 10th deciles; it is very hard to reach the poorest and richest tenth of the population. Using the personal income tax database we have a chance to eliminate the majority of these problems.
The planning of the annual government budget has to be based both on macro and micro level analyses. On the one hand, it is compulsory in Hungary that the annual bill of the budget is submitted to Parliament with a three years forecast of the basic indicators of economic growth and equilibrium. On the other hand, it is important to assess the distributional impact of the budget on the different social strata. Budget revenues and expenditures depend on micro
processes as well (income distribution by income deciles, changes in activity status, etc.), therefore a nowcast of income distribution and inequality is necessary. There are some well- known microsimulation models that are also used for nowcasting. O’Donoghue and Loughrey (2014) gives an overview about this issue from a methodological point of view, mentioning both static and dynamic models. Both the Australian APPSIM (Keegan – Kelly 2011) and DYNASIM (Favreault et al. 2015) developed in the USA can be applied to nowcast. The EURODYM has been an initiative for a European network that should be the dynamic counterpart of the static EUROMOD. This dynamic model will also be suitable for the nowcasting of inequality indicators (Dekkers – Zaidi 2011).
There were several changes in the Hungarian personal taxation system during the past five years: the rules substantially changed in 2011, but there have also been changes every year since then. To analyse the impacts of these measures, the ECONS-TAX microsimulation model has been applied. This is a dynamic micro-macro model for the Hungarian economy following a top-down bottom-up (TDBU) approach. First, the basic structure of the model will be outlined. We discuss the problem of data alignment as well. An overview will be given about macroeconomic developments and income inequalities since 2011, and the new results concerning incomes will be presented for 2013-2015. It will be shown what differences the alignment may cause in the results. It will be shown that microsimulation is very useful, when progressive personal income taxation (PIT) is implemented. The main focus of the paper is however the treatment of the inconsistencies between micro and macro level. The microsimulation of incomes and income inequalities serves rather the illustration of the fact that the results may relevantly be influenced by the chosen alignment method. This is a crucial issue in the examination of income if it is based on household survey data, since households with extremely high income level are typically missing from these surveys. At the end of the paper, the main conclusions will be drawn.
2. ECONS-TAX, the Hungarian macro-micro model
The aggregation of a macro and a micro model is a difficult problem from both theoretical and practical point of view. The most demanding task is to build a macro and a micro submodel to work iteratively, when both submodels may use the output of the other submodel as an input. The new Hungarian model ECONS-TAX has this feature. The model was developed in the framework of an EU funded project as a part of the State Reform Operational Programme, the main goal of which was the reform of the public administration (KIH 2013). The model ECONS-TAX is specially devoted to the impact assessment of law proposals concerning income and employment policy. There are several ways to link macro and micromodels (see Cockburn et al. 2014 and the references therein). ECONS-TAX is based on the so called TD-BU (top down-bottom up) iterative approach. Figure 1 shows the main structure of the model. The macroeconomic submodel is a computable general equilibrium (CGE) model supported by a financial module (GAP). It integrates the dynamic/behavioural microsimulation model developed on the basis of the earlier static
microsimulation model ECOS-TAX1 on household income and the new dynamic model has been expanded to follow changes also in household consumption and labour supply. The macro model determines the labour demand and wages by industry and the consumer price indices by COICOP divisions. The CGE submodel forecasts the main macroeconomic indicators of growth and economic equilibrium, and the microsimulation determines the structure of incomes. The changes of different kinds of income are determined by ECOS- TAX, and the changes in household consumption are modelled by the demand system approach of Creedy (1998). These changes in consumption are determined by microsimulation using strata-specific elasticities. Then, the changes of the labour market (labour supply) are calculated, which gives the dynamics of the model.2 Finally, net income is calculated, which is used by the CGE submodel again.
The basic data of the microsimulation are the records of the Hungarian household budget survey based, on a representative sample of Hungarian private households. Disposable income and consumption can be determined by the number of dependent children, by generation structure of families, by activity status of the household head, by regions and by settlement types. The simulation uses both the output of the CGE model and the actual parameters of the taxation system as input.
Figure 1. The basic structure of ECONS-TAX
1 An overview on ECOS-TAX is given in Cserháti et al. (2012).
2 An overview on dynamic microsimulation models is given in Li et al. (2013).
Source: authors
3. Consistency with macro data, data alignment 3.1. Data discrepancies at micro and macro level
To coordinate the micro-macro level analysis of income and income disparities, a joint OECD-Eurostat Expert Group on Disparities in a National Accounts Framework (EG-DNA) was set up in 2011 with the participation of 25 countries, the European Central Bank and Luxembourg Income Study. The first step was an international comparison analysis of EU- SILC data with the Households Sector Accounts for 25 countries. The main sources of the identified discrepancies of income on micro and macro level were the following.
Missing components in the income surveys:
o Incomes from the unincorporated enterprises sector o Incomes stemmed from the non-observed economy o Social transfers in kind, FISIM, imputed rents, etc.
Inevitable sampling errors: the richest and poorest people are usually missing from the survey, weights are not perfect due to the increasing non-response ratio
Underreported incomes
Classification issues
Our paper analyses the effect of underreporting of gross earnings (which is the most important element of market income in the household sector) on inequality measures. Our research questions were as follows:
What is the effect on the main income inequality measures if we use an official administrative data base, especially the PIT database for adjusting the original EU- SILC data for Hungary?
Will this adjustment change only the level of income disparity or does it change also the dynamics?
Is this imputation effect stable or highly dependent on the applied tax regime or on the actual change in the tax system?
3.2. Imputation
A general problem of microsimulation is that these models often produce results that are not consistent with macroeconomic data; therefore the data should be adjusted by some method.
Either the input or the model output is aligned in microsimulation practice. In case of output alignment, the microsimulation model will provide only the structure of micro level units, while the level of their indicators is adjusted proportionally in order to ensure the consistency with macro data. The alignment of input data can be more problematic from a technical point of view, but it is unavoidable in our opinion, since the input dataset may contain biased data for example stemming from under- or overreporting in surveys or from non-representativity of samples in case of household budget data, etc. Such mistakes have to be eliminated even if model output is aligned or the micro and macro model iteratively works as in case of ECONS- TAX. Input alignment may include the cross check of micro data by other data sources, the detection of outliers and reweighting (based on macro data), if the input data is taken from a sample. Certainly, both input and output alignment can be applied.3 There are two frequently applied approaches of input data alignment, namely the imputation and the adjustment of weights if the dataset is given for a sample of micro units (the typical example is the household budget survey data). We apply both methods when aging the Hungarian household income data as follows.
The database of the present research is the households’ income data (EU-SILC) of 2013, since this is the last year for which these data have already been published by the Hungarian Central Statistical Office (HCSO) at the time of writing. These income data are typically underreported; therefore we also used an external data source for cross checking and data alignment. The PIT return database can be used to improve at least for taxable incomes, in particular for salaries, the weight of which exceeds 50% in Hungary (see HCSO 2014). The main advantage of the PIT database is that it contains the data of all tax payers contrary to the EU-SILC data, which is based only on a representative sample of households. Another advantage of PIT data is that the lowest and highest income data are generally more reliable (although even this dataset cannot entirely eliminate the problem of underreporting). Only the PIT data were used to align wage data of the EU-SILC in the present research. First the same
3 See e.g. Myck et al. (2015).
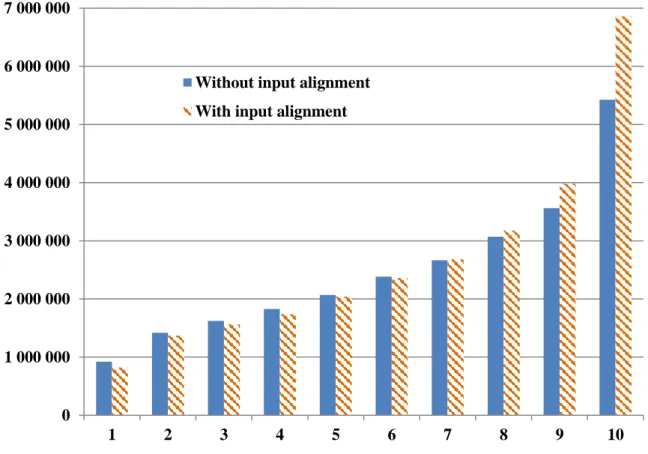
segments were created for both datasets and the average of wage data was determined for each segments. The segments were determined by three dimensions, namely by region, by age group and by income decile. We considered the 7 (NUTS 2 level) regions of Hungary, and 9 age groups were determined, thus the average wages were calculated for 630 segments. Then, the wage data of the EU-SILC were multiplied for each record by the ratio of average wages of the PIT and of the EU-SILC data in each segment in the starting year of the microsimulation (2013). Figure 2 shows the per capita disposable income for the starting year of the microsimulation with and without alignment. The alignment has resulted in a relevant change in the data, since the Gini-index (for earners) is 37.7% when using only the EU SILC, and it is as high as 48.7% when calculated by PIT data.
In general, input data alignment may have certain disadvantages as well. If data are aligned, i.e. modified in a certain way, the input dataset, the indicators calculated on the base of it and the aged data may not be suitable for international comparisons. Furthermore, access to external data sources is sometimes limited. However, data alignment relevantly reduces data bias and the output of a simulation can be considered more reliable, e.g., in our case the calculated distribution of disposable incomes may be realistic.
Figure 2. Per capita disposable household income in 2013 by decile with and without alignment (in HUF)
Source: authors 0 1 000 000 2 000 000 3 000 000 4 000 000 5 000 000 6 000 000 7 000 000
1 2 3 4 5 6 7 8 9 10
Without input alignment With input alignment
3.3. Reweighting
The Hungarian household budget survey is conducted by the Hungarian Central Statistical Office. Integrated weights are applied, i.e. the weight of a household equals to that of each member of the household. These weights are determined in two steps. The first step is the planning of a probabilistic sample that determines the ‘design’ weights (stratified sampling is used in the Hungarian practice). However, these design weights have to be calibrated because of failures of the survey: a relevant share of the population is not willing to cooperate. The calibration is a solution of a non-linear programming problem. The sum of distances between the old and the new weights is minimized (using either the chi-squared distance or the logistic formula of the information divergence). The conditions are determined by choosing some indicators, for which the new weights will ensure the consistency with given macro level data.
HCSO calibrates the weights according to certain demographic indicators, to the status of persons in the labour market and to the numbers of household with given numbers of dependent children.
Even the calibration of weights cannot take into consideration all kinds of boundary conditions that may be relevant from the viewpoint of a certain analysis. For example, when the ECONS-TAX is used, the employees in the different institutional sectors (government, NPISHs, corporate sector) are treated separately, thus the records has to be determined with their appropriate weights even for the input dataset. Also the employees of SMEs and of different industries are distinguished. External data and information is used in the calibration.
However, we apply here the method of statistical matching rather than optimization.
When the data are aged, the simulated data has to be fitted to the macro data in every step of the simulation, if corresponding macro level data are already available. The timeliness of macro level data is typically far better than that of micro data.
4. Macroeconomic developments of the Hungarian economy in 2006-2014
The main purpose of our model development is to provide reliable nowcasting or forecasting of macro level income distribution. For this it is essential to use the macro level information, the timeliness of which is typically better than that of micro level data and it characterizes the whole national economy.
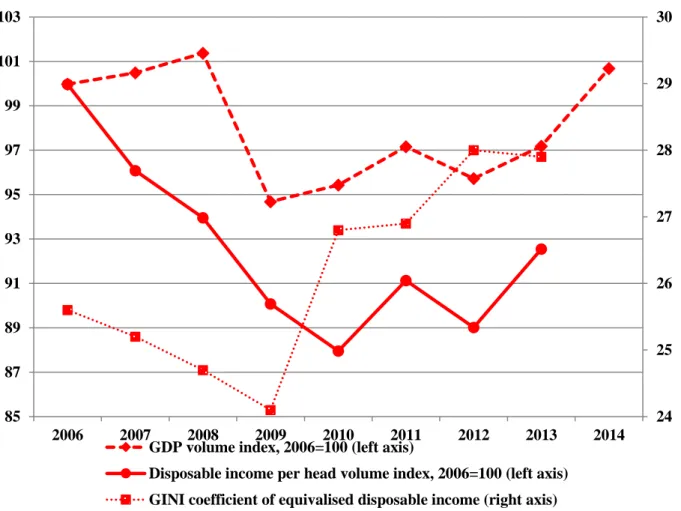
In Hungary, there were relevant changes in income inequalities during the past five years. As a result of the financial crisis, there was a deep recession in Hungary in 2009, and the economy stagnated in 2010. In 2010, the government reduced the pensions and also wages in the government sector (abolition of 13th month salary and pension) in order to improve the financial position of the central budget. After two years of moderate growth, the economy slipped back to a smaller recession in 2012 (see Figure 3). Meanwhile, the VAT was increased to 27% in the beginning of 2012, which is the highest rate in the world.
Policymakers decided to convert from a progressive to a flat tax rate on personal incomes in 2011 in order to boost the economy on the consumption side. Furthermore, tax credit was
decreased in that year, and it was ceased in 2012. However, a family allowance was introduced in 2011, which means that parents can relevantly reduce their personal taxes depending on the number of dependent children. Furthermore, the parents can realize the family allowance together, if the household head’s income is not high enough to subtract the whole amount of allowance from the tax base. A new regulation accepted in 2014 has extended this family allowance. The base of the allowance now includes the social security contribution payed by the employees. At the same time the support of dependent children remained unchanged: it is still 12 200 HUF per child as was set in 2011.
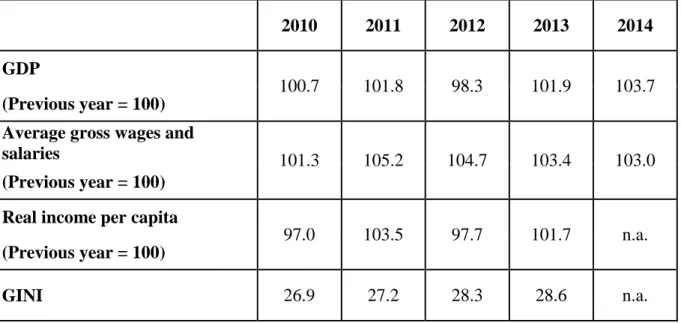
The flat rate on personal income did not result in a boost of consumption as expected, since it preferred rich people whose consumption share is relatively low, while the real income and consequently the consumption of the poorest people even decreased. This led to an increase of income inequalities. Table 1 shows the tendencies of some main macroeconomic aggregates is 2010-2014. One can see that both GDP and real income began to increase after the second recession. As a result of this, the real GDP level has reached its 2008 level, which was the maximum before the economic crisis. The table also shows the Gini index calculated for the whole household sector. Our aim was to determine the missing values of 2014 and their forecasted values for 2015 by the microsimulation model.
Table 1. Dynamics of GDP, income and Gini index in Hungary in 2010-2014
2010 2011 2012 2013 2014
GDP
100.7 101.8 98.3 101.9 103.7
(Previous year = 100) Average gross wages and
salaries 101.3 105.2 104.7 103.4 103.0
(Previous year = 100) Real income per capita
97.0 103.5 97.7 101.7 n.a.
(Previous year = 100)
GINI 26.9 27.2 28.3 28.6 n.a.
n.a. – not available
Source: Hungarian Central Statistical Office, Eurostat
Figure 3. Development of the Hungarian national economy in 2006-2014
Source: authors
5. Model results for 2013-2015
Tables 2 to 5 and Figures 4 to 5 show the results of the ECONS-TAX. Simulation shows that moderate economic development continues, but the income inequalities may slightly increase until the end of 2015. The inequality measures have been calculated for both aligned and non- aligned data.
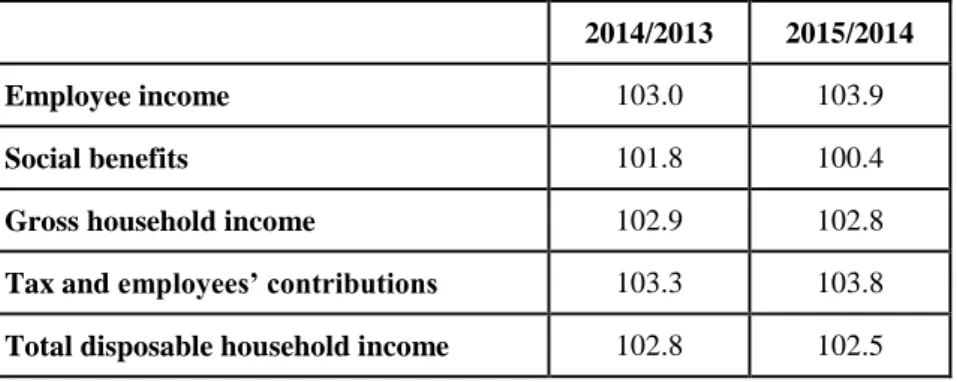
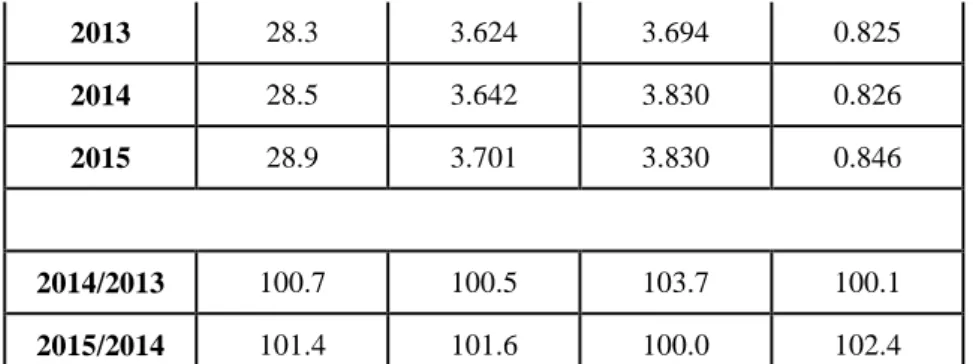
Table 2 completes Table 1 with our forecasts for 2014-2015. Table 3 shows that the structure of household income is expected to change: the growth rate of employee income increases, while that of the social benefits decrease. A similar change can be observed also in 2013-2014 (see Figure 4), although this change is not so apparent in the first and second year of the forecast.4 As a result of this, the dynamics of gross household income do not change significantly in 2015. Simulation results show that taxes and employee’s social contribution may increase on macro level. As a result of this the dynamics of total disposable household income may be less in 2015 than in 2014. However, the increase is still 2.5%, which may result in a relevant increase in real income also in 2015, since the annual consumer price index is expected around zero. The richest quintile possesses more than 40% of the disposable
4 This is rather a nowcast, i.e. the indicators for the present are calculated well before statistical data is available.
24 25 26 27 28 29 30
85 87 89 91 93 95 97 99 101 103
2006 2007 2008 2009 2010 2011 2012 2013 2014
GDP volume index, 2006=100 (left axis)
Disposable income per head volume index, 2006=100 (left axis) GINI coefficient of equivalised disposable income (right axis)
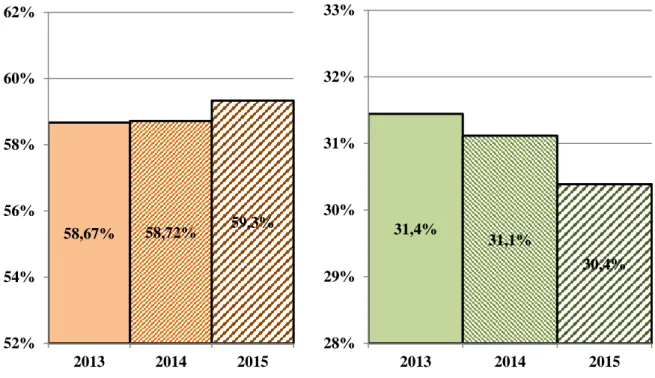
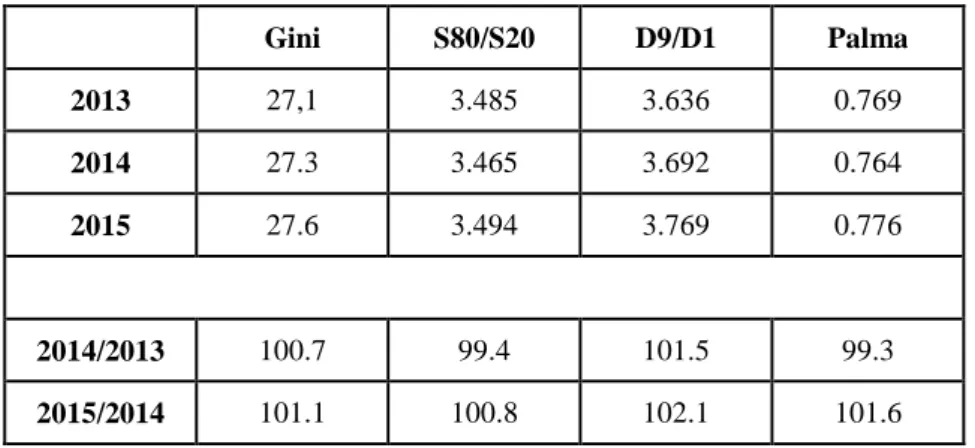
income. This share is slightly increasing (see Figure 5), and simultaneously the share of the lowest quintile is continuously decreasing. Correspondingly, all the main indicators of income inequality increase as shown by Tables 4 and 5. We have calculated the inequality measures both with and without data alignment; both calculations show a slight increase of income inequality. Four inequality measures have been calculated, namely the Gini index, the S80/S20 index (income share of the richest and of the poorest quintile), the D9/D1 (the ratio of the upper bound value of the 9th decile to the bound value of the 1st decile) and the Palma- index (share of income of the highest and of the lowest five deciles). The increase is higher when using aligned data.
Table 2. Dynamics of GDP, wages and real income in 2012-2015
2012 2013 2014 2015
GDP
98.5 101.5 103.6 103.1
(Previous year = 100)
Average gross wages and salaries
96.6 103.1 103.0 103.9
(Previous year = 100) Real income per capita
97.4 104.3 103.0 102.2
(Previous year = 100)
Source: Hungarian Central Statistical Ofiice and forecasts of the authors in July 2015 (shadowed values)
Table 3. ECONS-TAX forecast on growth of household income and social benefit (previous year=100)
2014/2013 2015/2014
Employee income 103.0 103.9
Social benefits 101.8 100.4
Gross household income 102.9 102.8
Tax and employees’ contributions 103.3 103.8 Total disposable household income 102.8 102.5
Source: authors
Figure 4. ECONS-TAX forecast on income and benefit in % of GDP
Source: authors
Figure 5. ECONS-TAX forecast on share of disposable income by quintile
Source: authors
Table 4. Forecast of income inequalities in Hungary based on EU-SILC data – flat PIT
Gini S80/S20 D9/D1 Palma
58,67% 58,72% 59,3%
52%
54%
56%
58%
60%
62%
2013 2014 2015
31,4%
31,1%
30,4%
28%
29%
30%
31%
32%
33%
2013 2014 2015
8,2% 8,1% 7,9%
12,4% 12,4% 12,3%
16,6% 16,6% 16,5%
22,0% 22,0% 22,0%
40,8% 41,0% 41,4%
0%
10%
20%
30%
40%
50%
60%
70%
80%
90%
100%
2013 2014 2015
poorest quintile 2nd poorest quintile middle quintile 2nd richest quintile
2013 28.3 3.624 3.694 0.825
2014 28.5 3.642 3.830 0.826
2015 28.9 3.701 3.830 0.846
2014/2013 100.7 100.5 103.7 100.1
2015/2014 101.4 101.6 100.0 102.4
Source: authors
Table 5. Forecast of income inequalities in Hungary based on EU-SILC corrected by the PIT data – flat PIT
Gini S80/S20 D9/D1 Palma
2013 32.9 4.656 4.606 1.073
2014 33.1 4.677 4.724 1.078
2015 33.7 4.776 4.883 1.099
2014/2013 100.6 100.5 102.6 100.5
2015/2014 101.8 102.1 103.4 101.9
Note: S80/S20 is the income quintile share ratio, D9/D1 is the ratio of the upper bound value of the 9th decile to the bound value of the 1st decile
Source: authors
We have also simulated the income inequalities at a hypotetical progressive PIT, where the tax rate is 17% until 5 million HUF and it is 32% above this threshold. Two different scenarios have been examined. In the first one the progressive tax rate was assumed during the whole period of 2013-2015, while in the second run progressivity was considered only in 2015. Our primary purpose was to examine the effect of input alignment in case of different tax regimes. Tables 6 and 7 show the results corresponding to the progressive tax system during the whole period without and with alignment, respectively. The results of the ‘mixed’
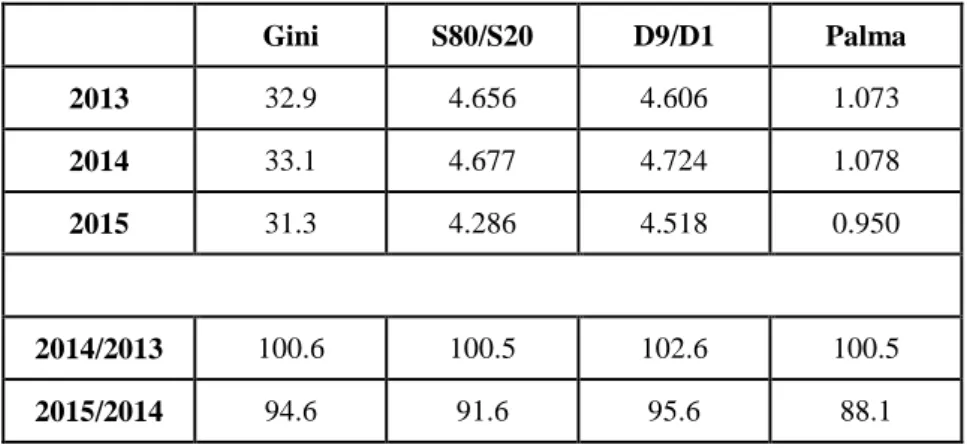
PIT regime (progressivity only in 2015) are shown in Tables 8 and 9. The progressivity obviously results in lower levels of inequality indicators. Interestingly, the alignment has effects also on the dynamics of these indicators, and this effect is more apparent if the PIT is progressive. For example, if the input data are not aligned, indicators S80/S20 and the Palma index decrease in 2014, while both of them increase in the aligned case. The scenario with PIT regime change spectacularly showed the importance of the alignment. As one can see in Tables 8 and 9, the differences of the dynamics in 2015 were in percentage points 2.2 (Gini index), 4.3 (S80/S20), 2.8 (D9/D1) and as high as 5.9 (Palma index). Certainly, the indicators based on alignment are not suitable for direct international comparisons, since the Eurostat
give indicators for the different EU countries based on raw EU SILC data.5 We think, however that it is important to calculate also the adjusted inequality indicators, since they comprise more information, therefore they are closer to the reality.
Table 6. Forecast of income inequalities in Hungary based on EU-SILC data – progressive PIT
Gini S80/S20 D9/D1 Palma
2013 27,1 3.485 3.636 0.769
2014 27.3 3.465 3.692 0.764
2015 27.6 3.494 3.769 0.776
2014/2013 100.7 99.4 101.5 99.3
2015/2014 101.1 100.8 102.1 101.6
Source: authors
Table 7. Forecast of income inequalities in Hungary based on EU-SILC corrected by the PIT data – progressive PIT
Gini S80/S20 D9/D1 Palma
2013 30.6 4.220 4.320 0.936
2014 30.8 4.231 4.384 0.937
2015 31.3 4.286 4.518 0.950
2014/2013 100.7 100.3 101.5 100.1
2015/2014 101.6 101.3 103.1 101.4
Source: authors
Table 8. Forecast of income inequalities in Hungary based on EU-SILC data – with changing PIT regime
Gini S80/S20 D9/D1 Palma
2013 28.3 3.624 3.694 0.825
2014 28.5 3.642 3.830 0.826
2015 27.6 3.494 3.769 0.776
2014/2013 100.7 100.5 103.7 100.1
5 See Eurostat, http://ec.europa.eu/eurostat/tgm/table.do?tab=table&language=en&pcode=tessi190
2015/2014 96.8 95.9 98.4 94.0
Source: authors
Table 9. Forecast of income inequalities in Hungary based on EU-SILC corrected by the PIT data – with changing PIT regime
Gini S80/S20 D9/D1 Palma
2013 32.9 4.656 4.606 1.073
2014 33.1 4.677 4.724 1.078
2015 31.3 4.286 4.518 0.950
2014/2013 100.6 100.5 102.6 100.5
2015/2014 94.6 91.6 95.6 88.1
Source: authors
6. Conclusions
The model ECONS-TAX integrates a macroeconomic CGE submodel and a dynamic microsimulation submodel that work interactively. The model is therefore a useful tool to support the planning of the government budget, as the macromodel forecasts the short and mid-term developments of the main macroeconomic indicators, while the microsimulation projects the effects of the planned fiscal policy in terms of income inequalities, consumption by different groups of the society and changes of labour market. The calculation of income inequalities per se is useful for decision makers and analysts, since the first official information on households’ income concerning 2015 will be available only in 2017.
The paper discussed how the consistency between micro and macro level data can be treated.
It was illustrated by the microsimulation of income that input data alignment is the best solution to avoid distorted results, if data on different categories of household income are available from other reliable sources. This type of data adjustment is consistent with the present efforts of Eurostat and the OECD to reconcile micro and macro level income data.
The ECONS-TAX microsimulation model ages the records of household income data that are based on a sample. There may be problems with the representativeness of the sample and practice shows that this survey cannot observe the richest and poorest social strata. The survey data should be improved by using information from other possible sources, e.g. from tax return data. This is important, since practice show that the share of the richest households in the aggregate income is increasing. Therefore, these income data was aligned to the data of PIT return covering all tax payers, although only wages and salaries have been adjusted. It was also shown that the input alignment may have an effect not only on levels but also on the dynamics of income inequalities. This is especially obvious if the PIT is progressive or the
PIT regime is changing. Our input alignment helps a better understanding of macro level income disparity dynamics in Hungary. We started from the database of 2013 for the simulation. The tendencies of inequalities have been projected until 2015 both on macro and micro-level; this may provide an opportunity to give real-time signals to policymakers to react if necessary.
The paper has presented the new results of the ECONS-TAX for 2013-2015. The Hungarian economy has begun to grow after the second recession of 2012, and this economic growth is expected above 3% both in 2014 and 2015. Also the real income of households is expected to increase although at a lower rate. However, also the income inequalities will slightly grow that is shown by the main inequality indices (Gini, S80/S20, Palma index).
References
Cockburn, J. – Savard, L. – Tiberti, L. (2014): Macro-micro models. In: Donoghue, C. (ed.):
Handbook of microsimulation modelling. Emerald Group Publishing Ltd.
Creedy, J. (1998): Measuring the welfare effects of price changes, a convenient parametric approach. Australian Economic Papers 37(2): 137-151.
Cserháti, I. – Keresztély, T. (2010): A megfigyelési egységektől a makrogazdasági
aggregátumokig – a mikroszimulációs modellezés néhány módszertani kérdése. [From units of observation to the macroeconomic aggregates – Some methodological issues of
microsimulation modelling]. Statisztikai Szemle 88(7-8): 789-802.
Cserháti, I. – Keresztély, T. – Takács, T. (2012): Examination of income inequalities of Hungarian households in 2012 using a microsimulation model. Hungarian Statistical Review, 90: 3-17.
Dekkers, G. – Zaidi, A. (2011): The European network for dynamic microsimulation (EURODYM) – A vision and the state of affairs. International Journal of Microsimulation 4(1) 100-105.
Eurostat (2013): European household income by groups of households. Methodologies and Working Papers.
Favreault, M. M. – Smith, K. E. – Johnson, R. W. (2015): The dynamic simulation of income model (DYNASIM), an overview. Urban Institute Research Report, September.
Fesseau, M. – Florence, W. – Mattonetti, M. L. (2013a): A cross-country comparison of household income, consumption and wealth between micro sources and national account aggregates, OECD – Eurostat Statistics Working Paper STD/DOC/ 2013 (3).
Fesseau, M. – Mattonetti, M. L. (2013b): Distributional measures across household groups in a national accounts framework. OECD – Eurostat Statistics Working Paper STD/DOC/ 2013 (4).
Hungarian Central Statistical Office (2015): National Accounts of Hungary 1995-2014.
Budapest: Hungarian Central Statistical Office.
Keegan, M. – Kelly, S. F. (2011): A model of riches – modelling wealth in the APPSIM dynamic microsimulation model. 3rd General Conference of the International Microsimulation Association, Stockholm, Sweden, 2011.
KIH (2013): A jogszabály-előkészítési folyamat racionalizálása [The rationalization of the law-making process]. Overview of the results of EU funded project No ÁROP-1.1.10-2011- 2011-0001. KIH (Office of Public Administration and Justice).
Li, J. – O’Donoghue, C. (2013): A survey of dynamic microsimulation models: Uses, model structure and methodology. International Journal of Microsimulation 6(2): 3-55.
Myck, M. – Najsztub, M. (2015): Data and model cross-validation to improve accuracy of microsimulation results: estimates for the Polish household budget survey. International Journal of Microsimulation 8(1): 33-66.
O’Donoghue, C. – Loughrey J. (2014): Nowcasting in microsimulation models: a methodological survey. Journal of Societies and Social Simulation 17(4).
OECD (2013a): OECD framework for statistics on the distribution of household income, consumption and wealth. Paris: OECD Publishing.
OECD (2013b): Guidelines for micro statistics on household wealth. Paris: OECD Publishing.
OECD (2014): Does income inequality hurt economic growth? Focus on Inequality and Growth. Paris: OECD Publishing.
OECD (2015): In it together: Why less inequality benefits all. Overview of inequality trends, key findings and policy directions. Paris: OECD Publishing.
United Nations (2015): Transforming our world – the 2030 agenda for sustainable development. New York: United Nations.