Development of I ncome T axes in Slovakia and the European Union in the L ight of R ecent
E conomic C hanges in Europe
JAROSLAV KOREČKO, PH.D
.ASSISTANT LECTURER
UNIVERSITY OF PREŠOV e-mail: jaroslav.korecko@unipo.sk
ALŽBETA SUHÁNYIOVÁ, PH.D.
ASSOCIATE PROFESSOR
TECHNICAL UNIVERSITY OF KOŠICE e-mail: alzbeta.suhanyiova@tuke.sk
LADISLAV SUHÁNYI, PH.D.
ASSOCIATE PROFESSOR
UNIVERSITY OF PREŠOV e-mail: ladislav.suhanyi@unipo.sk
SUMMARY
Political, economic, and social developments in the world have undergone relatively turbulent changes over the last two decades. The European Union has not avoided them either. Naturally, any such change directly or indirectly affects the national economies of individual countries. Governments adapt to the new conditions through measures in the areas of employment, production, taxes, levies, and the like. This paper aims to examine the development of income taxes in Slovakia and other countries of the EU. Personal income tax and corporate income tax are the most significant direct taxes in all Member States in terms of collection volume. Their development varies from one region of Europe to another. Therefore, the idea of greater tax harmonization in the Union regularly runs into the arguments of countries in favor of maintaining tax competition. The paper seeks the similarity of individual tax systems and suggests a possible procedure in their further convergence.
Keywords: Tax; Tax system; Direct taxes; Personal income tax; Corporate income tax; Tax base, Tax rate; Tax harmonization; Income taxes; Clusters.
JEL classification: H21; H24; H25.
DOI: http://dx.doi.org/10.18096/TMP.2021.03.06
I NTRODUCTION
In terms of the tax collection volume, income taxes are the most significant direct taxes in Slovakia, as in other European countries. The tax system of Slovakia has undergone several tax reforms since the establishment of an independent state. All of them significantly affected the tax burden on the population's and entrepreneur's income.
The government, entrepreneurs, experts, and other entities of the national economy discuss the fairness and efficiency of income taxation regularly. This paper offers a detailed analysis of income tax development in Slovakia in recent years. It examines the impact of reforms on the tax burden and presents the current situation of personal income and corporate income
taxation. However, as in Slovakia, constant changes in income taxation are taking place in other Member States of the European Union. Each EU country must be prepared to respond flexibly and effectively to current pandemic situations, including through tax measures. To do this, it is necessary to know how the entities react to the new tax measures. The aim of the paper is to examine the development of income taxes in Slovakia and the other Member States. Each country’s economy has undergone its own historical, political, economic, and social development, which has been reflected in the needs of the public sector, the private sector, and the population. So, the different taxation of income in individual countries is thus natural.
R ELATED R ESEARCH
The whole 20th century was characterized by a rapid process of internationalization in several social areas, including international economic cooperation. The Member States of the EU and their tax systems could not avoid this global trend, either. National tax systems need to respond to their trading partners because of increasing international trade.
Despite significant rises since 2010, EU-28 income tax revenue as a percentage of GDP reached a plateau in 2015, with the euro area following a broadly similar trend. The structure of taxation varies quite significantly across the Member States. When it comes to the share of direct taxes in total tax revenues, Denmark has the highest share (66%), followed by Ireland, the United Kingdom, Sweden, and Malta with shares lying between 40% and 50% of revenue (Genschel & Jachtenfuchs 2018).
Significant differences in income taxes can be followed between Western or Northern Europe (such as Belgium, Denmark, France, Netherlands, Germany) and Eastern European countries (e.g. Bulgaria, Romania, Slovakia, and the Czech Republic). There are significant differences in the rates for income taxes, as well as in the tax collection volume.
Nowadays, all developed countries join different integration clusters. They cooperate and depend on each other. Reasons are mainly political and economic, such as strengthening the position on defense, creating competitive economies, expanding markets, and the like. There is a lot of effort needed to make this cooperation work effectively. To make the cooperation as easy as possible, there are efforts to standardize, coordinate, and harmonize the greatest possible number of processes, laws, directives, regulations, etc. The European Union is a typical example of such a cluster.
The processes of international coordination in the EU also affect the taxes and tax systems of the Member States.
The current tax framework in the EU leaves Member States free to choose their tax system if they comply with the rules unanimously adopted by the EU Council. If a Member State’s tax policies violate the principles of the single market, the EU is empowered to take decisions to ensure protection against tax fraud and evasion, as well as to suppress aggressive tax planning (Niazi 2016, Nerudová 2004).
In the area of corporate taxation or combating harmful competition and aggressive tax planning, targets are set to reduce the number of loopholes resulting from complex rules, assessment bases and rates that may apply to individual businesses (Douma
& Kardachaki 2016).
To date, there are relatively significant differences between the tax burden associated with income from employment in the individual EU Member States.
Concerning tax proceedings, the difference is mainly in the setting of the tax base for the calculation of tax liability (Psenkova 2016).
Legislators need to prepare a legislative concept that is not only in line with all EU intentions and regulatory requirements but also acceptable to national taxpayers when preparing country tax system adjustments. Moreover, it is important to realize that tax harmonization is followed by changes in the accounting legislation of individual European countries (Hakalova et al. 2018, Pîrvu 2012).
The European Commission launched a debate on the gradual transition to more effective taxation decisions in the EU. The Commission Communication builds on Juncker’s 2018 speech to the EU members, calling for a move towards qualified majority voting in tax matters. At present, when voting, unanimous decisions are required in the tax policy following primary law, which imposes considerable restrictions, as new legislation is indeed difficult to adopt, and legislation once adopted is also hard to change because any change requires unanimity again. The current situation can lead to costly delays or a complete blockage of proposals that may be relevant to growth, competitiveness, and tax justice in the single market (Genschel & Jachtenfuchs 2018).
This paper aims to explore selected aspects of the most relevant direct taxes (Personal Income Tax – PIT, and Corporate Income Tax – CIT) primarily in Slovakia, then in the other Member States. The task is to assess the reality of tax unification in the EU and to suggest possible progress in this process soon.
D EVELOPMENT OF INCOME TAXES IN S LOVAKIA
Direct taxes are levied directly on the taxpayer whose income or assets are taxable. Indirect taxes are also called consumption taxes, usually collected from consumers by the taxpayer. In the recent period, the classification of taxes according to the territorial aspect of tax determination has become increasingly important. Territorial decentralization of public administration is associated with the financial decentralization of lower government funds (Jakúbek
& Tej 2015). There is an increasing tax revenue transfer from the state budget to the municipalities’
budgets. Cities and municipalities are strengthening their tax jurisdiction.
68
Table 1
Tax classification in Slovakia
Territorial aspect of tax determination
DIRECT TAXES INDIRECT TAXES
State budget Individual (personal) and corporate income tax
Value-added tax
Motor vehicle tax Excise duty on mineral oil Excise duty on tobacco products
Excise duty on alcoholic beverages
Excise duty on electricity, coal, and natural gas
Budget of municipalities and Higher Territorial Units
Real estate tax (on land, buildings, flats, and non-residential premises)
Dog tax
Tax on the use of public areas Accommodation tax
Tax on vending machines
Tax on non-winning gaming machines Tax on the entry and staying of motor vehicles in historical parts of towns
Nuclear facility tax
Source: authors, data from the Ministry of Finance of the Slovak Republic (2020a) The taxes are defined by the Income Tax Act, the
Motor Vehicle Tax Act, the Value Added Tax Act, four excise tax laws, and the Local Taxes and Fees Act. At present, there are 15 taxes in Slovakia, which are determined by individual tax laws (Table 1).
Tax collection is provided by the following tax administrators:
Financial Administration (income to the state budget - income taxes, motor vehicle tax, value added tax, excise duties),
Municipalities (income to the local budget - local taxes).
Although the personal income tax is collected by the Financial Administration, it is then redistributed as follows (Ministry of Finance of the Slovak Republic 2020c):
70% of the total revenue for municipalities,
30% of the total revenue for Higher Territorial Units (regions). There are 8 Higher Territorial Units in Slovakia, 2890 municipalities, and 140 cities.
Taxation is one of the most relevant instruments of the state's economic policy. Tax revenues are formed mainly from income taxes, value-added tax, and excise duties (Table 2).
Table 2
Tax revenues of the Slovak State budget (Million EUR)
Time Tax
revenues overall
Income tax VAT Excise
duties
Other tax revenues
PIT CIT
2004 7 808 931 1 098 3 507 1 499 773
2005 9 017 1 302 1 472 3 880 1 804 559
2006 9 461 1 530 1 576 4 165 1 597 593
2007 10 644 1 810 1 878 4 166 2 178 612
2008 11 270 2 073 2 104 4 654 1 809 630
2009 9 954 1 708 1 614 4 231 1 763 638
2010 10 083 1 691 1 623 4 186 1 931 652
2011 10 897 1 873 1 659 4 651 2 000 714
2012 10 997 2 065 1 689 4 322 1 973 948
2013 11 565 2 072 1 808 4 664 1 985 1 036
2014 12 729 2 345 2 211 5 013 2 015 1 145
2015 14 158 2 657 2 717 5 416 2 108 1 260
2016 14 568 2 695 2 942 5 415 2 174 1 342
2017 15 344 2 605 2 635 5 913 2 252 1 939
2018 16 382 3 208 2 891 6 326 2 315 1 642
2019 18 273 3 577 2 907 6 826 3 010 1 953
Change 2004- 2019
+ 10 465 +
2 646
+ 1 809
+ 3 319 + 1 511 + 1 180 Increase (%) +134.0% +284.
2%
+164.
8%
+94.6% +100.8
%
+152.7
% Source: Ministry of Finance of the Slovak Republic (2020b)
Tax collection more than doubled in the period under review. For the monitored period on tax revenues, we chose 16 years, from 2004 (when the Slovak Republic joined the EU) to 2019 (the latest published data on tax revenues). The most significant increase in the collection of taxes in this period was made in personal income tax, in relative terms by more than 284%. The second place belongs to the corporate income tax, which grew by more than 164%. The first reason for the growth in tax collection is the performance of the economy. The second possible factor is the growth of the tax rate. Another factor is the improvement of the efficiency of tax collection through better control of financial statements and fraud detection.
The so-called flat tax (or in other words linear tax) introduced in 2004 was abolished in 2013 after the change of government. The introduction of a flat tax shifted the tax burden from direct to indirect taxes. The simple system and control were aimed at minimizing tax evasion. Besides, the inflow of foreign capital into the Slovak economy increased. However, this was caused not only by the introduction of a flat tax but also by the simultaneous implementation of economic and institutional reform.
The overall tax collection after the financial and economic crisis in 2009 fell by more than 10%.
Despite the introduction of various measures to mitigate the crisis effects, it took almost three years to exceed the values of 2008. Tax collection gained momentum after 2012. In the last year of the period under review (2019), its value exceeded 2008 by almost 63%.
In 2019, an amount of EUR 18.273 billion was recorded for tax revenue. The largest part represented indirect taxes in the amount of EUR 9 836 billion,
namely, value-added tax in the amount of EUR 6.826 billion and excise duties in the amount of EUR 3.010 billion. Of the direct taxes, the highest revenues were (obviously) from personal income tax (EUR 3.577 billion) and corporate income tax (EUR 2.907 billion).
The largest increase in tax collection during the period under review was recorded for value-added tax EUR 3.319 billion, personal income tax EUR 2.646 billion, and corporate income tax EUR 1.809 billion.
Income tax
Income tax was introduced in Slovakia on the first day of the independent Slovak Republic, on 1 January 1993 by Federal Act no. 286/1992 Coll. It replaced the previous categories of payroll tax, income tax from literary and artistic activities, citizen’s income tax and pension tax, agricultural tax, profit tax, and profit levy (for legal entities). Income tax is a common designation for personal income tax and corporate income tax. They have been regulated from 1 January 2004 to the present in joint Act 595/2003 Coll. on Income Tax, also known as the Income Tax Act (Legislative and Information Portal of the Ministry of Justice of the Slovak Republic 2020). The law has been amended and changed several times, as it was necessary to adapt the individual provisions of the Income Tax Act to the conditions related to membership in the European Union (Korečko &
Suhányiová 2019). The tax administrator in the Slovak Republic is the Financial Administration, which registers tax subjects of income taxes in the Register of Tax Subjects. The number of tax subjects in the observed period is shown in Table 3.
Table 3
Number of registered tax subjects in Slovakia (2004 to 2019)
Time Income tax
PIT CIT
2004 1 847
641
128 497
2005 2 003
967
142 169
2006 2 157
211
155 969
70
2007 2 296 434
171 601
2008 2 436
153
189 958
2009 2 559
000
204 115
2010 2 676
557
220 748
2011 2 747
220
237 794
2012 2 823
840
255 959
2013 2 879
037
278 903
2014 2 921
699
287 880
2015 3 008
570
285 388
2016 3 124
373
294 396
2017 3 241
894
306 622
2018 3 355
264
322 235
2019 3 465
164
340 389 Change 2004-
2018
+ 87.5
% + 164.9 %
Source: Financial Administration of the Slovak Republic (2020) The highest number of tax subjects represent payers
of personal income tax. The highest increase in the number of tax subjects occurred among corporate income taxpayers (an increase of 164.9%).
Personal income tax (PIT)
The subject of Personal income tax in the sense of the Income Tax Act is a taxpayer who achieves taxable income and:
is a tax resident – a person who has a permanent residence in the territory of the Slovak Republic or usually stays there for at least 183 days in the relevant calendar year. Tax residents are subject to personal income tax calculated on their worldwide income, taking into account reliefs under Slovak law and double taxation treaties;
person who is not a Slovak resident, but the tax liability shall apply to income derived from sources in the Slovak Republic. Non-residents are liable to personal income tax calculated on their income from sources in the Slovak Republic;
a taxpayer with a permanent residence abroad, who was sent to Slovakia by a legal entity as an expert for the purpose of providing professional assistance to legal entities domiciled in Slovakia and stays here only for the purpose of professional assistance.
The subjects of PIT are divided into groups by source of income:
income from dependent activity (employees) - Section 5 of the Income Tax Act,
income from business, from other self-employed activity, from rent and income from the use of work and artistic performance - Section 6 of the Income Tax Act,
income from capital assets - Section 7 of the Income Tax Act,
other income - Section 8 of the Income Tax Act.
The tax base is a relevant variable in calculating the tax liability. It consists of partial tax bases according to individual groups of income. The non-taxable parts of the tax base are derived from the partial income tax bases from dependent activity, business, and other self- employed activity or their total. Then the other partial tax bases are added. Items deductible from the tax base are non-taxable parts of the tax base for the taxpayer and his/her spouse, non-taxable parts of the tax base for spa care, tax bonus for a child, or unpaid interest on a mortgage for young people and contributions to supplementary pension savings (Fiľarská et al. 2018). For each of these items, the conditions for entitlement and the method of calculation sets the law. The correct classification of income received is necessary for the correct quantification of the taxpayer's tax liability.
Since 2004, the non-taxable part on taxpayers has been set as a multiplicand of the subsistence minimum sum applicable on 1 January of the tax year. The subsistence minimum is a socially recognized
minimum income limit of a natural person, below which a state of material need occurs (Ministry of Labour, Social Affairs and Family of the Slovak Republic 2020).
The amount of the non-taxable part has not changed significantly between 1993 and 2003. A more significant change occurred in 2004, when the amount increased by 108.54%. After 2004, it increased slightly depending on the increase in the subsistence minimum, which was the basis for determining the non-taxable part of the tax base, namely 19.2 times the amount of the subsistence minimum. For 2009 and 2010 the method of calculating the non-taxable part of the tax base changed. The provision was a part of the 2-year anti-crisis package. According to this transitional provision, the non-taxable part of the taxpayer's tax base was an amount corresponding to 22.5 times the amount of the subsistence minimum applicable per year.
From 1 January 2020, the subsistence level increased to the amount of EUR 210.20, compared to 2019, when the subsistence level was EUR 205.07.
Since 2020 the non-taxable part of the tax base represents 21 times the amount of the subsistence minimum (EUR 4 414.20 per year).
If a taxpayer reaches the tax base higher than 100 times the applicable subsistence level, the non-taxable
part of the tax base represents the difference of 44.2 times the applicable subsistence level and one-quarter of the tax base. If this difference is zero or negative, the right to a non-taxable part of the tax base does not arise.
The non-taxable part of the tax base can be applied by the taxpayer to his/her spouse only if he/she lives with the taxpayer in the household and meets one of the following conditions: he/she took care of a dependent minor living with the taxpayer, receives a care allowance in the relevant tax period, has been included in the register of job seekers, is considered a citizen with a disability, or is considered a citizen with a severe disability.
Since 2004, a tax bonus on every dependent child (from birth up to 25 years of age) living in a household with a taxpayer has been applied. The taxpayer can reduce the calculated tax liability by the amount of the tax bonus. From 2019, the amount of the tax bonus also depends on the age of the child. In 2019, the annual tax bonus was EUR 465.57 per child under 6 years of age and EUR 266.04 from 6 years old. In 2020 the tax bonus increases by 17% per child under 6 years, and by 2.5% per child from 6 years of age. Table 4 shows the development of changes in the annual amount of the non-taxable part of the tax base for a spouse and the changes in the tax bonus from 2004 to 2019.
Table 4
Non-taxable part of the tax base for spouse and tax bonus for a dependent minor child for one calendar year (EUR)
Time Non-taxable part of the tax base for spouse
Tax bonus
2004 2 683.13 159.33
2005 2 918.94 165.97
2006 3 014.54 215.10
2007 3 173.87 218.08
2008 3 269.47 226.45
2009 4 025.70 235.92
2010 4 025.70 240.12
2011 3 559.30 243.18
2012 3 644.74 249.24
2013 3 735.94 254.64
2014 3 803.33 256.92
2015 3 803.33 256.92
2016 3 803.33 256.92
2017 3 803.33 256.92
2018 3 830.02 258.72
2019 3 937.35 266.04 or 465.57
Change 2004-2019 (EUR) +1 254.22 +106.71 or +306.24 Change 2004-2019 (%) + 46.74 % +66.94 or +192.20
Source: authors, based on Income Tax Act no. 595/2003 (Legislative and Information Portal of the Ministry of Justice of the Slovak Republic 2020)
72
In addition to the tax bonus for a child, the taxpayer can also apply a tax bonus on mortgage interest paid (since 2019).
Other non-taxable amounts by which the taxpayer can reduce the tax base are:
contributions for supplementary pension savings up to a maximum of EUR 180,
expenses for spas.
From 1993 to 2003, in the Slovak Republic, a progressive personal income tax was used. Its percentage rate increased with the amount of income.
The tax rate was used in the calculation of the income tax of employees, self-employed persons, and other self-employed persons. As of 1 January 2004, a flat tax was introduced, and its percentage rate was the same – 19%. However, from 1 January 2013, taxation again became progressive. The tax rate remained 19% for that part of the tax base that did not exceed 176.8 times the amount of the applicable subsistence minimum. For the part of the tax base exceeding 176.8 times the subsistence minimum, the tax rate became 25%.
Since 2013, there is also a so-called special rate of income tax on dependent activities of selected
constitutional officials (president, members of the government, deputies of the National Council of the Slovak Republic, chairman, and vice-chairman of the Supreme Audit Office) in the amount of 5%. The revenues of these constitutional officials are extra taxed at a special tax rate of 5%, in addition to the tax rate of 19% or 25%.
From 2017, dividends received by a natural person from sources abroad are taxed at a rate of 7% (from a contracting state) or at a 35% tax rate (from a non- contracting state).
From 2020, a 15% income tax rate is applied to the personal income tax base from business and other self- employed activities if the income does not exceed the amount of EUR 100,000. If the partial tax base exceeds EUR 100,000, the rate of 19% or 25% shall apply (Table 5).
Table 5
Personal income tax rates in Slovakia
Time Tax base (EUR) Tax rate
(%) 2004 to
2012
without limit 19
2013 did not exceed 34 401.74 19
exceeded 34 401.74 25
2014 to 2017
did not exceed 35 022.31 19
exceeded 35 022.31 25
2018 did not exceed 35 268.06 19
exceeded 35 268.06 25
2019 did not exceed 36 256.38 19
exceeded 36 256.38 25
2020 from business and other self-employed activity not exceeding 100 000
15
does not exceed 37 136.36 19
exceeded 37 136.36 25
Source: authors, based on Income Tax Act no. 595/2003 and its amendments (Legislative and Information Portal of the Ministry of Justice of the Slovak Republic 2020)
The highest income from personal income tax achieved in Slovakia was in 2019 in the amount of EUR 3.577 million. The lowest income was recorded in 2004 in the amount of 931 million. The income from personal income tax in the period 2004-2019 increased by EUR 2,646 million (by 284%). The highest share of personal income tax in total tax revenues was 201.1%
in 2018, and the lowest in 2004 was 11.92%. The highest amount of income per person in 2019 was EUR 1,032 (in 2004 it was EUR 504).
Corporate income tax (CIT)
The subject of the tax is a legal entity established for business and a legal entity not established for business but developing business activities to make a profit. The following legal entities are taxpayers of corporate income tax:
associations of natural and legal persons,
special-purpose property associations,
local government units,
other entities provided for by law.
The largest share of corporate income tax is paid to the state budget by the associations of natural and legal persons, cooperatives, and commercial companies (joint-stock company, limited liability company,
limited partnership, public trading company, a legal entity established under EU law) (Korečko et al. 2019). The classification of taxpayers into tax residents and tax non-residents is listed in Table 6.
Table 6
Classification of taxpayers according to the scope of tax liability in the Slovak Republic
A legal entity as a taxpayer of the Slovak Republic may have:
unlimited tax liability
↓ tax resident
A tax resident is any legal entity that has its registered office or place of actual management in the Slovak Republic.
↑
limited tax liability
↓ tax non-resident
A tax non-resident is any legal entity that does not have its registered office or place of actual
management in the Slovak Republic.
↑ The tax is calculated on income from
sources in the Slovak Republic and abroad
The tax is calculated on income from sources in the Slovak Republic
Source: authors, based on Income Tax Act no. 595/2003 (Legislative and Information Portal of the Ministry of Justice of the Slovak Republic 2020)
The corporate income tax is calculated on income from the activities of the taxpayer and the disposal of the taxpayer’s property. The law also defines those types of income that are not subject to tax, for example:
income earned by donation or inheritance,
profit share (dividend), to the extent that it is not a tax expense for the taxpayer paying this profit share,
acquisition of new shares and increase of the share in the registered capital from the retained earnings of a joint-stock company, a limited liability company, or a cooperative.
Since 2017, taxation of profit shares (dividends) has been re-taxed in some cases. If the profit share is used to acquire a legal entity (resident or non-resident) from a source in Slovakia, it is not subject to tax. If the profit shares are received from abroad from a non- Contracting State, the legal entity shall be taxed at a tax rate of 35%.
The tax base is the difference by which taxable income exceeds tax expenses while respecting the material and temporal connection of income and expenditure in the relevant tax period. The determination of the corporate income tax base in the double-entry bookkeeping system is based on the pre- tax profit (revenues minus costs). The profit is adjusted by addable and deductible items, so-called non-tax items that increase or decrease the tax base.
Items that increase profit or loss (non-tax- deductible expenses) include, for example:
representation expenses (except for expenditure on promotional items not exceeding EUR 17 per item),
deficiencies and damages more than the compensation received, except for damage caused by a natural disaster (e.g. floods, hail, avalanches, earthquakes) or caused by an unknown perpetrator,
a positive difference between accounting and tax depreciation of tangible fixed assets,
donations provided,
costs incurred for consumed fuels exceeding the limit specified in the technical certificate,
travel allowances granted exceeding the limit set by the Travel Allowances Act,
fines, penalties, and interest on arrears charged to expenses may reduce the tax base only after payment,
the cost of consultancy and legal services can reduce the tax base only after payment,
costs incurred in marketing, market research, obtaining standards and certificates can reduce the tax base only after payment, etc.
Items that reduce profit or loss (non-taxable income) include, for example:
a negative difference between accounting and tax depreciation of tangible fixed assets,
fines, penalties, and interest on arrears charged to income may increase the tax base only after collection,
income from which the tax is levied by deduction (withholding tax).
From 1 January 2019, the corporate tax expense is limited to a contribution provided for the recreation of an employee whose employment with the employer has lasted continuously for at least 24 months and if the employer has more than 49 employees. The contribution is a tax-deductible expense of 55% of the employee's recreation expenses, up to a maximum of EUR 275 per calendar year.
The tax base can be reduced by a tax loss during a maximum of four consecutive tax periods, up to a maximum of 25% of the accumulated tax loss.
The tax base can also be adjusted for tax relief in the following cases:
74
tax relief for recipients of investment aid,
a tax credit for the recipient of incentives for science and research,
automatic deduction of expenditure on science and research.
In the Slovak Republic, a compromise approach is applied in principle when determining the tax base. The starting point is the economic result found in the accounting records but adjusted outside the accounting for those costs and revenues (Table 7).
Table 7
Simplified procedure for calculating income tax payable
ACTIVITIES
INSIDE accounting OUTSIDE accounting
(revenues - costs) earnings before income tax +
items increasing the profit/loss -
items reducing the profit/loss +/-
items adjusting the tax base or tax loss
=
tax base (+) or tax loss (-) -
deduction of tax loss -
deduction of research and development costs
=
the tax base less the deduction of tax loss and research and development costs
x income tax rate
=
tax before applying tax relief -
income tax relief
=
income tax = earnings after tax income tax payable -
income tax advances paid
=
tax for payment / tax overpayment Source: authors
The tax rate is only one of the factors influencing the amount of taxation. Its level is often overrated. On the contrary, the psychological aspect of the tax rate is underrated. A good example, according to Mareca (2018), is the recent tax reform in the United States (reduction of corporate tax from 35% to 21%) and a significant reduction in corporate income tax in Hungary from 16% to 9% in 2017.
Tax rates have gradually changed during the 27 years of independent Slovakia's existence. It is almost unbelievable today that the system could operate in 1993 at a 45% corporate income tax rate (the subsequent taxation of profit shares was at 15%).
Between 1993 and 2002, the tax rate fell to 25%. The period after 2004 can objectively be considered the best set tax system. The business environment has also significantly improved. Structural reforms were
implemented, including the introduction of a flat tax of 19% (in the case of corporate income tax, personal income tax, and value-added tax). From 2013, the rate increased from 19% to 23%, a year later it decreased to 22%. In the years 2017 to 2019, the corporate income tax rate was 21%.
Since January 2020, the corporate income tax rate has been modified in the same way as for personal income taxation. The rate of corporate income tax from the tax base reduced by tax loss is from the year 2020:
15% in the case of a legal person whose income for the tax period does not exceed EUR 100,000,
21% in the case of a legal person whose income for the tax period exceeds EUR 100,000.
To ensure the even distribution of revenues flowing into the state budget, taxpayers defined
by law are obliged to pay advances on income tax during the tax period. A tax advance is a mandatory tax payment paid during a tax period if the actual amount of tax for that period is not yet known.
The obligation to pay advances on corporate income tax depends on the amount of tax for the previous year:
if the amount of tax for the previous year is more than EUR 2,500 and less than or equal to EUR 16,600, the taxpayer pays an advance quarterly of 1/4 of the tax for the previous year,
if the amount of tax for the previous year is higher than EUR 16,600, the taxpayer pays monthly advances in the amount of 1/12 of the tax for the previous year.
The highest share of corporate income tax in total tax revenues in 2016 was 20.19%, the lowest in 2004 was 14.06%. The highest-paid corporate income tax calculated per legal entity amounted to EUR 11,076 million in 2008, and the lowest was in 2013 (EUR 6,483 million).
C OMPARISON OF SELECTED DIRECT TAXES IN THE E UROPEAN U NION
Following a significant increase since 2010, income tax revenues in the EU-28 reached their maximum in 2018.
The euro area has followed a broadly similar trend. The structure of income or direct taxation varies considerably from one Member State to another. As regards the share of direct taxes in total tax revenues, Denmark has the highest share recently (up to 66%), followed by Ireland, the United Kingdom, Sweden, and
Malta, with proportions ranging between 40% and 50%
of total tax revenues (European Commission 2020).
It has been documented that corporate and personal income taxes, as well as employer's social contributions, have an impact on growth and investment in national economies. Corporate taxes affect the location of businesses and direct domestic and foreign investment. Income taxes and social contributions have a dominant position among direct taxes in all Member States in terms of collection volumes. For this reason, we have decided to analyze just selected indicators related to these taxes.
Table 8 shows the evolution of personal income tax (PIT) in the EU countries for the period 2010-2019.
The trend graph in the table shows that United Kingdom, Estonia, Spain, and Romania, in particular, recorded stable developments in tax revenue over the reporting period (the graphical representation of trend graphs is a more accurate representation of the differences between reporting years due to values without rounding; values shown in the table have been rounded to one decimal place). Highlighted bars in the trend graph represent the highest values of observed indicators in the monitored period. In case of the PIT, the development in individual countries in the last decade has differed significantly. France, Luxembourg, Poland, and Slovakia recorded growth in tax revenue.
The last column of the table shows the average annual growth coefficient (AAGR) of the analyzed indicator over the period. The EU average, in this case, shows a slight increase in the indicator (1.0106). Seven countries recorded a decline in the revenue from personal income tax (AAGR <1). Traditionally the highest level of PIT revenues tends to be recorded in the countries of northern Europe (Denmark, Sweden, Finland).
76
Table 8
Tax revenue (personal income tax) EU-28 (% of GDP)
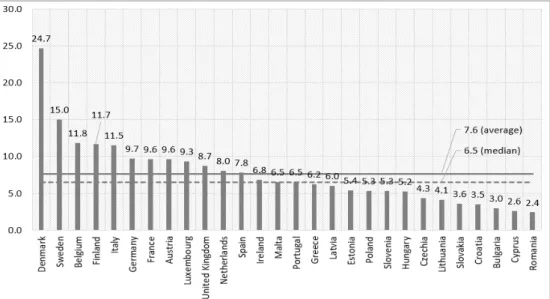
Source: authors, based on data from Eurostat (2021) Figure 1 shows the ranking of countries by volume of personal income tax revenue in 2018 (the year 2018 was chosen due to the availability of all data). The lowest revenue from the tax was reported in Romania
(2.4% of GDP) and Cyprus (2.5% of GDP), followed by Bulgaria, Croatia, and Slovakia, which did not exceed 4% of GDP. The median was 6.5% of GDP.
Source: authors, based on data from Eurostat (2021)
Figure 1. Ranking of EU countries according to PIT revenue in 2018 (% of GDP)
The EU-28 average of personal income tax revenue was 7.6% of GDP in 2018. Among the Member States, Denmark (24.7% of GDP) and Sweden (15.0% of GDP) collected the most on PIT in 2018. Compared to the reference year 2010, most of the countries have recorded an increase in the revenue generated by the
tax. Nine of the countries are below the zero axes, so their income from the tax has decreased. The greatest increase in the last 8 years was recorded by Greece and France (an increase of 2.2% and 1.8%, respectively), followed by Germany (+ 1.6%) (Figure 2).
Source: authors according to Eurostat (2021)
Figure 2. Personal income tax in 2010 and 2018 (% of GDP)
The highest rate of personal income tax at the beginning of 2019 for the EU-28 (simple average) was 39.4%, slightly higher than in 2017, when it was 39%.
Historically, this rate had been fallen most sharply from 47.2% in 1995 to 38% in 2009. Since that year, the average highest rate has risen to around 39% and has not changed significantly since 2013.
Table 9 shows the evolution of the corporate income tax in the Member States over the same reference period. In this case, as well, the development in individual countries looked different over the last decade. Most countries present a stable tax collection
rate. The average tax collection increased in the EU from 2.4% of GDP in 2010 to around 2.8% of GDP in 2019. The collection volume measured as a percentage of GDP is significantly lower in most Member States compared to the personal income tax. The only exceptions are Cyprus and Malta. The average growth coefficient (AAGR) shows relatively stable values for all EU countries in the last decade. The AAGR is lower than 1 in only five countries, which indicates an average decrease in the CIT over the reference period of 10 years.
78
Table 9
Tax revenue (corporate income tax) EU-28 (% of GDP)
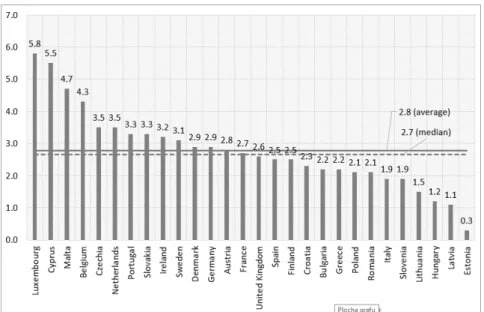
Source: authors based on data from Eurostat (2021) Figure 3 shows the ranking of countries according to the collection of the analyzed tax in 2018.
Source: authors, based on data from Eurostat (2021)
Figure 3. Ranking of EU countries according to CIT revenue in 2018 (% of GDP)
In terms of comparison with other member countries, Estonia recorded the lowest volume by far of corporate income tax collection in 2018, with the level of tax collection at 0.3% of GDP. Malta and Cyprus were above 5% of GDP. The EU average in 2018 was 2.8% of GDP. The median was one-tenth of a percent lower than the average.
In 2010, the average corporate income tax revenue in the EU-28 was 2.4% of GDP. In 2018, this average indicator increased to 2.8%. Compared to the reference year 2010, corporate tax collection increased in fifteen Member States, most notably in Belgium (+1.8%) and the Netherlands (+1.2%). On the other hand, Italy recorded the most significant decrease compared to the
reference year (a decrease of 0.4%). Malta (4.7% of GDP), Cyprus (5.5% of GDP), and Luxembourg (5.8%
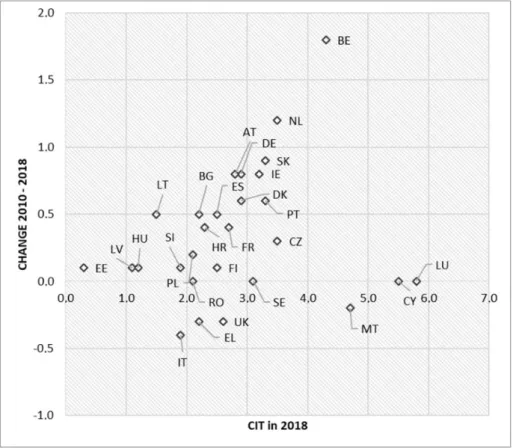
of GDP) recorded the highest corporate income tax revenues in 2018. The lowest amount was collected in 2018 by Estonia (0.3% of GDP). Figure 4 shows that in the case of CIT fewer of the Member States are below the zero axis than in the case of PIT. The others recorded an increase in tax revenues compared to the reference year 2010. Graphic representation largely confirmed the results of the average tax growth coefficient for the last decade in Table 9. However, the dispersion of the basic set of countries is smaller in terms of collection volume than in the case of personal income tax.
Source: authors based on data from Eurostat (2021)
Figure 4. Corporate income tax in 2010 and 2018 (% of GDP)
Table 10 shows the development of net social contributions (NSC) in the Member States over the last decade. In this case, most countries present themselves with a stable development of values over time. The
lowest income levies are imposed by Denmark, while the highest are found in France. Trend charts and the average growth coefficient show that the development of the social burden varies considerably across the EU.
80
Table 10
Net social contributions revenue in EU-28 (% of GDP)
Soure: authors according to Eurostat (2021)
Figure 5 shows the ranking of countries according to the collection of net social contributions in 2018.
Soure: authors according to Eurostat (2021)
Figure 5. Ranking of EU countries according to NSC revenue in 2018 (% of GDP)
Compared with other member countries, Denmark recorded the lowest by far volume of NSC collection in 2018 (0.9% of GDP). On the other hand, the highest amount of NSC was collected by France (18% of GDP), followed by Germany (17.1% of GDP). The median was six-tenths of a percent higher than the average.
The highest increase in net social contributions collection between 2010 and 2018 was recorded in Slovakia (+2.8%), followed by Poland (+2.2%), Romania (+2.1%) and Bulgaria (+2.0%). On the contrary, the most significant decline of the indicators was in Ireland (-1.5%) and Estonia (-1.2%) (Figure 6).
Source: authors according to Eurostat (2021)
Figure 6. Net social contributions in 2010 and 2018 (% of GDP)
C LUSTER ANALYSIS OF EXAMINED VARIABLES
Since high-dimensional data are clustered, the resulting clusters are high-dimensional geometrical objects, which are difficult to analyze and interpret. A low- dimensional graphical representation of the clusters could be much more informative than such a single value of the cluster validity, as one can cluster by eye and qualitatively validate conclusions drawn from clustering algorithms (Abonyi & Balázs, 2007).
The aim of cluster analysis in further research is to reveal mutual similarities or differences between the Member States based on further analysis of previous research data. Preceding quantitative and graphical analyses indicate differences in the development of selected tax indicators. Therefore, we decided to use another tool to analyze multidimensional data. Inputted data were data obtained from statistical reports, which are published annually on the website of the European
Commission (Taxation trends in the European Union, Eurostat Database).
The three variables (direct taxes indicators) input for 2018 (the year 2018 was chosen due to the availability of all data) were personal income tax (PIT), corporate income tax (CIT), and net social contributions (NSC). Two clustering methods were used, the hierarchical Ward’s method and the non- hierarchical K-means method. A significant part of these degrees of similarity is based on the calculation of the distance of objects. We have used the Euclidean distance defined by the formula:
𝑑𝑑𝑖𝑖𝑖𝑖 =�∑𝐾𝐾 (𝑥𝑥𝑖𝑖𝑖𝑖
𝑖𝑖=1 − 𝑥𝑥𝑖𝑖𝑖𝑖)2
where xik is the value of k variable for i-th object and xjk isthe value of k variable for j-th object. Once calculated the distance, then the rule of linking statistical units into clusters is determined.
Ward’s method is a “procedure for forming hierarchical groups of mutually exclusive subsets on
(1)
82
the basis of their similarity with respect to specified characteristics” (Ward 1963, p. 10).
The following clustering process using the K-means method consists of dividing n objects with m characters into k clusters so that the inter-cluster sum of squares is minimized.
The premise of cluster analysis is that the examined features do not correlate with each other. Spearman's correlation coefficient confirmed a low correlation
between variables (Table 11).
Table 11
Spearman's correlation coefficient
PIT CIT NSC
PIT 1.00000000 0.23643106 0.03586094
CIT 0.23643106 1.00000000 -0.06385317
NSC 0.03586094 -0.06385317 1.00000000
Source: authors
The result of clustering is a tree diagram (dendrogram). Each node represents one phase of the clustering process, the vertical axis represents the coefficients of proximity. With increasing distance
(differences in the values of clustering variables), objects that were completely different at the beginning of grouping also join into clusters (Fraley et al. 2012).
Source: authors
Figure 7. Cluster dendrogram according to Ward’s method
Figure 7 shows a cluster diagram created after entering three variables from direct taxes. There are four clusters of countries with similar characteristics:
1. France, Germany, Austria, Italy, Finland, Spain, the Netherlands, Portugal, Czechia, Slovakia, Belgium, Luxembourg;
2. Slovenia, Greece, Hungary, Poland, Croatia, Lithuania, Estonia, Latvia, Bulgaria, Romania;
3. Denmark, Sweden, Ireland, United Kingdom;
4. Cyprus, Malta.
The four clusters as the output of the hierarchical Ward clustering method determined four clusters for further clustering using the K-means method. (Figure 8)
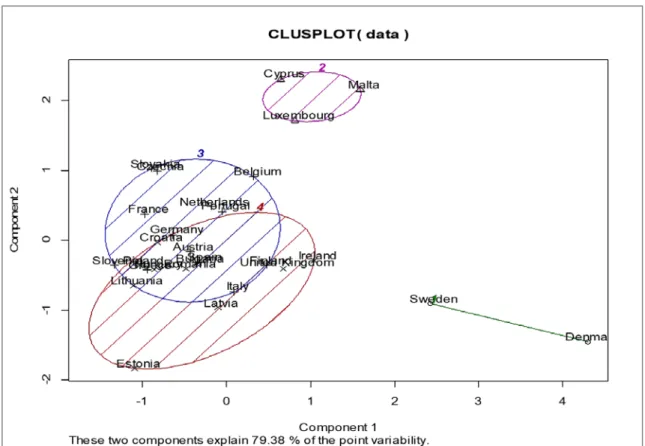
Source: authors
Figure 8. Scatterplot according to K-means method
For testing we have chosen 4 clusters as an imputed command for K-means clustering. We consider the data set, which contains n=28 objects, and partition it into k=4 clusters. The ellipses are based on the average and the covariance matrix of each cluster, and their size is such that they contain all the points of their cluster.
The ellipsis sizes of clusters 3 and 4 are very similar.
Cluster 4 displays less variability of Component 2. The larger shading intensity indicates the largest density of divided objects in ellipse.
The cluster analysis outlines potentially existing clusters competing for investment within the EU. It aimed to identify similarities between the Member States. If we consider two variables, we can visualize clusters using the non-hierarchical method of K-means.
It requires the analyst to indicate in advance the number of clusters extracted. In this case, the two variables explain 79.38% of the point variability of the set.
C ONCLUSIONS
Income tax reduces the disposable income of the entity burdened by it. The source of the tax payment is the income of economic entities operating in the national economy. In the Slovak Republic, natural and legal persons are taxed on income tax. In terms of the collection volume, income taxes are the most relevant direct taxes in Slovakia. Since the establishment of an independent state, with the changes of governments
and their value orientation, there have been changes in the taxation of income of the population as well as of entrepreneurs. The analysis of the development of income taxes in recent years in Slovakia has shown that entrepreneurs and individual citizens must constantly adapt to new regulations and measures.
The analyses performed revealed relatively high variability of the examined EU members in the case of income tax collection. Direct taxes are currently a more significant obstacle to the European internal market than indirect taxes. On the other hand, direct taxes have more diffuse effects. Income taxes as well as social contributions impact investment decisions, company formation, or employment in individual countries.
Differences in the volume of direct tax collection and the ongoing competition between the Member States in this area have a significant impact on economic developments in the various regions of Europe. It is questionable whether disparities between regions are widening or narrowing because of tax competition. Of course, investment decisions are affected by many other important factors. They do not depend solely on a country’s tax policy. National tax systems are (to some extent) an obstacle to the optimal distribution of production factors in the EU, which disadvantages and hampers European businesses, for example, compared with the United States. The differences in taxation confirm the comparison of selected taxes in the EU.
However, the cluster analysis suggests possible steps for future cooperation between the Member States.
Economic and political developments in the various
84
regions of Europe have had an impact on the issue of accepting the fiscal burden in countries, but this does not mean rejecting progressive ideas from a global perspective. The cluster analysis also revealed similar
developments in tax systems in terms of their geographical location in Europe. Therefore, it would be better to work together in clusters first than to try to apply uniform rules in all Member States at once.
References
ABONYI, J. & BALÁZS, F. (2007). Cluster Analysis for Data Mining and System Identification. Basel: Birkhäuser.
https://doi.org/10.1007/978-3-7643-7988-2
DOUMA, S. & KARDACHAKI, A. (2016). The Impact of European Union Law on the Possibilities of European Union Member States to Adapt International Tax Rules to the Business Models of Multinational Enterprises.
INTERTAX, 44(10), 746-754. Retrieved: December 2020: https://kluwerlawonline.com /journalarticle/Intertax/44.10/TAXI2016064
EUROPEAN COMMISSION (2020). Taxation Trends in the European Union, 2020 edition. Directorate-General for Taxation and Customs Union, European Commission, Publications Office of the European Union. Retrieved:
December 2020: https://op.europa.eu/en/publication-detail/-/publication/c0b00da7-c4b1-11ea-b3a4- 01aa75ed71a1/language-en?WT.mc_id=Selectedpublications&WT.ria_c=51677&
WT.ria_f=6180&WT.ria_ev=search
EUROSTAT (2021). Current taxes on income, wealth, etc. Retrieved: January 2021:
https://ec.europa.eu/eurostat/databrowser/view/tec00018/default/table?lang=en
FIĽARSKÁ, J., KOTULIČ R., KRAVČÁKOVÁ VOZÁROVÁ, I., IVANKOVÁ, V. & VAVREK, R. (2018). Pension reform in Slovakia and its influence on the future income of the population in the post productive age. Journal of Applied Economic Sciences, 13(3), 685-692.
FINANCIAL ADMINISTRATION OF THE SLOVAK REPUBLIC (2020). Výročné správy FS (Financial reports of the Financial Administration). Retrieved: December 2020: https://www.financnasprava.sk/sk/financna- sprava/vyrocne-spravy
FRALEY, CH., RAFTERY, A. E., MURPHY, B. T. & SCRUCCA, L. (2012). mclust Version 4 for R: Normal Mixture Modeling for Model-Based Clustering, Classification, and Density Estimation Technical Report No. 597.
Department of Statistics, University of Washington. Retrieved: January 2021:
https://www.researchgate.net/publication/257428214_MCLUST_Version_4_for_R_Normal_Mixture_Modeling_for _Model-Based_Clustering_Classification_and_Density_Estimation
GENSCHEL, P. & JACHTENFUCHS, M. (2018). How the European Union constrains the state: Multilevel governance of taxation. European Journal of Political Research, 50(3), 293-314. https://doi.org/10.1111/j.1475- 6765.2010.01939.x
HAKALOVA, J., PALOCHOVA, M., PSENKOVA, Y. & BIELIKOVA, A., (2018). Regulation of Czech Accounting and Taxes in the Context of European Accounting, Taxes and Ongoing International Harmonization. Proceedings of the 4th International Conference on European Integration 2018, 388-395.
JAKÚBEK, P. & TEJ, J. (2015). Reform of financial administration in the Slovak republic: reviews of participants.
Economic Annals – XXI. No. 5-6 (2015), s. 33-36.
KOREČKO, J., BAČÍK, R. & VOZŇÁKOVÁ, I. (2019). Public administration in EU: harmonization of income taxes.
Marketing and Management of Innovations, 2019(4), 280-291.
KOREČKO, J. & SUHÁNYIOVÁ, A. (2019). História, vývoj a regulácia daňového systému v Slovenskej republike (History, development and regulation of the tax system in the Slovak Republic). Prešov: Bookman.
LEGISLATIVE AND INFORMATION PORTAL OF THE MINISTRY OF JUSTICE OF THE SLOVAK REPUBLIc (2020). Income Tax Act no. 595/2003. Retrieved: December 2020: https://www.slov-lex.sk/pravne- predpisy/SK/ZZ/2003/595/
MARECA, R. (2018). 25 rokov daňového systému SR – podnikatelia kedysi platili 60 % dane (25 years of the Slovak tax system – entrepreneurs formerly paid taxes at the level of 60 %), Retrieved: December 2020:
https://www.danovecentrum.sk/aktuality/25-rokov-danoveho-systemu-sr--podnikatelia-kedysi-platili-60--percent- dane-aktualita-dc-3-2018.htm.
MINISTRY OF FINANCE OF THE SLOVAK REPUBLIC (2020a). Taxes, Customs and Accounting. Retrieved:
November 2020: https://www.mfsr.sk/en/taxes-customs-accounting/
MINISTRY OF FINANCE OF THE SLOVAK REPUBLIC (2020b). Verejná správa – konsolidované výsledky (Public Administration – Consolidated Results). Retrieved: November 2020: https://www.mfsr.sk/sk/financie/statne- vykaznictvo/specialny-standard/verejna-sprava-konsolidovane/
MINISTRY OF FINANCE OF THE SLOVAK REPUBLIC (2020c). Výsledky rozpočtového hospodárenia – príjmy a granty (Budgetary management results – income and grants). Retrieved: November 2020:
https://www.mfsr.sk/sk/financie/statne-vykaznictvo/specialny-standard/verejna-sprava-konsolidovane/
MINISTRY OF LABOUR, SOCIAL AFFAIRS AND FAMILY OF THE SLOVAK REPUBLIC (2020). Životné minimum (Subsistence minimum). Retrieved: December 2020: https://www.employment.gov.sk/sk/rodina-socialna- pomoc/hmotna-nudza/zivotne-minimum
NERUDOVÁ, D. (2004). Tax competition and tax harmonization in the European Union. Acta Universitatis Agriculturae et Silviculturae Mendelianae Brunensis, 52(6), 135-144. https://doi.org/10.11118/actaun200452060135 NIAZI, S.U.K. (2016). Tax Harmonization in the EU: Insights on Political and Legal Fusion under Neofunctional
Rationale. Journal of Politics and Law, 9(4), 15-29. http://dx.doi.org/10.2139/ssrn.2716904
PÎRVU, D. (2012). The Tax Harmonization in the European Union. In: Corporate Income Tax Harmonization in the European Union. Palgrave Macmillan Studies in Banking and Financial Institutions. Palgrave Macmillan, London.
pp. 8-24. https://doi.org/10.1057/9781137000910_2
PSENKOVA, Y. (2016). Comparison of tax burden of incomes from the dependent activity of employees in the Czech Republic and Slovak Republic in the context of globalization trends. 16th International Scientific Conference on Globalization and its Socio-Economic Consequences, 1832-1839.
WARD, J.H., Jr. (1963). Hierarchical Grouping to Optimize an Objective Function. Journal of the American Statistical Association, 58, 236-244. https://doi.org/10.1080/01621459.1963.10500845
86