Márta Bakucz University of Pécs, Hungary E-mail:bakucz.marta@ktk.pte.hu Ilona Cserháti Corvinus University of Budapest, Hungary E-mail:
ilona.cserhati@uni-corvinus.hu Tibor Keresztély Corvinus University of Budapest, Hungary E-mail:
tibor.keresztely@uni-corvinus.hu Gábor Michalkó Corvinus University of Budapest;
Geographical Institute, Research Centre for Astronomy and Earth Sciences, Hungary E-mail: gabor.michalko@uni-
corvinus.hu E-mail:
michalko.gabor@csfk.mta.hu
Keywords:
tourism, Hungarian senior travellers, types of spending, travel dimensions
Ageing is one of the main social crises of the developed world. Predicted longer life expectancy and rising health mean that travel is playing a more decisive role in the ageing generation’s attitude to leisure time – even after retirement. The current study analyses the steep rise in senior tourism using multivariable methods to explore the characteristics of tourism spending by the 65s living in Hungary. Using the Hungarian Central Statistical Office’s (HCSO) dissemination database for 2009 to 2018, this study explores the characteristics of tourism spending as well as the factors influencing spending for seniors and all travellers. The structure of spending is evaluated using 17 types of spending and 12 travel dimensions.
This study explores those factors that drive spending by Hungarian senior travellers that differ from those of average travellers.
Exploring the features influencing tourism spending by the elderly taking multi-day domestic trips, we find that people over 65 spent a higher proportion on food, souvenirs and on the use of travel agents. Comparative study of the dimensions and outputs of multi- day domestic trips found that four outputs generated a significant difference for all travellers and the elderly: those without a primary education (1), those living in settlements with between 2,000 and 5,000 inhabitants (2), those living in Heves County (3), and travellers to Veszprém County (4).
Introduction
Today, ageing is one of the most challenging societal challenges in the developed world (Wilkinson–Ferraro 2002, Illés 2013, Giczi 2017, Kulcsár–Brown 2017). The
declining fertility rate and increasing life expectancy are raising the average age of the population (Vargha 2015, Monostori–Gresits 2018, Uzzoli 2016). While these challenges burden the health and social security systems and make it difficult to finance their maintenance, they also lead to the emergence of many conflicts (e.g.
age discrimination) (Szelewa 2013, Kolos et al. 2018, Xiang 2018). One consequence of ageing is that the leisure industry, which is mainly designed to meet the needs of the young and middle-aged generations (i.e. the working age population), must now be able to provide a suitable alternative for the elderly (Törőcsik 2002, Hung–Lu 2016).
The quality of recreation fundamentally influences seniors’ well-being (Illés 2008, Michalkó et al. 2008, Kovács et al. 2018). In particular, travel is playing an increasingly important role in the leisure behaviour of the ageing generation – even after retirement (Alén et al. 2012, Zsarnóczky 2017, Patterson–Balderas 2020, Gyulavári–Ásványi 2019). The growing demand for travel from the elderly is a challenge for tourism professionals in several respects. First, it further burdens an already under-resourced labour market. Moreover, meeting the needs of specific age groups requires specially (re)trained human resources, while the ever-expanding range of tourism products must provide a supply that can be used by the elderly (EC 2014, Sedgley et al. 2011, Nikitina–Vorontsova 2015, Patterson 2017). At the same time, such tourism demand has several benefits: the quality-of-life-improving function of travel can increase longevity (relieving the burden on health insurance), generate revenue for the tourism industry (stimulating the economy), and reduce territorial disparities (developing regions lagging behind).
The present study examines the expansion of senior tourism by exploring the distinct features of tourism spending by those over 65 years using multivariate methods. Tourism spending is a decisive indicator of tourists’ attitudes influencing the efficacy (and thus income) of the tourism industry. Neither visitor nights nor visitor arrivals can reflect the potential of tourism or its contribution to gross domestic product (GDP) (Tóth–Tóth 2020); only acquiring information about tourism-related spending can provide a real picture of the characteristics of seniors’
attitude to tourism.
Problem statement
Tourism has become one of the most dynamically developing sectors in the world economy; in 2018, the growth in international tourism demand was 4.7% compared with 2017, its total contribution to GDP exceeded 10%, and per capita spending was approximately $1,000 annually (UNWTO 2019). In line with international trends, overseas tourist traffic to Hungary has long been growing, reaching 15 million trips in 2018; however, spending ($338/trip) remains significantly below the global average (UNWTO 2019). In addition to demand for registered accommodation, so-called “invisible” (or unregistered) tourism is also present in
Hungary (Volo–Giambalvo 2008, De Cantis et al. 2015). In 2019, Hungarians made 14.4 million trips and spent HUF 347.4 billion on travel within the country involving an overnight stay (HCSO 2019).
Spending by tourists is essential for maintaining and increasing the competitiveness of the tourism industry, but it also reflects the state of the economy and society. Although spending is influenced by many factors, information about their role is scarce. Therefore, to expand our knowledge of senior tourism, we examine which variables influence tourism behaviour by the older generation to facilitate sociopolitical decisions on seniors’ life quality and allow tourism-related destination management organisations to focus more on fulfilling seniors’ travel demand (Michalkó et al. 2011).
Theoretical background
While the issue of tourism spending is an under-studied field of research in the Hungarian literature, international studies have explored the factors influencing tourists’ spending. Although the HCSO has published quarterly data on the volume and characteristics of tourism spending by foreigners arriving in Hungary and Hungarian citizens participating in multi-day domestic trips since 2008, Hungarian researchers have only adopted traditional macroeconomic approaches (Jancsik 1999), provided analyses designed to improve the satellite account system (Hüttl–
Probáld 2000), and evaluated spending on invisible tourism (Kincses et al. 2016).
Among the international literature, previous analyses have focused on exploring (i) the (macro) impact of tourism spending on the tourism industry and the national economy (Mok 1985, Vukonic 1986, Lee et al. 1996) and (ii) the (micro) analysis of the characteristics of tourism that can be captured in a destination (Mok–Iverson 2000, Perez–Sampol 2000). Studies have examined the reasons for leisure shopping in a destination (Vukonic 1986, Skuras et al. 2006, Li–Ryan 2018), the factors influencing willingness to spend (Amir et al. 2015, Marrocu et al. 2015, Alrawadieh et al. 2019), and the relationships between the tourism behaviour and spending habits of different segments (Aguiló et al. 2017).
Reviewing the results of studies published between 1977 and 2012, Brida and Scuderi (2013) found that among the explanatory variables that affect tourism spending, researchers have focused on income, sociodemographic indicators, and travel characteristics, analysed using classical regression techniques. Bernini and Cracolici (2015) examined household expenditure in Italy between 1997 and 2007 and pointed out that although age has a negative effect on the travel decision itself, it has a positive effect on tourism spending. Alén et al. (2012) also found that the willingness of the elderly to spend while traveling is stronger than that during time at home. They also drew attention to the extreme heterogeneity of the senior generation, whose spending is influenced by various variables (e.g. motivation,
sociodemographic characteristics). Ward (2014), examining the Irish tourism market, found that retired widows’ travelling is inspired by their spiritual and religious motivation and that this segment can spend above the average income in some cases. In their study of Chinese senior tourism, Mahadevan and Fan (2020) recommended providing travel support for the elderly to both increase their quality of life and boost the economy.
Methodology
National and international research on tourism spending uses tourism-specific databases derived from local household surveys (Bernini–Cracolici 2015, Lin et al.
2015), surveys of the behaviour of foreign tourists (Mules 1998, Abbruzzo et al.
2014, Sharma et al. 2020), and the results of analyses using qualitative (Li–Ryan 2018), quantitative (Amir et al. 2015), and mixed methods (Vukonic 1986). As the studies aim to explore the factors influencing tourist behaviour, they address the explanatory variables and their correlations as well as their impact on the consumption habits of certain segments; hence, they often use regression analysis (Brida–Scuderi 2013, Sharma et al. 2020).
Our study uses the ‘Characteristics of Multi-Day Domestic Trips’ tables in the dissemination database of the HCSO for 2009 to 2018, broken down by year. This data set contains detailed data on multi-day domestic trips in Hungary. The data are broken down one variable at a time (i.e. no multidimensional stratification is possible). Further, the database contains variables aggregated by age group; thus, these are treated as quasi-micro-level observations. From this database, we first extracted the year of travel and age group of the traveller (A-type dimensions). We then extracted the following 12 B-type dimensions on the traveller in question:
1. Economic activity (total, in gainful occupation, unemployed, student, retired, other, inactive)
2. Educational attainment (total, below primary, primary, secondary, tertiary, unknown)
3. Mode of transport (total, car, bus, railway, aircraft, ship, bicycle)
4. Size of settlement (total, 0–1,999 inhabitants, 2,000–4,999 inhabitants, 5,000–9,999 inhabitants, 10,000–99,999 inhabitants, more than 100,000 inhabitants, Budapest)
5. Place of residence (total, each of the 19 counties, Budapest)
6. Motivation for the trip (total, holiday/rest, visiting relatives, school trip, health promotion, cultural event, hobby, official, sports, other)
7. Sex (total, male, female)
8. Type of accommodation (total, hotel, pension, campsite, tourist hostel, work holiday resort, paying hospitality, own holiday home, at relatives, no accommodation)
9. Length of stay (total, 1–3 nights, more than 4 nights)
10. Destination of the trip (total, each of the 19 counties, Budapest) 11. Destination of the trip by region (total, each of the nine tourist regions) 12. Use of a travel agency (total, yes, no)
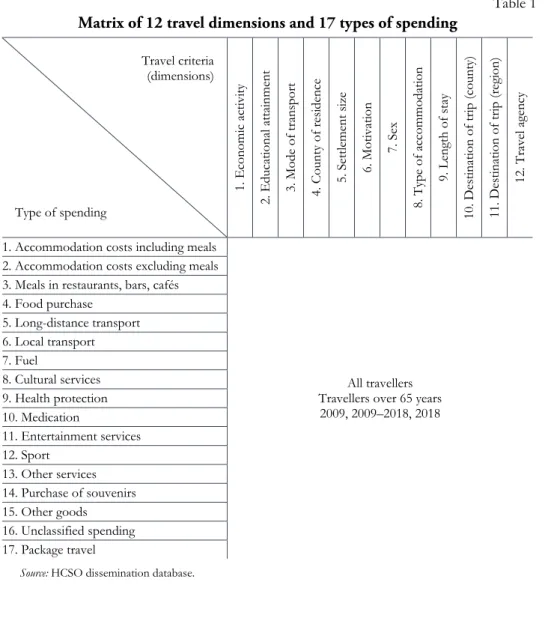
In addition, we collected information on the tourism spending of those participating in domestic multi-day trips and their type of spending grouped into 17 types (see Table 1) for the presented comparative analysis.
Table 1 Matrix of 12 travel dimensions and 17 types of spending
Travel criteria (dimensions)
Type of spending
1. Economic activity 2. Educational attainment 3. Mode of transport 4. County of residence 5. Settlement size 6. Motivation 7. Sex 8. Type of accommodation 9. Length of stay 10. Destination of trip (county) 11. Destination of trip (region) 12. Travel agency
1. Accommodation costs including meals
All travellers Travellers over 65 years 2009, 2009–2018, 2018 2. Accommodation costs excluding meals
3. Meals in restaurants, bars, cafés 4. Food purchase
5. Long-distance transport 6. Local transport 7. Fuel
8. Cultural services 9. Health protection 10. Medication
11. Entertainment services 12. Sport
13. Other services 14. Purchase of souvenirs 15. Other goods 16. Unclassified spending 17. Package travel
Source: HCSO dissemination database.
Analysis and results
To the best of our knowledge, this study is the first to provide a complete picture of the generational characteristics of the spending of those involved in domestic tourism, with special regard to spending by the elderly. As shown in Table 1, the structure of spending is examined along 17 types of spending and 12 travel dimensions over a 10-year time horizon using a relationship analysis toolkit selected based on the literature. We explore the criteria influencing the tourism spending of the older generation who took part in domestic multi-day trips between 2009 and 2018 as well as analyse the spending characteristics that are significantly different from those of all travellers.
The differences in the spending structures of the elderly and all travellers may be larger for certain dimensions. In the present analysis, we aim to detect those dimensions and their respective outputs where the spending structures between these two groups are the most similar and the most different to assess the causes of these significant differences. For each characteristic, we perform the comparison separately using Cramer’s V coefficient:
where k is the number of rows or columns, depending on which value is lower.
Cramer’s V is a statistical measure for measuring the relationship between two nominal variables; in this case, we quantify the extent to which belonging to an age group is decisive in shaping the expenditure structure of the group. The higher this value (between 0 and 1) is, the more different the spending structure is in the given dimension.
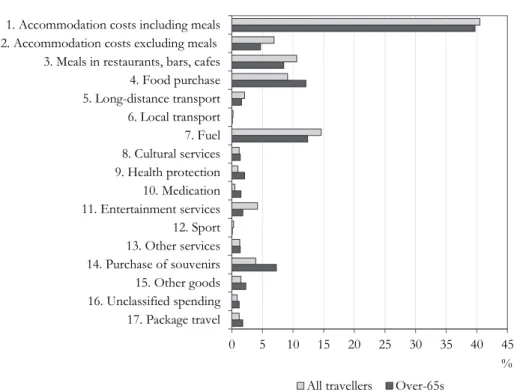
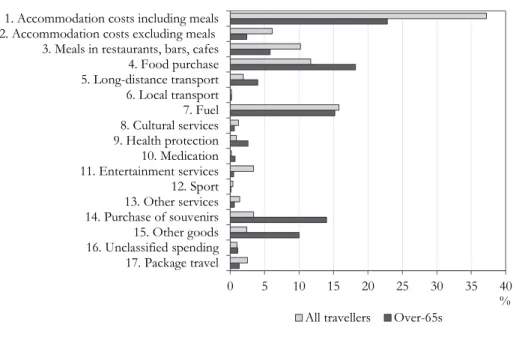
In the first step in our analysis, we compare the differences in tourist spending by seniors and all travellers in relation to the total population. Figure 1 shows the average for 2009, Figure 2 shows the average for 2009–2018, and Figure 3 shows the spending ratios for 2018 for both those over 65 years and all travellers. The role of the first type of spending (accommodation costs with paid meals) is decisive in all three cases. Its share increased during the study period from around 25% at the beginning of the period to 40% by 2018. In 2009, the proportion of spending by the elderly on accommodation costs with paid meals was still significantly different from the average; however, by 2018, this difference had almost completely disappeared. Further, during the study period, as expected, the importance of spending type 4 (purchasing food) decreased from 15% to 9% for all travellers and from 20% to 12% for the elderly. This may indicate that the domestic tourism demand of the Hungarian population has shifted towards more demanding, more convenient forms of recreation.
Figure 1 Proportion of tourism spending in Hungary, 2009
0 5 10 15 20 25 30
17. Package travel 16. Unclassified spending 15. Other goods 14. Purchase of souvenirs 13. Other services 12. Sport 11. Entertainment services10. Medication 9. Health protection 8. Cultural services7. Fuel 6. Local transport 5. Long-distance transport 4. Food purchase 3. Meals in restaurants, bars, cafes 2. Accommodation costs excluding meals
1. Accommodation costs including meals
% All travellers Over-65s
Figure 2 Proportion of average tourist spending, (in Hungary 2009–2018 average)
0 5 10 15 20 25 30 35
17. Package travel 16. Unclassified spending 15. Other goods 14. Purchase of souvenirs 13. Other services 12. Sport 11. Entertainment services 10. Medication 9. Health protection 8. Cultural services 7. Fuel 6. Local transport 5. Long-distance transport 4. Food purchase 3. Meals in restaurants, bars, cafes 2. Accommodation costs excluding meals
1. Accommodation costs including meals
% All travellers Over-65s
Figure 3 Proportion of tourism spending in Hungary, 2018
0 5 10 15 20 25 30 35 40 45
17. Package travel 16. Unclassified spending 15. Other goods 14. Purchase of souvenirs 13. Other services 12. Sport 11. Entertainment services 10. Medication 9. Health protection 8. Cultural services 7. Fuel 6. Local transport 5. Long-distance transport 4. Food purchase 3. Meals in restaurants, bars, cafes 2. Accommodation costs excluding meals
1. Accommodation costs including meals
% All travellers Over-65s
In the second step, we determined the value of the Cramer indicator for each section of our database. In other words, in each year, we performed the analysis on a given group according to a given dimension. For example, our first such section for 2009 is the group of travellers engaged in income-generating activities. In our database, this appears as two rows: the first shows the group of all travellers and the second shows the group of over 65s. The second section is the same as the first, only for 2010. The first 10 sections therefore refer to the first category (economic activity) of the first dimension (gainful occupation), only for different years. This is followed by the second category of the first dimension for all 10 years, and so on.
The dimension of our last section is whether the traveller used a travel agency;
within this, the last category is ‘no’ and the last year is 2018.
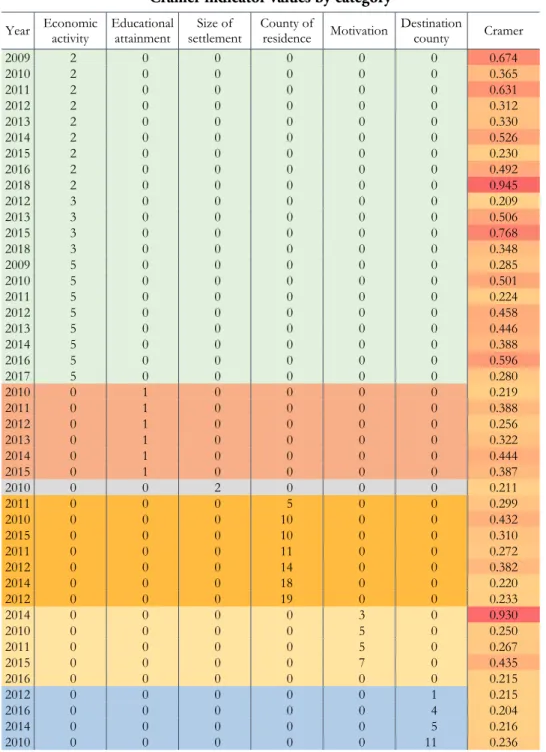
To know which sections show a significant difference in the spending structure of all travellers and those over 65 years, we focused on high Cramer values.
Although the indicator can in principle take values between 0 and 1, in our case a value above 0.2 was considered to be relatively high. Therefore, we narrowed our database to these cases (Table 2). The dimensions along which no Cramer values above 0.2 were found were omitted from the table. For simplicity, each section was shown in one row.
Table 2 Cramer indicator values by category
Year Economic activity Educational
attainment Size of
settlement County of
residence Motivation Destination county Cramer
2009 2 0 0 0 0 0 0.674
2010 2 0 0 0 0 0 0.365
2011 2 0 0 0 0 0 0.631
2012 2 0 0 0 0 0 0.312
2013 2 0 0 0 0 0 0.330
2014 2 0 0 0 0 0 0.526
2015 2 0 0 0 0 0 0.230
2016 2 0 0 0 0 0 0.492
2018 2 0 0 0 0 0 0.945
2012 3 0 0 0 0 0 0.209
2013 3 0 0 0 0 0 0.506
2015 3 0 0 0 0 0 0.768
2018 3 0 0 0 0 0 0.348
2009 5 0 0 0 0 0 0.285
2010 5 0 0 0 0 0 0.501
2011 5 0 0 0 0 0 0.224
2012 5 0 0 0 0 0 0.458
2013 5 0 0 0 0 0 0.446
2014 5 0 0 0 0 0 0.388
2016 5 0 0 0 0 0 0.596
2017 5 0 0 0 0 0 0.280
2010 0 1 0 0 0 0 0.219
2011 0 1 0 0 0 0 0.388
2012 0 1 0 0 0 0 0.256
2013 0 1 0 0 0 0 0.322
2014 0 1 0 0 0 0 0.444
2015 0 1 0 0 0 0 0.387
2010 0 0 2 0 0 0 0.211
2011 0 0 0 5 0 0 0.299
2010 0 0 0 10 0 0 0.432
2015 0 0 0 10 0 0 0.310
2011 0 0 0 11 0 0 0.272
2012 0 0 0 14 0 0 0.382
2014 0 0 0 18 0 0 0.220
2012 0 0 0 19 0 0 0.233
2014 0 0 0 0 3 0 0.930
2010 0 0 0 0 5 0 0.250
2011 0 0 0 0 5 0 0.267
2015 0 0 0 0 7 0 0.435
2016 0 0 0 0 0 0 0.215
2012 0 0 0 0 0 1 0.215
2016 0 0 0 0 0 4 0.204
2014 0 0 0 0 0 5 0.216
2010 0 0 0 0 0 11 0.236
In the last column in Table 2, the higher values are highlighted, with red indicating the strongest correlation (greatest deviation). In the rest of the table, the different colours divide the rows by dimensions. The economic activity dimension appears most often, suggesting that it is the most important factor in terms of the spending structure of the elderly. In the case of educational attainment, we find a significant difference in the spending structure of those over 65 and all travellers only for unskilled workers. Settlement size appears only in a single year and for a single category; therefore, this cannot be considered to be an important explanatory factor. Place of residence, on the contrary, results in a high Cramer value on several occasions, although other counties usually show an extremely high value in only certain years. Travel motivation and travel destination also have a significant effect on the difference in willingness to spend between the two groups.
Because the impact of the dimensions (and within those of each category) varies greatly from year to year, we focused on the average of the entire period instead of each year to improve clarity and understanding, thereby simplifying the task into a cross-sectional analysis. The resulting table became much smaller and more transparent; however, the annual average Cramer values fell slightly since the mean values are always less scattered, as one element of variability is eliminated from the calculation under this approach (internal variance). Accordingly, a lower limit was drawn and the sections producing the most plausible results were selected (Figures 4–7).
Figure 4 Proportion of tourism spending by those lacking a basic education
(in Hungary 2009–2018 average)
0 5 10 15 20 25 30 35 40
17. Package travel 16. Unclassified spending 15. Other goods 14. Purchase of souvenirs13. Other services12. Sport 11. Entertainment services9. Health protection8. Cultural services10. Medication 7. Fuel 6. Local transport 5. Long-distance transport4. Food purchase 3. Meals in restaurants, bars, cafes 2. Accommodation costs excluding meals1. Accommodation costs including meals
% All travellers Over-65s
For the first type of spending (accommodation costs with paid meals), we found a significant difference among the uneducated: the proportion of the indicator was 37% for all travellers, while it was only 23% for those over 65 years. Seniors in this category also spend relatively little on restaurant meals, but buy more food in stores.
In addition, all travellers pay a significantly higher proportion for other goods and services.
Figure 5 Proportion of tourism spending by residents of settlements of
2,000–5,000 inhabitants (in Hungary 2009–2018 average)
0 5 10 15 20 25 30 35 40
17. Package travel 16. Unclassified spending 15. Other goods 14. Purchase of souvenirs 13. Other services 12. Sport 11. Entertainment services 10. Medication 9. Health protection 8. Cultural services 7. Fuel 6. Local transport 5. Long-distance transport 4. Food purchase 3. Meals in restaurants, bars, cafes 2. Accommodation costs excluding meals
1. Accommodation costs including meals
All travellers Over-65s %
For people living in settlements with a population having between 2,000 and 5,000 inhabitants, older travellers tend to spend less on half and full board, while buying more food in stores. In this category, seniors also spend much less than the average on entertainment during their trips.
Figure 6 Proportion of tourism spending by residents of Heves County
(in Hungary 2009–2018 average)
0 5 10 15 20 25
17. Package travel 16. Unclassified spending 15. Other goods 14. Purchase of souvenirs13. Other services 12. Sport 11. Entertainment services10. Medication 9. Health protection8. Cultural services7. Fuel 6. Local transport 5. Long-distance transport4. Food purchase 3. Meals in restaurants, bars, cafes 2. Accommodation costs excluding meals
1. Accommodation costs including meals
All travellers Over-65s %
Figure 7 Proportion of tourism spending of travellers to Veszprém County
(in Hungary 2009–2018 average)
0 5 10 15 20 25 30 35
17. Package travel 16. Unclassified spending15. Other goods 14. Purchase of souvenirs13. Other services 12. Sport 11. Entertainment services9. Health protection10. Medication 8. Cultural services6. Local transport7. Fuel 5. Long-distance transport 4. Food purchase 3. Meals in restaurants, bars, cafes 2. Accommodation costs excluding meals
1. Accommodation costs including meals
All travellers Over-65s %
For travellers living in Heves County, people over the age of 65 spend less than all travellers not only on accommodation, but also on restaurant meals and fuel. On the contrary, the consumption basket of the elderly living here includes an above- average proportion of package holidays.
For holidaymakers in Veszprém County, there is a significant difference in the accommodation with meals cost type among all travellers and those over 65, as the elderly spend much less in this destination on registered accommodation offering meals. Similarly, they buy a much higher proportion of food from retailers.
Discussion and conclusion
Periodic pension increases and supplements are determined on the basis of the so- called consumer basket. Based on data from the HCSO, financial experts examine the extent to which the inflation rate (i.e. the change in the consumer price index) affecting pensioners differs from that affecting the remainder of the population (Kerékgyártó–Szabó 2004). Just as the difference between the general consumer price index and the one calculated for pensioners is based on the difference in the consumption structure, the differences in the structure of spending on domestic travel are driven by the characteristics of travel behaviour. According to the HCSO, an elderly person tends to spend less on raising children but more on medicine.1 However, are there such marked differences in the structure of spending on multi- day domestic travel? In Hungary, from 1998, all citizens over the age of 65 have been able to use public transport free of charge, which significantly reduces the costs of travel on Hungarian State Railways (MÁV) or VOLÁNBUSZ Transport Company Ltd. lines, thus providing an incentive to participate in domestic tourism (Somogyi–Michalkó 2016). However, it is not possible to reach all destinations by public transport and the inflexibility of timetables is another limiting factor; thus, among the costs of multi-days of domestic trips, even for the elderly, fuel is a relevant expense. Nonetheless, for all study periods under review (2009, 2009–2018, 2018), the fuel costs of the elderly are below the average of all travellers. Given the lack of no generation-specific price differences for accommodation and board, with the exception of special offers for the elderly mostly reducing seasonality, spending on registered accommodation can only be lowered by reducing the board (full board, half board, no board). However, such low budget tourism is barely used by the elderly; therefore, all travellers and the over-65s spend nearly the same proportion on accommodation combined with meals, even though the proportion spent on non-meal accommodation is much lower in both segments (demand for such facilities is slightly more modest among those over 65). Although the spending of the elderly on food purchases from retailers, which serves as the board of those
1 The methodology used by the HCSO to calculate the consumer price index (CPI) is available from
not using registered accommodation and supplements the board used in commercial and private accommodation, decreased significantly during the study period, people over 65 spent a higher proportion on food during their multi-day domestic trip than all travellers in all periods.
Two categories of spending show pronounced differences between all travellers and the elderly: spending on souvenirs and on the use of travel agents. The former can be attributed to travel socialisation and the latter to security. Today’s elderly entered the travel market at the dawn of the unfolding of mass tourism when the so-called prestige of souvenir shopping was greater than at present and the survival of this tradition is reflected in the examined indicator. The additional spending on travel agency services by the elderly is due to the lack the availability and use of digital booking systems. It is safer for those over 65 to book services for their multi- day domestic travel at travel agencies in person or by phone (possibly even cheaper because of the package price).
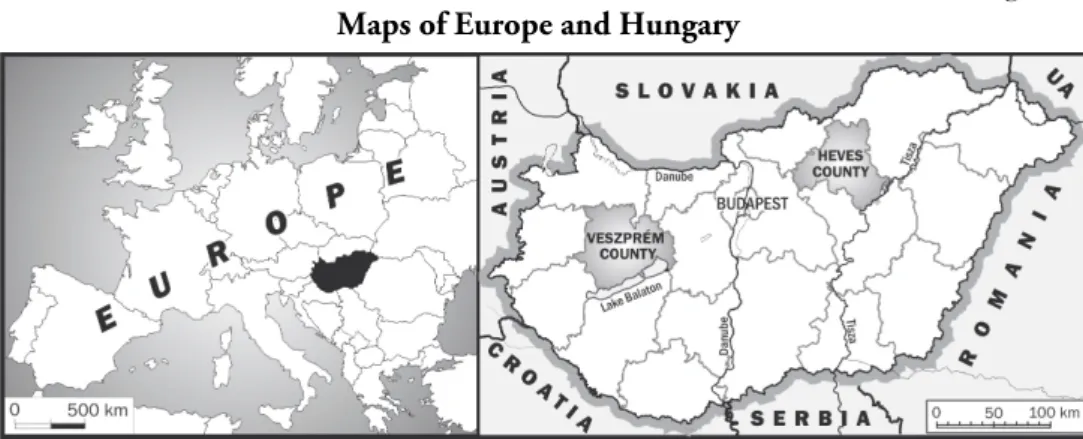
Figure 8 Maps of Europe and Hungary
Our comparative study of the dimensions and outputs of multi-day domestic trips found that four outputs generated a significant difference for all travellers and the elderly: those without a primary education (1), those living in settlements with between 2,000 and 5,000 inhabitants (2), those living in Heves County (3), and travellers to Veszprém County (4) (Figure 8). The difference is the most marked for those lacking a primary education, which is presumably due to the more modest retirement benefits resulting from a working career following a low education.
People over 65 in this segment spend much less on accommodation with meals, have a higher spending share on food purchased from retailers, and spend more on souvenirs and other goods (probably explained by the need for prestige, compensation, and purchase, but the reasons are not precisely known).
Second, for those living in settlements with between 2,000 and 5,000 inhabitants, the tighter financial resources, more modest travel experience related to having a
rural lifestyle, and constraints stemming from agricultural work may cause the differences in spending between all travellers and those over 65.
Third, residing in Heves County can explain the spending differences of the elderly in connection with multi-day domestic trips only as a result of the overlap of the first and second outputs; therefore, the region can be assumed to be a starting point for trips by those with a more moderate education and living in less populated settlements. However, this cannot be proven on the basis of the data available in this research and previous research findings.
Finally, Veszprém County as a tourist destination can create significant spending differences because the price range of registered accommodation operating on the northern coast of Lake Balaton is not tailored to the elderly’s budget. Therefore, travellers to that destination use alternative accommodation options (own property or accommodation offered by friends and relatives). This finding is supported by the nearly twice as high spending rate on food purchased from retailers (Nezdei 2020).
This study, which bridges a gap in both the national and the international literature, examined the differences present in the spending structure of all travellers and those over 65 along 17 spending types and 12 travel dimensions over 10 years (2009–2018). Analysing data available in the HCSO dissemination database, it revealed the significant changes in the proportions of spending types and highlighted the dimensions and their outcomes that most influence the perceived differences. During this decade, following the global financial crisis in 2008/2009, previous differences in the spending structure of all travellers and the elderly decreased significantly; thus, the 2018 indicator reflects an almost balanced picture.
The proportion of individual spending types can be primarily explained by people’s lack of education, the weakness of travel socialisation due to having a rural lifestyle, and the constraints of agricultural work as well as the accommodation available on the northern coast of Lake Balaton. Future study is essential, as the rich database available offers an opportunity for researchers to explain in detail the characteristics of the spending structure of elderly travellers using complex statistical analyses.
Although the database and methodology used in the current analysis can be considered to be novel in the literature dealing with senior tourism, several of its statements overlap with the results of earlier research (Alén et al. 2012, Patterson 2017, Mahadevan–Fan 2020); however, at the same time, they reflect Hungarian characteristics, too. Although sociodemographic variables, mainly the level of education and place of residence, evidently influence seniors’ tourism activity and thus their spending, the choice of destination also affects the tourism products and services purchased by seniors. Tourism-related measures (e.g. free travel) also foster the inclusion of the elderly generation in Hungary and therefore the increase of their life quality, whereas the level of pensions and travel habits explain that certain segments of senior tourism (e.g. family trips, visiting relatives, pilgrimages) are realised under the ‘umbrella’ of invisible tourism.
Acknowledgments
The authors received financial support through the project EFOP-3.6.2-16-2017-00017 titled ‘Sustainable, intelligent and inclusive regional and city models’ supported by the European Union and Hungary and co-financed by the European Social Fund. The authors thank the two reviewers for their helpful comments.
REFERENCES
ABBRUZZO, A.–BRIDA, J.–SCUDERI, R. (2014): Determinants of individual tourist expenditure as a network: Empirical findings from Uruguay Tourism Management.
43: 36–45. https://doi.org/10.1016/j.tourman.2014.01.014
AGUILÓ,E.–ROSSELLÓ,J.–VILA,M. (2017): Length of stay and daily tourist expenditure: A joint analysis Tourism Management Perspectives 21: 10–17.
https://doi.org/10.1016/j.tmp.2016.10.008
ALÉN,E.–DOMÍNGUEZ,T.–LOSADA,N. (2012): New opportunities for the tourism market – Senior tourism and accessible tourism. In: KASIMOGLU, M. (ed): Visions for global tourism industry – creating and sustaining competitive strategies pp. 139–166., InTech, Rijeka.
ALRAWADIEH, Z.–ALRAWADIEH, Z.–KOZAK, M. (2019): Exploring the impact of tourist harassment on destination image, tourist expenditure, and destination loyalty Tourism Management 73: 13–20.
https://doi.org/10.1016/j.tourman.2019.01.015
AMIR, S.–OSMAN, M.–BACHOK, S.–IBRAHIM, M. (2015): Understanding domestic and international tourists’ expenditure pattern in Melaka, Malaysia: result of CHAID analysis Procedia–Social and Behavioral Sciences 172: 390–397.
https://doi.org/10.1016/j.sbspro.2015.01.386
BERNINI, C.–CRACOLICI, M. (2015): Demographic change, tourism expenditure and life cycle behaviour Tourism Management 47: 191–205.
https://doi.org/10.1016/j.tourman.2014.09.016
BRIDA, J.–SCUDERI, R. (2013): Determinants of tourist expenditure: A review of micro- econometric models Tourism Management Perspectives 6: 28–40.
https://doi.org/10.1016/j.tmp.2012.10.006
DE CANTIS, S.–PARROCO, A.–FERRANTE, M.‒VACCINA, F. (2015): Unobserved tourism Annals of Tourism Research 50: 1–18. https://doi.org/10.1016/j.annals.2014.10.002 EC (2014): Europe, the best destination for seniors. – Facilitating cooperation mechanisms to increase
senior tourists’ travels, within Europe and from third countries, in the low and medium seasons.
Draft report. European Commission, Brussel.
https://ec.europa.eu/docsroom/documents/5977/attachments/1/translations/
en/renditions/native (downloaded: 24 August 2019)
GICZI,J. (szerk.) (2017): Ezüstkor: korosodás és társadalom Konferenciakötet. KSH, Budapest.
GYULAVÁRI,T.–ÁSVÁNYI,K. (2019): Szeniorturizmus. In: IRIMIÁS, A.–JÁSZBERÉNYI, M.–
MICHALKÓ, G. (szerk.): A turisztikai termékek innovatív fejlesztése pp. 126–136., Akadémiai Kiadó, Budapest.
HCSO – HUNGARIAN CENTRAL STATISTICAL OFFICE (2009–2018): Dissemination database http://statinfo.ksh.hu/Statinfo
HUNG,K.–LU,J. (2016): Active living in later life: An overview of aging studies in hospitality and tourism journals International Journal of Hospitality Management 53: 133–144.
https://doi.org/10.1016/j.ijhm.2015.10.008
HÜTTL, A.–PROBÁLD, Á. (2000): A szatellit számla szerepe a turizmus nemzetgazdasági szerepének meghatározásában Turizmus Bulletin 4 (1) 8–13.
ILLÉS,S. (2008): Szubjektív vélekedések a sikeres öregedésről. In: GRÁBICS,Á. (szerk.): Aktív időskor: tanulmánykötet a 2008. április 3-án megrendezett Aktív öregedés konferencia előadásaiból pp. 70–79., Szociális és Munkaügyi Minisztérium, Központi Statisztikai Hivatal, Budapest.
ILLÉS,S. (2013): Időskori nemzetközi migráció: magyar eset Tullius Kiadó, Budapest.
JANCSIK,A. (1999): Turisztikai bevételek és kiadások Magyarországon, valamint ezek várható alakulása az Európai Unióhoz való csatlakozás után Turizmus Bulletin 3 (1): 10–18.
KERÉKGYÁRTÓ,GY-NÉ–SZABÓ,É. (2004): A nyugdíjasok és a fogyasztói árindex Statisztikai Szemle 82 (1): 31–43.
KSH (2019): Helyzetkép a turizmus, vendéglátás ágazatról, 2018.
https://www.ksh.hu/docs/hun/xftp/idoszaki/jeltur/jeltur18.pdf (downloaded: 10 September 2019)
KINCSES, Á.–TÓTH, G.–TÖMÖRI, M.–MICHALKÓ, G. (2016): Az átutazó turizmus magyarországi sajátosságai, különös tekintettel a költésre Területi Statisztika 56 (4):
455–476. https://doi.org/10.15196/TS560404
KOLOS, K.–KENESEI, ZS.–KISS, K.–KOVÁCS, E.–MICHALKÓ, G.–PINKE-SZIVA, I. (2019):
Generációk közötti interakciók a turizmusban: a kor-alapú sztereotípia hatása. In:
CSAPÓ J.–GONDA, T.–RAFFAY, Z. (szerk.): Turizmus, fogyasztás, generációk. II.
Nemzetközi Turizmus Konferencia, Tanulmánykötet pp. 45–56., Pécsi Tudományegyetem, Pécs.
KOVÁCS,G.–ACZÉL,P.–BOKOR,T. (2018): Magyar egyetemisták vélekedései az idősekről Jel- Kép 3: 62–93. https://doi.org/10.20520/JEL-KEP.2018.3.63
KULCSÁR,J.L.–BROWN,D. (2017): Population ageing in Eastern Europe: Toward a coupled micro-macro framework Regional Statistics 7 (1): 115–134.
https://doi.org/10.15196/RS07107
LEE,CH.–VAR,T.–BLAINE, T. (1996): Determinants of inbound tourist expenditures Annals of Tourism Research 23 (3): 527–542.
https://doi.org/10.1016/0160-7383(95)00073-9
LI,F.–RYAN,CH. (2018): Souvenir shopping experiences: a case study of Chinese tourists in North Korea Tourism Management 64: 142–153.
https://doi.org/10.1016/j.tourman.2017.08.006
LIN,V.–MAO,R.–SONG,H. (2015): Tourism expenditure patterns in China Annals of Tourism Research 54: 100–117. https://doi.org/10.1016/j.annals.2015.07.001
MAHADEVAN, R.–FAN,S. (2020): The Nexus between Seniors’ Tourism Expenditure and Well-being: Case Study of China Tourism Analysis 25 (1): 169–174.
https://doi.org/10.3727/108354220X15758301241620
MARROCU, E.–PACI, R.–ZARA, A. (2015): Micro-economic determinants of tourist expenditure: a quantile regression approach Tourism Management 50: 13–30.
https://doi.org/10.1016/j.tourman.2015.01.006
MICHALKÓ, G.–KISS, K.–KOVÁCS, B. (2008): A szürke párduc útra kel: az időskorúak utazásainak szerepe szubjektív jólétük tükrében. In: GRÁBICS,Á. (szerk.): Aktív időskor: tanulmánykötet a 2008. április 3-án megrendezett Aktív öregedés konferencia előadásaiból pp. 80–98., Szociális és Munkaügyi Minisztérium, Központi Statisztikai Hivatal, Budapest.
MICHALKÓ, G.–RÁTZ, T.–TÓTH, G.–KINCSES, Á.–BENKŐ, B. (2011): Research on the quality of life in the spa towns of Hungary Regional Statistics 1 (1): 64–79.
MOK,H. (1985): Tourist expenditures in Guangzhou, PR China Tourism Management 6 (4):
272–279. https://doi.org/10.1016/0261-5177(85)90003-2
MOK,C.–IVERSON,T. (2000): Expenditure-based segmentation: Taiwanese tourists to Guam Tourism Management 21 (3): 299–305.
https://doi.org/10.1016/S0261-5177(99)00060-6
MONOSTORI, J.–GRESITS, G. (2018): Idősödés. In: MONOSTORI, J.–ŐRI, P.–SPÉDER, ZS. (szerk.): Demográfiai Portré pp. 127–145., KSH Népességtudományi Kutatóintézet, Budapest.
MULES,T. (1998): Decomposition of Australian tourist expenditure Tourism Management 19 (3): 267–271. https://doi.org/10.1016/S0261-5177(98)00014-4
NEZDEI, CS. (2020): The prospects of regional market place developments in economic geographical perspective Case study of Balaton Resort Area, Hungary Regional Statistics 10 (2): 142–165. https://doi.org/10.15196/RS100206
NIKITINA,O.–VORONTSOVA,G. (2015): Aging Population and tourism: Socially determined model of consumer behavior in the "senior tourism" segment Procedia – Social and Behavioral Sciences 214 (5): 845–851.
https://doi.org/10.1016/j.sbspro.2015.11.736
PATTERSON,I. (2017): Tourism and leisure behaviour in an ageing world CABI, Wallingford.
PATTERSON,I.–BALDERAS,A. (2020): Continuing and emerging trends of senior tourism: A review of the literature Journal of Population Ageing 13: 385–399.
https://doi.org/10.1007/s12062-018-9228-4
PEREZ, E.–SAMPOL, C. (2000): Tourist expenditure for mass tourism markets Annals of Tourism Research 27 (3): 624–637.
https://doi.org/10.1016/S0160-7383(99)00101-2
SEDGLEY,D.–PRITCHARD,A.–MORGAN,N. (2011): Tourism and ageing: a transformative research agenda Annals of Tourism Research 38 (2): 422–436.
https://doi.org/10.1016/j.annals.2010.09.002
SHARMA, A.–WOODWARD, R.–GRILLINI, S. (2020): Unconditional quantile regression analysis of UK inbound tourist expenditures Economics Letters 186: 108857.
https://doi.org/10.1016/j.econlet.2019.108857
SKURAS,D.–DIMARA,E.–PETROU,A. (2006): Rural tourism and visitors’ expenditures for local food products Regional Studies 40 (7): 769–779.
https://doi.org/10.1080/00343400600660771
SOMOGYI,B.–MICHALKÓ,G. (2016): A regisztrált láthatatlanok: az időskorúak vasúti utazási magatartásának vizsgálata Magyarországon Földrajzi Közlemények 140 (1): 41–54.
SZELEWA,D. (2013) Demográfiai kihívások Európában. Az alapvető problémák áttekintése, különös tekintettel Kelet-Közép-Európára Friedrich Ebert Stiftung, Warsaw.
http://www.fesbp.hu/common/pdf/demographic_challenges.pdf (downloaded: 10 September 2019)
TÓTH,T.–TÓTH,G. (2020): A hazai turizmus néhány feltáratlan területe Turizmus Bulletin 20.
(Különszám): 53–63. https://doi.org/10.14267/TURBULL.2020v20n4.5 TÖRŐCSIK,M. (2002): Szeniorok, mint célcsoport(ok) Marketing és menedzsment 36 (3): 40–48.
UNWTO (2019): Tourism highlights 2018 UNWTO, Madrid.
UZZOLI, A. (2016): Health inequalities regarding territorial differences in Hungary by discussing life expectancy Regional Statistics 6 (1): 139–163.
https://doi.org/10.15196/RS06108
VARGHA,L. (2015): A társadalmi öregedés hagyományos és alternatív indikátorai Demográfia 58 (1): 57–78.
VOLO, S.–GIAMBALVO, O. (2008): Tourism statistics: methodological imperatives and difficoulties – The case of residential tourism in Island communities Current Issues in Tourism 11 (4): 369–380. https://doi.org/10.1080/13683500802140398 VUKONIC,B. (1986): Foreign tourist expenditures in Yugoslavia Annals of Tourism Research
13 (1): 59–78. https://doi.org/10.1016/0160-7383(86)90057-5
WARD, A. (2014): Segmenting the senior tourism market in Ireland based on travel motivations Journal of Vacation Marketing 20 (3): 267–277.
https://doi.org/10.1177/1356766714525775
WILKINSON,J.–FERRARO,K. (2002): Thirty years of ageism research. In: NELSON,T. (ed.):
Ageism – Stereotyping and Prejudice against Older Persons pp. 339–358., MIT Press, London.
XIANG,Z. (2018): From digitization to the age of acceleration: On information technology and tourism Tourism Management Perspectives 25: 147–150.
https://doi.org/10.1016/j.tmp.2017.11.023
ZSARNÓCZKY, M. (2017): Developing senior tourism research Pannon Management Review 6 (3–4): 201–213.