The impact of the 2008 economic and financial crisis on the public spending devoted to social protection in
the EU
Ágnes OROSZ
*Abstract
This paper analyses the trends of general government expenditures in the European Union. Government expenditure has increased considerably in all industrialized countries since 1870. Although this increase has not been equal in all countries, it is nevertheless remarkable that despite institutional differences, growing public spending has been a general phenomenon. The long-term trends of general public spending in the European Union shows us that, after a short period of decreasing general government expenditure, any external economic shock might significantly increase public spending. During the analysed time periods the highest share of public spending is devoted to social protection. Well-functioning systems of social protection increase spending in times of recession, and scale it back as the economy recovers, therefore the welfare state can operate as an effective “automatic stabilizer”. The paper also tests which EU member states’ welfare systems have been able to function as an automatic stabilizer.
Keywords: general government expenditures, social protection, automatic stabilizer function
Introduction
The financial and economic crisis of 2008 has significantly changed the general government landscape of the world, which draws our attention to the examination of the topic. It is important to examine government activity because governments play a crucial role in economies through their activities in providing public services, in re-distributing income and by limiting the volatility of business cycles through automatic stabilizers as well as possibly through active fiscal policy.
The way in which they finance themselves (taxation, borrowing) and the size, pattern and function of their expenditure have major impacts on other economic actors
*Ágnes OROSZ is assistant professor at the National University of Public Service; Budapest, Hungary and Research Fellow, Institute of World Economics, Centre for Economic and Regional Studies of the Hungarian Academy of Sciences; e-mail: oroszagnes@uni-nke.hu.
(Wahrig and Gancedo Vallina, 2011). In the paper, the major emphasis is on expenditure analysis.
The post-World War II period and particularly the period between 1960 and 1980 brought an unprecedented impetus of government involvement in the economy.
The 1960-1980 period could be characterized as the golden age of public sector intervention (Tanzi, 1997). After this golden age period, the trend has significantly changed. Since the 1980s public spending has been growing at a slower pace and has even declined in some countries. “During the 1980s, governments had to face the unpleasant reality that it is far easier to increase benefits (such as pensions and wages) than reduce them; or to hire civil servants than to fire them” (Tanzi and Schucknecht, 2000, p. 18)
In general, the size of governments reached unprecedented dimensions by the 1990s, although the growing importance of the general government was mostly typical for Europe (Muraközy, 2010). Increasing levels of taxation and public spending have been a long-term trend for about 150 years. Public spending as a proportion of GDP has risen steadily, in line with economic growth (Hall, 2011).
This long-run relationship is known as “Wagner’s Law”, named after the economist who first described the process. Adolph Wagner (1883) formulated a “Law of expanding state expenditures”, highlighting the growing importance of government activity and expenditures as an inevitable feature of a “progressive” state.
The public spending long-term trend of growing relatively to national income has become a rarely questioned general thesis (Atkinson and Stiglitz, 1980). A modern formulation of Wagner’s “law” was proposed by Bird (1971): as per capita income rises in industrialized nations; their public sectors will grow in relative importance. Bird’s (1972) modified hypothesis claims that, in a crisis, public expenditure declines more slowly than per capita income. Consequently, it means that the ratio of public expenditure to GDP increases and the opposite happens in time of economic upturns. A significant share of general government expenditures are devoted to social protection and health, so it can be concluded that the welfare state works primarily via the so-called automatic stabilisers, especially in time of economic shocks. The welfare state might thus be effective in cushioning the economy from shocks and in diversifying these shocks (Andersen, 2012).
The empirical literature testing Wagner’s Law validity is extensive but inconclusive in many cases. There are mixed results both at the individual country level and at the cross country level. The correlation between per capita income and government size has been frequently found in both longitudinal and cross-sectional data in both historical and current periods (Shelton, 2007). More recent research utilising advanced econometrics shows a not very strong positive relationship (Arpaia and Turrini, 2008). Durevall and Henrekson (2011) provide a comprehensive summary of the empirical findings regarding the validity of Wagner’s Law. Up until the early 1990s, empirical studies mainly found strong support with few exceptions. Since then, very mixed results have been published,
about one third of them fails to find evidence for Wagner’s Law, while the other third obtains support by controlling for other variables (e.g. demographic variables) or focusing on specific types of expenditures, and the remaining part shows unqualified support for the hypothesis (Shelton, 2007).
Based on Wagner’s (1883) explanation, there are three main reasons for increased government involvement. Durevall and Henrekson (2011) summarized them as the following. First, economic development creates an increasingly complex society in which the need for public protective and regulative activity would grow. Second, economic growth in real income would facilitate the relative expansion of cultural and welfare expenditures (better education and health services). Finally, industrialisation and changes in technology required the government to increase spending on the management of natural monopolies in order to enhance economic efficiency.
In 2016, general government expenditure amounted to 46.6% of EU28 GDP, showing a salient increase after the outbreak of the financial and economic crisis.
Since 2008, only a slight decrease can be observed as a result of economic recovery.
The paper analyses trends in the level and structure of general government expenditure breakdown by their socio-economic function. It is remarkable that despite institutional differences, growing public spending has been a general phenomenon. The long-term trends of general public spending in the European Union shows us that any external economic shock might significantly increase public spending after a short period of decreasing general government expenditure.
The main research questions of the article are the following: What are the major trends of general government expenditures in the European Union? How have social protection benefits developed? Under which circumstances are welfare states able to operate as effective automatic stabilisers? Taking into account the theoretical framework outlined above and the key research questions, we can identify some hypotheses. First, there is no unidirectional trend of general government expenditures in the European Union and any external economic shock might significantly increase public spending. Second, spending on social protection has reached new peaks due to the outbreak of the financial and economic crisis. Since the main task of the welfare state is to mitigate the negative effects of the crisis, the final hypothesis states that a well-functioning welfare system might operate as an effective “automatic stabiliser” if budgetary decisions are not subordinated to fiscal austerity.
The data came from two sources. First, Eurostat collects data on government expenditure by function according to Classification of Functions of Government (COFOG) which makes it possible to compare expenditures on different activities across European countries over time. Second, the analysis of social spending in real terms is possible only by using OECD SOCX data.
The structure of the article is as follows. The next section presents a detailed overview of the evolution of general government spending trends in the European Union. The paper also links general government expenditures to the level of economic development in order to identify different country groups, welfare state clusters for the
examined time periods. These are followed by the analysis of the structure of general government expenditures breakdown by their socio-economic function. In order to test the automatic stabiliser function the paper compares changes in real public social spending and real GDP for the period of 2007/08 and 2012/13. The main findings are summarized in “Results and discussion” part.
1. Trends of general government expenditures in the European Union
General government expenditures consist in expenditures of central, state and local governments and social security funds. Examining general government expenditures as a share of GDP for 1995, it can be observed that it is 37 per cent in the United States (OECD, 2009), while the same indicator is notably higher for the EU25, 49 per cent, and even higher for the EU21 which is 51 per cent based on Eurostat general government expenditure data. 1995 is the starting year of our sample period, as this year provides the earliest though not complete available data.
For the EU27, general government expenditure, including central, state and local governments and social security funds amounted to around 3700 billion euro in 1995, or 47.1% of GDP. From the 1990s until the outbreak of the financial and economic crisis, general government expenditures were significantly reduced due to government efforts and dynamic economic growth (Muraközy, 2010).
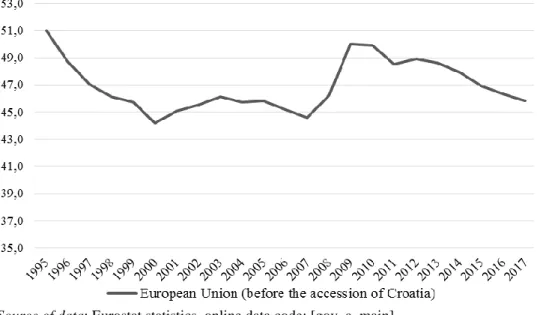
Figure 1. Average general government expenditures in the EU (percentage of GDP), 1995-2017
Source of data: Eurostat statistics, online data code: [gov_a_main]
Note: Average general government expenditure data for EU27 and EU28 equal each year.
Figure 1 demonstrates that until 2000 a sharp decline of general government spending reduction took place throughout the European Union. Between 2000 and 2007 a short slight increasing period was followed by a modest decline. During the first two years of the financial and economic crisis, general government expenditures were increased, partly due to the shrinking GDP. The average level of general government expenditure in the EU28 started its new downward trend in 2009 and since then continuous decline can be observed.
The dispersion of general government expenditures can be measured by coefficient variation which enables us to examine whether there is convergence between the member states of the European Union or not. The coefficient variation of the variable decreased from 19% in 1995 to 10% in 2009. This convergence process intensified especially right before the outbreak of the financial and economic crisis. The coefficient variation of the variable reached 16% in 2016 after annual gradual increase.
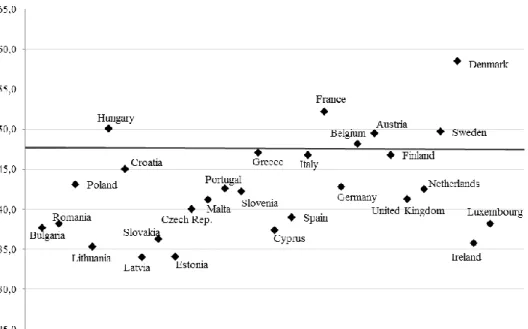
Linking general government expenditures to the level of economic development, in 1995, several country groups (welfare state regimes)1 can be identified on the chart (Figure 2). In 1995, general government expenditure amounted to 47% of GDP in the EU27 with relatively high variation of the values.
Below the mean value, three country groups can be recognized. The first group among the Central and Eastern European member states (with low level of general government spending) constitute the Baltic and Balkan countries. Similarly, low levels of public spending accompanied by higher economic development characterize Mediterranean countries (Greece, Spain, Portugal, Malta and Cyprus).
In the case of the Anglo-Saxon EU member states, a lower level of general
1 In order to highlight the differences among the social policy models, Sapir (2006) suggested the following four different clusters for Europe. (1) The Nordic countries: Denmark, Finland, Sweden and the Netherlands represent the highest levels of social protection expenditures and universal welfare provision with active labour market policy instruments (social democratic model in Esping-Andersen’s (1990) typology). (2) Anglo-Saxon countries:
Ireland and the United Kingdom feature a relatively large social assistance of the last resort and salient activation measures (liberal model in Esping-Andersen’s typology). (3) Continental countries: Austria, Belgium, France, Germany and Luxembourg rely extensively on insurance-based, non-employment benefits and old-age pensions (corporatist-statist or conservative model in Esping-Andersen’s typology). (4) Mediterranean countries: Greece, Italy, Portugal and Spain concentrate mainly on old-age pension and allow the high segmentation of welfare entitlements. Central and Eastern European countries constitute a separate cluster, because the countries of this region have been in a transitional state with a wide diversity of situations, whose definitive characteristics are not yet clearly specified.
However, Aidukaite (2004, 2011) argues that post-communist European countries form a singular welfare state type because of their distinct institutional similarities. Farkas (2011, p.
419) concluded that it is relevant to treat the Central and Eastern European countries as a distinct welfare state regime, because their distinctness from the other models is stronger than the differences within the model.
government spending is accompanied by a higher level of economic development.
Luxembourg is an outlier, i.e. the most advanced economy within the EU with a relatively low level of the given variable. In this regard, Italy resembles more to the Continental countries.
The Visegrad region and Slovenia show above-average levels of general government spending even though these countries have a relatively low level of economic development, their public spending level being similar to the Continental group of countries (Italy, France, Belgium, the Netherlands, Austria and Germany).
Nordic countries (Finland, Sweden and Denmark) have the highest levels of general government spending in 1995.
Figure 2. General government expenditures (percentage of GDP), 1995
Source: Eurostat statistics, online data code: [gov_a_main], according to Muraközy (2010) Note: x-axis: ranking according to economic development (GDP per capita)
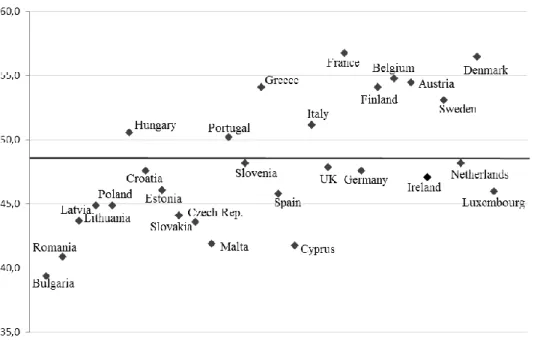
This peak of general government expenditures in 1995 was followed by a progressive decrease until 2007, which can be treated as another significant turning point of the trend. The level of general government spending of EU28 decreased, amounted to 42.5% on average with a low coefficient variation (roughly 12%). In 2007 the distinct welfare state regimes cannot be as clearly identified as in 1995 (Figure 3).
The reduction of general government spending among the Visegrad countries, except Hungary, is noteworthy. Balkan and Baltic countries can be characterized by below the average level of public spending but with marked differences in their level
of economic development. Hungary, Poland and Croatia can be grouped together based on their level of economic development and above average public spending.
Slovakia and the Czech Republic have a higher level of economic development and their level of public spending is below the mean value. In general, public spending decreased, the variation within the Mediterranean group has increased, and general government spending is above the average for Greece and Italy. Contrary to the general trend and ideas on the liberal model, in the Anglo-Saxon countries (the UK and Ireland), general government expenditures increased.
Figure 3. General government expenditures (percentage of GDP), 2007
Source: Eurostat statistics, online data code: [gov_a_main], according to Muraközy (2010) Note: x-axis: ranking according to economic development (GDP per capita)
The most dynamic increase is recorded for the Anglo-Saxon model: until 2000, there was a drop in public spending, afterwards general government expenditures started to grow again, and the model experienced an intensified growth in public spending between 2007 and 2010 before a salient drop again. This process supports the theoretical argument of convergence literature which expects a “natural process of saturation, best described as convergence to an-upper-limit welfare state equilibrium” (Kittel and Obinger, 2003, p. 22). In the European Union case, convergence driven by neo-liberalization does not seem valid.
Convergence can be understood as a catching-up process, i.e. a growth to limits. Therefore, elementary welfare systems are expected to stretch out their social
provisions to public policy fields that have not yet been covered. These processes result in a situation in which welfare state laggards (such as the Mediterranean and potential model of the new EU member states or even the Anglo-Saxon model) experience above average growth in social spending, whereas welfare frontrunners (Nordic and Continental) cut their social spending.
In line with the above mentioned theoretical explanation, Nordic countries (Sweden and Finland) significantly cut back public budget to the level of the Continental model until 2007. Denmark is the only Nordic country which maintains the highest amount, close to 60% of GDP.
During the 2000s, Mediterranean countries experienced a continuous increase in general government expenditures, reaching 50 per cent in 2000 (the same level as the Continental countries with the exception of Luxembourg). The convergence is a result of salient reduction of general government spending in the case of Nordic countries, while in the countries of other models, except in newest EU member states, general government expenditures increased considerably.
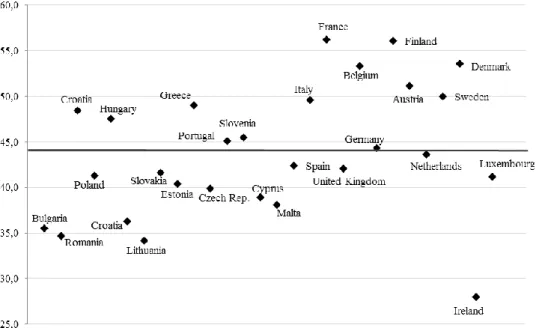
Figure 4. General government expenditures (percentage of GDP), 2009
Source: Eurostat statistics, online data code: [gov_a_main], according to Muraközy (2010) Note: x-axis: ranking according to economic development (GDP per capita)
In a recession, government expenditures tend to stay stable or increase because of the rising number of population in need, unemployed and relying on social security payments. As a consequence of the financial and economic crisis of 2008/2009, the GDP share of general government expenditures increased
significantly throughout the European Union (Figure 4) accompanied by growing deficits and debts. It is striking that there are not many differences in the case of Mediterranean and Nordic countries’ levels of general government expenditures, being at around 50 per cent of the GDP. In the case of the new member states, this increase was moderate, lower than in the other country groups.
In terms of GDP, general government expenditure rose sharply between 2007 and 2009, on the one hand, partly due to the denominator. GDP at current prices fell by more than 5 per cent between 2008 and 2009. On the other hand, public spending increased due to the thriving need for government intervention. General government expenditure significantly increased in 2009, before reversing its trend by easing to 43.9 per cent of GDP in 2016 (Figure 5).
Figure 5. General government expenditures (percentage of GDP), 2016
Source: Eurostat statistics, online data code: [gov_a_main], according to Muraközy (2010) Note: x-axis: ranking according to economic development (GDP per capita)
The evolution of general government expenditures during the last two decades shows that a significant convergence process took place until 2007. The coefficient variation of general government expenditures decreased from 19% (in 1995) to 10%
(in 2009). After the crisis, the coefficient variation started to grow again, since EU member states have implemented different policy mixes.
The current increase in general government spending is due to the effect of the financial and economic crisis. There is a wide range of policy mixes within the European Union. In order to shed light on the different focuses of general
government spending, the next section briefly reviews the structure of public spending.
2. General government expenditure by function
In the framework of the European System of National Accounts (ESA 95), Eurostat collects data not only on the aggregate level of general government expenditure but on public spending by economic function, as well according to the international Classification of the Functions of Government (COFOG).
Figure 6. General government expenditures by economic function (% of GDP)
Source: Eurostat statistics, online data code: [gov_a_main]
In the EU as a whole, as well as in all individual member states, social protection has been the most important function of government expenditure. Social protection expenditures are traditionally one of the most important spending categories, but since the outbreak of the financial and economic crisis, social benefits have been on the rise.
Figure 6 collects data on public expenditure by function of EU28 average for the examined time periods, 1995, 2007 and 2015. In general, more than half of all expenditures were devoted to social protection and health.
In all three time periods, the highest share of public spending is devoted to social protection. Based on the most recent data sets, the average level of social protection expenditures in the EU28 was equivalent to 16.8% of GDP in 2015, higher
than in the previous years. The data supports the argument that in times of economic recession, there is a thriving need for more extensive social protection. Any crisis has a significant influence on the operation of the welfare states. Well-functioning systems of social protection increase spending in times of recession, and scale it back as the economy recovers (Matsaganis, 2013), therefore the welfare state can operate as an effective “automatic stabilizer” (Basso et al., 2012).
As a consequence of the crisis, general government expenditures as a share of GDP increased. However, in 2015, the total level of general government spending did not exceed the 1995 level and social protection level is higher than any time during the examined period.
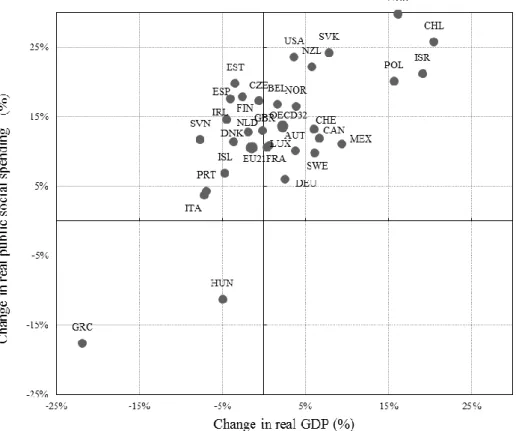
To test the automatic stabiliser function, Figure 7 shows percentage changes in real public social spending and real GDP comparing periods 2007/08 and 2012/132.
Figure 7 shows that the Nordic, the Continental and even the Anglo-Saxon models performed the automatic stabilising function well, expenditure on social protection went up in order to mitigate the negative consequences of the financial and economic crisis. Social spending in the countries of the Mediterranean model increased only in the early years; however, in 2012, the level of real public social expenditures was significantly lower than in Greece, slightly lower in Portugal, the increase was modest in Italy and average in Spain compared to the reference year 2007. There is a need for cutting back social expenditures in Mediterranean countries, even as unemployment still remains a dramatic problem in these countries.
Mediterranean countries have been subject to an austerity regime, at varying degrees and harshness. In Greece and Portugal, fiscal adjustment is being supervised by the EU, ECB and the IMF. Governments have lost much control over national budgetary decisions. Spain’s request for financial assistance was approved by the EU in July 2012, whose “conditionality” is less strict, while in Italy, fiscal adjustment has been enforced by the market (large spreads on Italian bonds) (Matsaganis, 2013). Welfare states cannot perform as automatic stabilisers if budgetary decisions are subordinated to the serious need for fiscal consolidation.
2 Estimates for 2007‑08 and 2012‑13 are averaged over two-year periods to allow for the different years in which the crisis began across countries and to limit the effect of year-on- year fluctuations.
Figure 7. Percentage changes in real public social spending and real GDP comparing the period of 2007/08 and 2012/13 for OECD countries3
Source: OECD (2013), OECD Social Expenditure Database (SOCX)
Note: Estimates for 2007-08 and 2012-13 are averaged over two-year periods to allow for the different years in which the crisis began across countries and to limit the effect of year-on- year fluctuations.
In the case of Central and Eastern European countries, with the exception of Hungary, welfare states have been able to function as automatic stabilisers. In Hungary, like in Mediterranean countries, economic recession was accompanied by chronic and increasing current account deficit. Indebtedness and current deficits became unsustainable in 2008, when the country signed stand-by agreements with the IMF, being the first joint EU/IMF programme. The automatic stabilising function of the welfare state has been tied by the implemented harsh austerity measures. In
3 Real public social spending data are only available for OECD countries and therefore, the whole European Union cannot be covered.
times of crisis, welfare state works primarily via the so-called automatic stabilisers if budgetary decisions are not subordinated to fiscal austerity.
In case of social protection expenditures, there is high coefficient variation which shows that the different social policy regimes have remained (Nordic, Continental, Anglo-Saxon, Mediterranean, Central and Eastern European or post- socialist type). However, there has been political configuration and commitment to the social policy at the EU level; the initial differences have remained salient. The effects of the recent financial and economic crisis on social policy divergence have exceeded the aftermath of any political tools (e.g. Open Method of Coordination4) to promote social policy convergence at the EU level.
General public services represent the second most important function in terms of government expenditure. The division ‘general public services’ includes expenses related to executive and legislative organs, financial and fiscal affairs, external affairs, foreign economic aid, basic research and expenses related to debt (Freysson, 2012). Since 1995 EU28 governments have scaled back these types of expenditures, but there has been no further decrease since 2000.
General public services, defence, and public order and safety are often considered as the main state prerogatives. Spending on defence (military and civil defence, as well as foreign military aid) has not changed much, mainly varying between 1 and 2 per cent of EU28 GDP during the examined time period. Defence spending significantly varies among EU member states, coefficient variation being around 40 per cent for the whole time period. All countries cut back or maintained their military expenditures. The share of public order and safety covering police and fire services, law courts and prisons has not changed during the examined period.
Expenditure on traditional functions is relatively homogeneous within EU countries.
The category ‘economic affairs’ covers support programs, subsidies and public infrastructure spending on mining, manufacturing, agricultural, energy,
4 In general, Open Method of Coordination (OMC) is a form of EU soft law, a process of policymaking which does not lead to binding EU legislative measures nor require Member States to change their law. The open method of coordination aims to spread best practices and achieve greater convergence towards the main EU goals. This process reduced the member states’ options in the field of employment policy, which was designed as an alternative to the existing EU modes of governance (Eurofound, 2010). OMC can be understood as an instrument of building the “European Social Model”, however there are optimists and pessimists about the success of this process. European Social Model refers to the institutional arrangements comprising the welfare state and the employment relations system (Martin and Ross, 2004). OMC instruments are not legally binding, they can be regarded as soft law, but soft law may be effective, because it allows for policy experimentation and better problem definition. OMC facilitates policy learning through the regular exchange of ideas, deliberation, peer reviews, diffusion of discourses, “socialisation”, and bottom-up experimentation (Büchs, 2009). OMC instruments can strengthen “social Europe”, both the status of social policy at the EU level and the performance of national welfare states (Ferrara and Rhodes, 2000).
construction, transport, communication and other service industries. Public spending on economic affairs highly varies over time since it may be influenced by single operations, such as reclassification of public companies into the general government sector or capital injections into public corporations for instance (Freysson, 2012).
From 1995, spending on economic affairs was reduced, on an average, to 4.7 per cent of EU28 GDP in 2007. The most recent data show that, due to the financial and economic crisis, general government spending on economic affairs was increased.
During the examined time period, government spending on ‘environmental protection’ and ‘housing and community amenities’ together amounted to roughly 2% of EU28 GDP in 2016, a very similar level to the previous years. These government spending categories include waste management, pollution abatement, protection of biodiversity and landscape, on the one hand and all outlays relating to housing development, community development, water supply and street lighting, on the other hand. Surprisingly, despite the growing public concern for the environment, public expenditures on these two functions make up for the least significant ones in terms of share of government expenditure (Krepštulienė, 2015).
Public spending on health is the third highest share of all expenditure categories. During the examined period, health spending has been continuously increasing throughout the EU28. The main driver of increases in health spending over the last 20 years is due to the increasing share of old-age population; and population projections suggest further spending increases in the areas of health expenditure in the future.
Expenditure relating to ‘recreation, culture and religion’ and ‘education’
remained stable during the examined time period, and accounted for 1.2% and 5.2%
of EU28 GDP respectively. Education spending highly varies within the European Union, the highest spenders being Nordic countries (ranging between 6 and 7 per cent compared of their GDP), while educational spending is the lowest in Ireland and Bulgaria (3.3% and 3.4% of GDP in 2016); in Mediterranean countries, this government function amounts to around 4 per cent of GDP.
Results and discussion
From the 1990s until the outbreak of the financial and economic crisis, general government expenditures were significantly reduced due to government efforts and dynamic economic growth. Until 2000, a sharp decline in general government spending took place throughout the European Union and, between 2000 and 2007, a slight, short increasing period was followed by a modest decline. During the first two years of the financial and economic crisis, general government expenditures were significantly increased, partly due to the shrinking GDP. The average level of general government expenditure in EU28 started its new downward trend in 2009 and, since then, a continuous decline can be observed.
Several empirical papers have confirmed the predominance of Wagner’s law in the European area, suggesting that, due to economic development, the share of public spending in national income tends to expand. The general government expenditure and economic development nexus has been the subject of intense debate among scholars without any conclusive results. Our main finding is that there is no unidirectional trend of general government expenditures and the analysis of the long- term trends of general public spending in the European Union shows us that, after a period of decreasing general government expenditure, any external economic shock might significantly increase public spending.
In all examined time periods, the highest share of public spending has been devoted to social protection. Spending on social protection has traditionally been one of the most important spending categories, but since the outbreak of the financial and economic crisis, social benefits have been on the rise. However, the total level of general government spending did not exceed the 1995 level in 2016 and the social protection level is higher in 2016. Spending on social protection has reached new levels due to the outbreak of the financial and economic crisis; however, the most recent data show that governments started to cut back this spending category in 2016.
General public services, defence and public order and safety are often considered the main state prerogatives and these spending categories have not changed significantly during the examined time period. Public spending on economic affairs highly varies over time and within the EU since it may be influenced by single operations and economic interests. Despite the growing public concern for the environment, public expenditures on this function, besides spending on housing, make up the least significant ones in terms of share of government expenditure. During the examined period, health spending has been continuously increasing throughout the EU28. The main driver of increases in health spending over the last 20 years is aging population; and population projections suggest further spending increases in the areas of health expenditure in the future. Expenditure relating to ‘recreation, culture and religion’ and ‘education’ remained stable during the examined time period and accounted for 1.2% and 5% of EU28 GDP respectively; however, education spending varies highly within the European Union.
Since the main task of the welfare state is to mitigate the negative effects of the crisis, the welfare state works primarily via the so-called automatic stabilisers if budgetary decisions are not subordinated to fiscal austerity. Crisis generally enforces welfare state retrenchment in those countries in which economic recession has been dramatic and recovery has been slow and unsteady. In general, there is a need for recalibration of the welfare state towards new social risks and in favour of less protected groups. Due to the current financial and economic crisis, in many cases, deep and systematic cuts of social protection were made, these reforms being aimed at restoring financial stability. Reforms that restore equity as well as efficiency of welfare systems have been pursued less consistently and only in those cases where
recalibration and rationalisation of the welfare state was conducted before the outbreak of the financial and economic crisis.
Acknowledgement: The work was supported by the National University of Public Service under the priority project PACSDOP-2.1.2-CCHOP-15 entitled “Public Service Development Establishing Good Governance” in the Egyed István Postdoctoral Program.
References
Aidukaite, J. (2004), The Emergence of the Post-Socialist Welfare State: The Case of the Baltic States: Estonia, Latvia and Lithuania, Södertörns högskola, Stockholm:
Elanders Gotab.
Aidukaite, J. (2011), Welfare reforms and socio-economic trends in the 10 new EU member states of Central and Eastern Europe, Communist and Post-Communist Studies, 44(3), pp. 211-219.
Andersen T. M. (2012), The Welfare State and the Great Recession, Intereconomics, 47(4), pp. 206-211.
Arpaia, A. and Turrini, A. (2008), Government Expenditure and Economic Growth in the EU: Long-run Tendencies and Short-run Adjustments, European Commission Economic Papers No.300. Brussels: European Commission (retrieved from http://ec.europa.eu/economy_finance/publications/pages/publication12024_en.pdf).
Atkinson, A.B. and Stiglitz, J.E. (1980), Lectures on Public Economics, New York:
McGraw-Hill.
Basso, G., Dolls, M., Eichhorst, W., Leoni, T. and Peichl, A. (2012), The Effects of the Recent Economic Crisis on Social Protection and Labour Market Arrangements Across Socio-Economic Groups, Intereconomics, 47(6), pp. 217-223.
Bird, R. M. (1971), Wagner’s Law of expanding state activity, Public Finance, 26(1), pp. 1-26.
Bird, R. (1972), The Displacement Effect: A Critical Note, Finanzarchiv, 30(3), pp. 454–
463.
Büchs, M. (2009), The Open Method of Coordination - Effectively preventing welfare state retrenchment?, European Integration online Papers (EIoP), 13(1) pp. 1-16 (retrieved from https://eprints.soton.ac.uk/71180/1/EIoP_2009.pdf).
Durevall, D. and Henrekson, M. (2011), The Futile Quest for a Grand Explanation of Long- run Government Expenditure, Journal of Public Economics, 95(7-8), pp. 708-722.
Esping-Andersen, G. (1990), The three worlds of welfare capitalism, New Jersey: Princeton University Press.
Eurofound (2010), Open method of coordination (retrieved from http://www.eurofound.europa.eu/areas/industrialrelations/dictionary/definitions/open methodofcoordination.htm).
Farkas, B. (2011), A közép-kelet-európai piacgazdaságok fejlődési lehetőségei az európai Unióban[The development opportunities for the Central-East European market economies within the European Union], Közgazdasági Szemle, 58(5), pp. 412–429.
Ferrera, M. and Rhodes, M. (2000), Building a Sustainable Welfare State, West European Politics, 23(2), pp. 257-282.
Freysson, L. (2012), General government expenditure: Analysis by detailed economic function, Statistics in Focus 33/2012, Brussels: Eurostat (retrieved from https://ec.europa.eu/eurostat/documents/).
Hall, D. (2011), Contesting the future of public finance? Social Economy & Public Economy (volume 3), in: Bance, P. and Bernier, L. (eds.), Contemporary Crisis and Renewal of Public Action: Towards the Emergence of a New Form of Regulation?, New York:
Peter Lang Publishing Group, pp. 109-130.
Kittel, B. and Obinger, H. (2003), Political parties, institutions, and the dynamics of social expenditure in times of austerity, Journal of European Public Policy, 10(1), pp. 20- 45.
Krepštulienė, D. (2015), Environmental protection expenditure accounts and resource management accounts, Final report Grant Agreement No 5121. Vilnius: Statistics Lithuania (retrieved from https://ec.europa.eu/eurostat/documents/).
Martin, A. and Ross, G. (2004), Euros and Europeans: Monetary Integration and the European Model of Society, Cambridge: Cambridge University Press.
Matsaganis, M. (2013), The Crisis of the Welfare State in Northern Mediterranean Countries.
in: IEMed Mediterranean Yearbook 2013. Barcelona: European Institute of the Mediterranean (IEMed), pp. 270-273.
Muraközy, L. (2010), Válságok állama – államok válsága (The state in crises-the crisis of states), Közgazdasági Szemle, 57(9), pp. 779–797.
OECD (2009), Government at a glance, Paris: Organisation for Economic Co-Operation and Development, (retrieved from http://www.oecd.org/gov/43926778.pdf).
Sapir, A. (2006), Globalization and the Reform of European Social Models, Journal of Common Market Studies, 44(2), pp. 369-390.
Shelton, C. A. (2007), The size and composition of government expenditure, Journal of Public Economics, 91(11-12), pp. 2230–2260.
Tanzi, V. (1997), The Changing Role of the State in the Economy - A Historical Perspective, IMF Working Papers, No. 97-114, International Monetary Fund (IMF) (retrieved from https://www.imf.org/external/pubs/ft/wp/wp97114.pdf).
Tanzi, V. and Schucknecht, L. (2000), Public Spending in the 20th Century: A Global Perspective, Cambridge: Cambridge University Press.
Wagner, A. (1883), Finanzwissenschaft, Leipzig: C.F. Winter.
Wahrig, L. and Gancedo, V.I. (2011), The effect of the economic and financial crisis on government revenue and expenditure, Eurostat Statistics in Focus, 45, pp. 1-12 (retrieved from http://epp.eurostat.ec.europa.eu/).