The impact of exposure to wagering advertisements and inducements on intended and actual betting expenditure: An ecological momentary
assessment study
MATTHEW BROWNE1*, NERILEE HING1, ALEX M. T. RUSSELL1, ANNA THOMAS2and REBECCA JENKINSON3,4
1School of Health, Medical and Applied Sciences, Central Queensland University, University Drive, QLD, Australia
2Research Innovation and Entrepreneurship, RMIT University, Melbourne, VIC, Australia
3Australian Gambling Research Centre, Australian Institute of Family Studies, Melbourne, VIC, Australia
4School of Public Health and Preventive Medicine, Monash University, Melbourne, VIC, Australia
(Received: October 25, 2018; revised manuscript received: January 3, 2019; second revised manuscript received: February 1, 2019;
accepted: February 24, 2019)
Background and aims:Research suggests that a large proportion of regular sports and race bettors experience harm related to their gambling. In Australia, people who bet regularly are targeted by a proliferation of different forms of inducements and advertising–many of which are believed to encourage excessive betting and erroneous perceptions of risk. However, scant research has examined the impact of marketing messaging to this group, which is also limited to cross-sectional or qualitative designs. We aimed to determine whether exposure to wagering advertisements and inducements influenced intended betting expenditure, actual betting expenditure, and spending more than intended.
Methods:We report on an ecological momentary assessment study, measuring regular exposure to 20 different forms of marketing, as well as wagering spend from 318 race bettors and 279 sports bettors. Up to 15 assessments per participant were conducted over 3 weeks (mean=11.46, median=14), yielding 6,843 observations for analysis.
Results: Exposure to advertising and inducements was reliably linked to a greater likelihood of betting, higher intended and actual betting expenditure, and spending more than intended.“Push”messaging and inducements that convey the impression of reduced risk (stake-back inducements and multibet offers) were particularly influential, as well as brands promoted during events and advertisements on betting websites/apps.Discussion and conclusions:
Given that a large proportion of regular sports and race bettors experience problems, restrictions on these forms of marketing are advisable. Thesefindings suggest that this is particularly important for marketing that is“pushed”to gamblers or that suggests reduced risk.
Keywords:marketing, advertising, inducements, betting, intentions, expenditure
INTRODUCTION
Wagering on racing and sporting events in Australia has grown substantially in recent years, where the legal age for gambling is 18 years or older. Race-betting losses totaled $3.3 billion in 2016–2017, representing 14% of all gambling expenditure; $1.1 billion was lost on sports betting, repre- senting 4.5% of gambling expenditure (Queensland Govern- ment, 2018). The promotion of sports and race betting reflects intense industry competition in this sector, and has been described as ubiquitous, relentless, and intrusive in Australia (Hing, Vitartas, & Lamont, 2014;McMullan, 2011;Sproston, Hanley, Brook, Hing, & Gainsbury, 2015) and elsewhere (Lopez-Gonzalez & Griffiths, 2017a,2017b). An understand- ing of the impact of this marketing on people who gamble– particularly those at-risk of or experiencing problems – is therefore critically required.
Advertisements for wagering have predominated in com- mercial breaks during sports and racing broadcasts, promot- ing betting brands and products, as well as live betting odds
and a wide range of inducements to bet (Gordon, Gurrieri, &
Chapman, 2015; Lopez-Gonzalez & Griffiths, 2017a, 2017b;Milner, Hing, Vitartas, & Lamont, 2013; Sproston et al., 2015). Sports entertainment shows are also punctuated by wagering industry commercials and contain sponsored segments and discussions of betting options and tips (Milner et al., 2013). Advertisements often target young adult males (Lopez-Gonzalez, Estévez, & Griffiths, 2018a; Lopez- Gonzalez, Guerrero-Solé, & Griffiths, 2018; Sproston et al., 2015), and/or are designed to appeal to excite- ment, fun, luck, and value-for-money (Deans, Thomas, Daube, Derevensky, & Gordon, 2016; Thomas, Lewis, McLeod, & Haycock, 2012). Embedded advertising is also prolific, with wagering operator brands and logos often visible on sports player uniforms, banners, and within
* Corresponding author: Matthew Browne; School of Health, Medical and Applied Sciences, Central Queensland University, Bundaberg B8 G.47, University Drive, QLD 4670, Australia;
Phone: +61 0438 491 738; E-mail:m.browne@cqu.edu.au This is an open-access article distributed under the terms of theCreative Commons Attribution-NonCommercial 4.0 International License, which permits unrestricted use, distribution, and reproduction in any medium for non-commercial purposes, provided the original author and source are credited, a link to the CC License is provided, and changes–if any–are indicated.
DOI: 10.1556/2006.8.2019.10 First published online March 28, 2019
stadiums (Hing, Vitartas, et al., 2014; Lopez-Gonzalez &
Griffiths, 2017a;Milner et al., 2013). It may also be found at race tracks, draped over horses, on staff uniforms, or installed at multiple track locations (Sproston et al., 2015). Digital media also enables direct advertising to individual customers, with a large volume of wagering messages typically received, via SMS, e-mail, phone, and social media, once individuals open a betting account (Hing, Gainsbury, et al., 2014;Russell, Hing, Browne, & Rawat, 2018; Sproston et al., 2015).
Wagering inducements typically offer one or more incen- tives to bet, in addition to what is normally offered by the core wagering product. An audit in 2015 identified 15 generic types of wagering inducements offered among 30 major wagering brands accessible to Australian residents (Hing, Sproston, Brading, & Brook, 2015). The most common offers included refund/stake-back offers, sign-up offers, providing a bonus or better odds, multibet offers, or winnings paid on losing bets. Wagering inducements aim to improve commer- cial outcomes, including recruiting, registering, and retaining customers (Weibe, 2008), as well as triggering additional sales, prompting brand switching, accelerating buying, inten- sifying purchasing, and encouraging riskier bets (Hing, Vitartas, & Lamont, 2017;Newall, 2015).
Cross-sectional studies have revealed some associations between exposure to wagering advertising and intentions or behavior among people who gamble. Those with higher Problem Gambling Severity Index (PGSI) scores tended to have greater exposure to this type of advertising, to view it more favorably, be interested in the gambling sponsor’s products, and be more willing to use them (Hing, Vitartas, &
Lamont, 2013). Another recent Australian study found that more frequent exposure to sports-embedded gambling advertising predicted greater intended frequency of sports betting, as did higher PGSI scores and previous sports- betting participation (Hing, Lamont, Vitartas, & Fink, 2015a). Problem gamblers (PGs; PGSI score: 8+) indicated highest approval of, and feeling most encouragement to bet from, sports-betting promotions during televised sport, when compared to other gambler risk groups (Hing, Lamont, Vitartas, & Fink, 2015b). Those with greater exposure to sports-betting advertising in digital media were more likely to bet regularly on sport, whereas those with greater exposure to race-betting advertising in traditional media were more likely to bet regularly on races (Sproston et al., 2015). A recent innovative study based on the Implicit Association Test found an implicit association between gambling and sport among youth aged 14–24 years, attrib- utable to exposure to gambling advertising, sponsorship, and other brand encounters (Li, Browne, Langham, Thorne,
& Rockloff, 2018).
Little is known about how wagering inducements influ- ence betting behavior, although recent research suggests they can lead to increased, more impulsive, and/or risky betting. A large survey of Australian sports bettors (N=1,813) found that more frequent users of wagering inducements had a greater tendency to place impulse in-play bets, particularly PGs and frequent sports viewers (Hing, Russell, Li, & Vitartas, 2018). Another quantitative study showed that wagering inducements tend to incentivize complex and risky bets (Newall, 2015). In an online
experiment, Hing, Vitartas, et al. (2017) found that “risk free”bets that offer a refund under certain conditions were the most enticing form of inducement. Hing, Vitartas, et al.
(2017) discuss the use of sign-up and refer-a-friend offers to not only entice new users, but also to encourage the creation of additional betting accounts, and the encourage- ment of volume purchasing through multibets. Cash-out inducements–those that refund or match part or all of a bet, under certain conditions – have also been criticized for facilitating loss of control due to the changed structural characteristics and the emotionally charged context in which cash-out decisions are typically made (Lopez-Gonzalez &
Griffiths, 2017a; Lopez-Gonzalez, Estévez, & Griffiths, 2018b). Others have argued that inducements tend to lower the perception of risk, stimulate impulsive bets, and promote feelings of control over betting outcomes (Deans, Thomas, Derevensky, & Daube, 2017).
In summary, researchers have advanced numerous theoretical reasons why wagering advertisements and indu- cements might influence sports- and race-betting behavior, particularly for people at higher risk of experiencing gambling-related harm. However, research into the effects of wagering advertising and inducements is limited by its scarcity and by being cross-sectional or qualitative in nature.
The present work attempts to partially address this gap through repeated sampling of regular wagerers’ current behaviors and experiences over short time periods.
Aims
We aimed to determine whether exposure to wagering advertisements and inducements influenced intended betting expenditure, actual betting expenditure, and spending more than intended–and whether or not this is differed by PGSI group.
METHODS
We followed an ecological momentary assessment (EMA) design. EMA methodologies are particularly suited to asses- sing immediate influences on discrete, episodic behaviors, and have therefore been used in relation to cigarette smoking (Shiffman et al., 2002), binge eating (Haedt-Matt
& Keel, 2011), alcohol use (Hussong, Hicks, Levy, &
Curran, 2001;Litt, Cooney, & Morse, 2000), and drug use (Freedman, Lester, McNamara, Milby, & Schumacher, 2006; Hopper et al., 2006). After completing a baseline survey, participants completed up to 15 short EMA surveys:
5 per week for three non-consecutive weeks, with surveys on Monday, Wednesday, Friday, Saturday, and Sunday of survey weeks, because more sporting and racing contests occur on weekends in Australia. Survey invitations were sent at 5 p.m. on relevant days, with reminders the following morning. The surveys captured participants’ exposure to different types of wagering advertisements and inducements as well as intended and actual betting behavior. The design aimed to maximize ecological validity and minimize recall bias because the surveys were conducted at, or very close to, the time and place that exposure to wagering marketing and betting occurred (Shiffman, Stone, & Hufford, 2008).
Participants
A total of 722 eligible respondents completed an initial online survey, which targeted two separate samples of Australian adults: regular horse/greyhound race bettors (N=402) and regular sports bettors (N=320). Of these, 597 (318 race and 279 sports) bettors completed at least one follow-up EMA survey and were available for analysis.
Regular bettors were those who bet at least fortnightly on the targeted gambling activity. Eligible customers from a major sports-betting company operating in Australia, and respon- dents to a previous survey by the authors, were e-mailed an invitation to complete the survey (The betting company knew about, but had no control over, the nature and purpose of the research. We designed the sampling procedure and have no reason to think the betting company manipulated this, given the high proportions of respondents who met criteria for problem and at-risk gambling. The betting company had no further involvement in the study nor did they have any access to resultant data). The majority of respondents reported being Australian born, English- speaking male (88.1% of race bettors and 92.5% of sports bettors), employed full-time, had post-secondary education, and lived as a couple with or without dependent children.
Ages ranged between 18 and 84 years, with mean ages of 41.3 (SD=13.7) years and 40.7 (SD=14.1) years for race bettors and sports bettors, respectively.
The race bettor sample comprised 94 recreational gam- blers (RG), 80 low-risk gamblers (LR), 93 moderate-risk gamblers (MR), and 51 PGs. The sports bettor sample comprised 70 RGs, 82 LR, 88 MR, and 39 PGs. Due to the modest sample size, and in the interest of model
parsimony, PGSI scores were treated as a binary contrast:
MR/PG status (PGSI 3+) versus not (PGSI 0–2). Thus, there were 144/318 (45.2%) PG/MR race bettors and 127/279 (45.5%) PG/MR sports bettors in the sample available for analysis. A high rate of problem gambling are observed in samples comprising regular sports and race gamblers, and higher rates are also observed in Internet panel samples.
Measures
Baseline survey. The survey captured demographic infor- mation and problem gambling risk status via the PGSI (Ferris & Wynne, 2001).
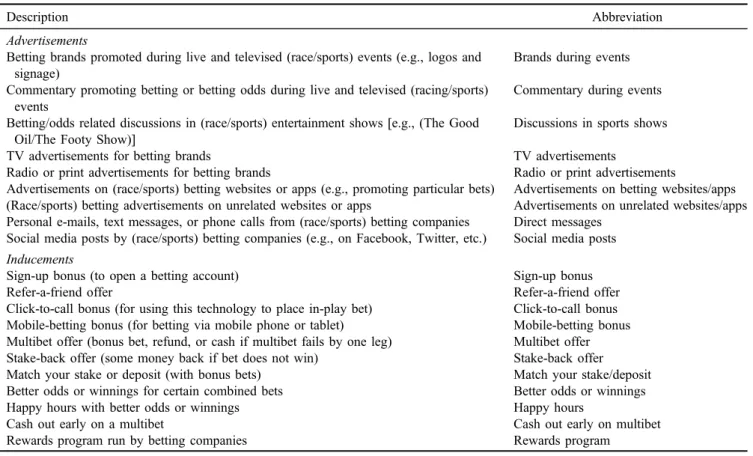
EMA surveys.We used a list of wagering advertisements previously employed in a national Australian study of wagering advertising (Sproston et al., 2015) and the list of wagering inducements generated by an audit of these indu- cements (Hing et al., 2015). We added two further induce- ment types – cash out early on a multibet (a recently introduced inducement type) and rewards program offers (which had been out of scope inHing et al.’s 2015 study).
These are listed in Table 1along with their abbreviations.
Respondents indicated how often they had heard/seen each type of message (advertisement or inducement) listed in Table 1 in the past 24 or 48 hr (since the last survey), rated on a scale ranging“never”(1),“a few times”(2), and
“often”(3). The EMA surveys also asked respondents their actual and intended betting expenditure: “Roughly how much money did you place on race bets in the 24 hr prior to 5 p.m. today?” and “Roughly how much money do you intend to place on race bets in the next 48 hr after 5 p.m. today?”
Table 1. Race- and sports-betting advertisements and inducements measured and frequency in sample
Description Abbreviation
Advertisements
Betting brands promoted during live and televised (race/sports) events (e.g., logos and signage)
Brands during events Commentary promoting betting or betting odds during live and televised (racing/sports)
events
Commentary during events Betting/odds related discussions in (race/sports) entertainment shows [e.g., (The Good
Oil/The Footy Show)]
Discussions in sports shows
TV advertisements for betting brands TV advertisements
Radio or print advertisements for betting brands Radio or print advertisements
Advertisements on (race/sports) betting websites or apps (e.g., promoting particular bets) Advertisements on betting websites/apps (Race/sports) betting advertisements on unrelated websites or apps Advertisements on unrelated websites/apps Personal e-mails, text messages, or phone calls from (race/sports) betting companies Direct messages
Social media posts by (race/sports) betting companies (e.g., on Facebook, Twitter, etc.) Social media posts Inducements
Sign-up bonus (to open a betting account) Sign-up bonus
Refer-a-friend offer Refer-a-friend offer
Click-to-call bonus (for using this technology to place in-play bet) Click-to-call bonus Mobile-betting bonus (for betting via mobile phone or tablet) Mobile-betting bonus Multibet offer (bonus bet, refund, or cash if multibet fails by one leg) Multibet offer Stake-back offer (some money back if bet does not win) Stake-back offer
Match your stake or deposit (with bonus bets) Match your stake/deposit
Better odds or winnings for certain combined bets Better odds or winnings
Happy hours with better odds or winnings Happy hours
Cash out early on a multibet Cash out early on multibet
Rewards program run by betting companies Rewards program
Procedure
Baseline survey. Dates for the 15 EMA surveys were provided in the information sheet of the baseline survey, allowing respondents to check their availability when con- senting to participate. Surveys were completed online via computer or smartphone through the Qualtrics platform, and respondents were compensated for the baseline survey with a $10 shopping voucher. Respondents who were aged 18 years and over bet at least fortnightly on horse/greyhound races or sports and were willing and able to participate in the EMA surveys were eligible for the subsequent phase.
All respondents were surveyed during 2017. The relevant dates for each week for all sports bettors were February 20–26, March 13–19, and April 3–9. For all race bettors, the dates were May 22–28, June 12–19, and July 3–9. Thus, there was a 2-week break between each survey week, and all respondents from each sample were surveyed simultaneous- ly as others in the same sample.
EMA.Eligible race and sports bettor samples were invited to complete 15 EMA surveys across three time periods, being invited to five surveys per week on Monday, Wednesday, Friday, Saturday, and Sunday. The EMA survey dates were selected to coincide with racing and sporting event seasons, and the weekly surveys were conducted 3 weeks apart.
Respondents were reimbursed a tiered amount based on the number of EMA surveys completed in the form of an electronic shopping voucher: $30 for 4–8 surveys, $70 for 9–12 surveys, and $100 for 13–15 surveys. The median (mean) number of surveys completed was 14 (11.6) for sports bettors, and 14 (11.3) for race bettors, yielding a total of 6,843 observations. To determine if there was any attrition bias in the samples, we examined the number of surveys completed by age and gender. A small relationship was found between number of surveys completed and age for race bettors only (r=.16,p=.003); no effects were found for gender.
Statistical analysis.All analyses were undertaken in the open-source R statistical programming environment (R Core Team, 2013). For both sports and race bettors, three types of responses were analyzed:
Regression (1): intended spend (dollars) Regression (2): actual spend (dollars)
Regression (3): actual spend controlling for intended spend.
By accounting for intentions, regression (3) aimed to estimate the influence of covariates on excessive spend, that is, spending more than intended. When treated as binary variables (i.e., spend/intention>0, discussed below), regression (3) captures effects on betting when one did not intend to do so. Spend intentions were lagged before analysis; they corresponded to intended spend in the fol- lowing time period. A second contrast was included for control purposes for Saturdays versus other days, based on the assumption that higher levels of betting would occur during this period. Interaction terms were included with each promotion type to determine whether the influence of messaging varied by problem gambling status.
Repeated measures. We employed linear mixed effects (LMEs) models for each regression, implemented using the lme4package (Bates, Mächler, Bolker, & Walker, 2015) in
order to account for the repeated measures. The LMEs included a random intercept for each participant in addition to the fixed effects, but no random slopes for participants.
Distribution of the response.Our response measures were actual and intended monetary spend in dollars. Both of these variables had a zero-inflated log-normal distribution, which is to be expected for this kind of measure. That is, they had a spike at zero reflecting time periods in which no money was (intended to be) spent, with non-zero spend amounts being heavily positively skewed. Log transformation and histo- grams of both variables confirmed that non-zero observations of both variables corresponded closely to a normal distribu- tion. Hurdle regression models provide an orthodox and convenient means to handle this distribution. First, a binomial logistic model was fit to all available data, predicting the probability that spend was greater than zero. Second, a standard (linear link) regression wasfit to the log-transformed positive responses only. Thus, the two components of the model capture, respectively, (a) the likelihood of betting (or intention to bet), and (b) the amount spent (or intended to spend), given that betting took place.
Selection and aggregation of inducements and adver- tisements. We measured exposure to 20 specific types of messaging, which displayed an average correlation of .36 (sports) and .37 (race). Simultaneous entry of all predictors was not feasible due to deleterious effects on model degrees of freedom, multicollinearity, and numerical stability. Our first approach was to aggregate exposure to inducement and advertisement types by a simple sum of all the coded responses (0, 1, 2) of exposure to specific types of messaging.
To investigate the impact of specific messaging, we employed a modern computational method of variable selection called the “lasso,” using the glmnet package (Friedman, Hastie, & Tibshirani, 2008,2010). The lasso can be understood as a form of robust variable selection, which is not vulnerable to the well-known instability of classical stepwise regression. In brief, a regularization term, which penalizes non-zero beta coefficients, is added to the normal regression penalty for prediction errors. By varying the weight of this term and testing via cross-validation, the conflicting goals of model parsimony/sparsity andfit to data can be balanced.
For each of the regressions on specific inducements and advertisements, we first ran the lasso procedure, which yielded an ordering of these inducements and advertise- ments, from most to least salient. This determined the order of variable inclusion in the hurdle LME models. We stopped including further predictors when it did not yield a signifi- cant improvement in model fit. Only the final models are reported. Interactions between messaging and problem gambling status were also considered to test for differential influence on those with gambling problems.
Ethics
The study procedures were carried out in accordance with the Declaration of Helsinki. The institutional ethics committee of Central Queensland University approved the study (H16/06-178). All subjects were informed about the purpose of the research and all provided informed consent.
RESULTS
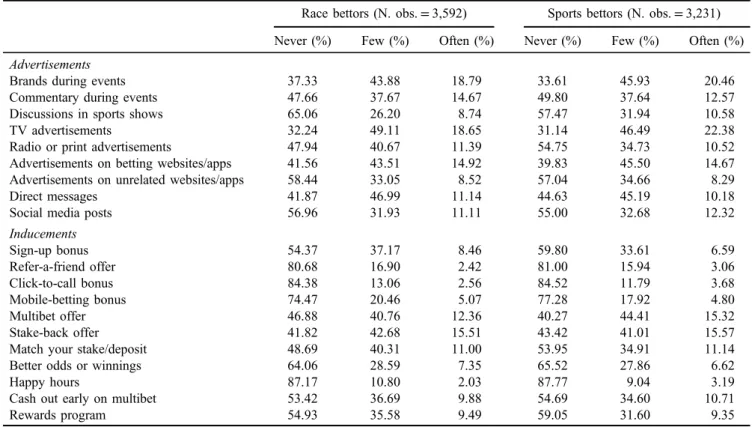
Table2summarizes the prevalence of exposure to specific messaging types reported by race and sports bettors during the EMA survey. Table 3 summarizes the frequency and quantity of reported spend. The LME regression summaries are organized below with respect to sample (race bettors and sports bettors), representation of the messaging variables (aggregated and lasso-selected), type of analysis (intended, actual, and excessive spend), and hurdle component (logis- tic and log-normal).
Race betting
Table4summarizes models estimating the impact of aggre- gate advertisements and inducements on race bettors. Parti- cipants were more likely to bet, and also spend more on Saturdays. Intentions were strongly positively predictive of actual expenditure. Exposure to advertising and induce- ments did not affect expressed intentions, but both were associated with greater likelihood of betting, and a greater spend when betting. Only advertisements predicted (excess) spend when controlling for intentions. PG/MR status was consistently associated with greater intended, actual, and excessive spending. Interestingly, although PG/MR gamblers did not gamble more often than others, they were more likely to gamble in time periods in which they had not intended to do so. No significant interactions between PG/MR status and aggregate messaging exposure were found.
Table 5 summarizes models estimating the impact of specific advertisements and inducements on race bettors. An
interaction model with PG/MR was also run but is not reported because it did not yield a significant improvement infit. Exposure to advertising brands, websites, and in-game commentary was each independently associated with a great- er likelihood of betting. Only brands and commentary were associated with increased spend, and these were also linked to excess spending. Inducements offered via direct messaging increased the likelihood of intending to bet, actual betting, and betting when not intending to do so. Stake-back offers increased the likelihood of betting and the amount spent.
Sports betting
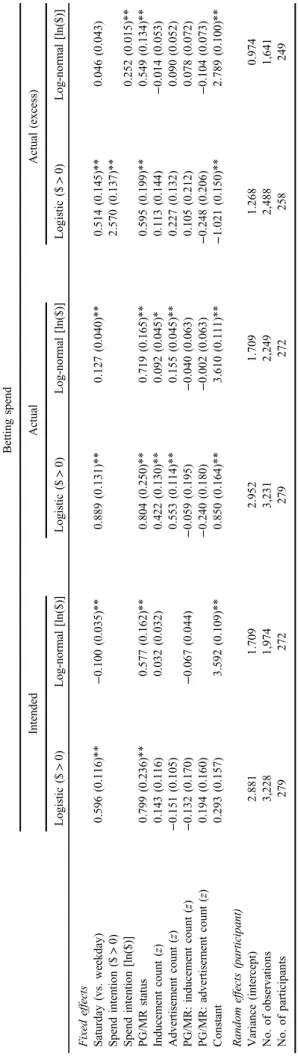
Table6summarizes models estimating the impact of aggre- gate advertisements and inducements on sports bettors.
Similar to race bettors, participants were more likely to bet and to spend more on Saturdays. They were more likely to
Table 2. Prevalence of exposure to advertisements and inducements for race and sports bettors in the EMA data set Race bettors (N. obs.=3,592) Sports bettors (N. obs.=3,231) Never (%) Few (%) Often (%) Never (%) Few (%) Often (%) Advertisements
Brands during events 37.33 43.88 18.79 33.61 45.93 20.46
Commentary during events 47.66 37.67 14.67 49.80 37.64 12.57
Discussions in sports shows 65.06 26.20 8.74 57.47 31.94 10.58
TV advertisements 32.24 49.11 18.65 31.14 46.49 22.38
Radio or print advertisements 47.94 40.67 11.39 54.75 34.73 10.52
Advertisements on betting websites/apps 41.56 43.51 14.92 39.83 45.50 14.67
Advertisements on unrelated websites/apps 58.44 33.05 8.52 57.04 34.66 8.29
Direct messages 41.87 46.99 11.14 44.63 45.19 10.18
Social media posts 56.96 31.93 11.11 55.00 32.68 12.32
Inducements
Sign-up bonus 54.37 37.17 8.46 59.80 33.61 6.59
Refer-a-friend offer 80.68 16.90 2.42 81.00 15.94 3.06
Click-to-call bonus 84.38 13.06 2.56 84.52 11.79 3.68
Mobile-betting bonus 74.47 20.46 5.07 77.28 17.92 4.80
Multibet offer 46.88 40.76 12.36 40.27 44.41 15.32
Stake-back offer 41.82 42.68 15.51 43.42 41.01 15.57
Match your stake/deposit 48.69 40.31 11.00 53.95 34.91 11.14
Better odds or winnings 64.06 28.59 7.35 65.52 27.86 6.62
Happy hours 87.17 10.80 2.03 87.77 9.04 3.19
Cash out early on multibet 53.42 36.69 9.88 54.69 34.60 10.71
Rewards program 54.93 35.58 9.49 59.05 31.60 9.35
Note.EMA: ecological momentary assessment.
Table 3. Summary of spending reported by race and sports bettors during the EMA
Race bettors (N. obs.=3,592)
Sports bettors (N. obs.=3,231) Mean
Obs. with non-zero spend 71.46% 69.60%
Quartiles of non-zero obs.
Lower quartile 25% $25.00 $20.00
Median 50% $80.00 $50.00
Upper quartile 75% $292.50 $200.00
Note.EMA: ecological momentary assessment.
Table4.LMEregressionbetacoefficients:aggregatemessagingonracebettors’intended,actual,andexcessspend Bettingspend IntendedActualActual(excess) Logistic($>0)Log-normal[ln($)]Logistic($>0)Log-normal[ln($)]Logistic($>0)Log-normal[ln($)] Fixedeffects Saturday−0.166(0.110)−0.202(0.042)**1.043(0.134)**0.390(0.041)**0.522(0.148)**0.257(0.045)** Spendintention($>0)2.573(0.134)** Spendintention[ln($)]0.222(0.013)** PG/MR−0.128(0.248)0.481(0.165)**0.336(0.233)0.506(0.164)**0.618(0.181)**0.569(0.143)** Inducementcount(z)0.184(0.111)0.013(0.034)0.408(0.121)**0.225(0.046)**0.040(0.139)0.112(0.055)* Advertisementcount(z)0.120(0.108)−0.001(0.044)0.614(0.118)**0.203(0.046)**0.374(0.135)**0.224(0.054)** PG/MR:inducementcount(z)0.053(0.164)0.096(0.052)−0.101(0.186)−0.120(0.065)0.170(0.209)−0.056(0.077) PG/MR:advertisementcount(z)0.091(0.155)0.073(0.063)0.300(0.180)0.054(0.064)0.274(0.201)−0.023(0.074) Constant0.754(0.168)**4.070(0.110)**1.128(0.158)**4.021(0.111)**−0.813(0.144)**3.220(0.106)** Randomeffects(participant) Variance(intercept)3.8511.8492.8501.7951.2061.144 No.ofobservations3,5852,1233,5922,5672,7561,870 No.ofparticipants316307318307283276 Note.Bracketedvaluesindicatestandarderrors.LME:linearmixedeffect;(z):predictorstandardized(i.e.,scaledandcentered);PG:problemgambler;MR:moderate-riskgambler. *p<.05.**p<.01. Table5.LMEregressionbetacoefficients:specificmessagingonracebettors’intended,actual,andexcessspend Bettingspend IntendedActualActual(excess) Logistic($>0)Log-normal[ln($)]Logistic($>0)Log-normal[ln($)]Logistic($>0)Log-normal[ln($)] Fixedeffects Saturday(vs.weekday)−0.209(0.111)0.423(0.042)**0.954(0.136)**0.367(0.041)**0.443(0.149)**0.277(0.045)** Spendintention($>0)2.534(0.135)** Spendintention[ln($)]0.220(0.013)** PG/MRstatus−0.123(0.250)0.556(0.162)**0.300(0.228)0.513(0.160)**0.526(0.178)**0.577(0.140)** Brandsduringevents0.431(0.107)**0.167(0.037)**0.264(0.125)**0.132(0.043)** Advertisementsonbettingwebsites/apps0.079(0.086)0.428(0.099)**0.340(0.115)** Commentaryduringevents0.471(0.109)**0.160(0.038)**0.213(0.127)0.194(0.042)** Directmessages0.422(0.091)**0.429(0.098)**0.352(0.111)** Matchyourstake/deposit0.223(0.092)* Stake-backoffer0.082(0.086)0.328(0.091)**0.233(0.031)**0.169(0.107) Constant−0.778(0.272)**4.058(0.110)**−2.419(0.261)**3.054(0.130)**−3.004(0.272)**2.649(0.123)** Randomeffects(participant) Variance(intercept)3.7631.3742.9171.8881.1311.215 No.ofobservations3,5852,5673,5922,5672,7561,870 No.ofparticipants316317318307283276 Note.Bracketedvaluesindicatestandarderrors.LME:linearmixedeffect;PG:problemgambler;MR:moderate-riskgambler. *p<.05.**p<.01.
bet on Saturdays, and when they had not originally intended to so, but did not spend more than intended on Saturdays.
PG/MR sports gamblers bet more often, spent more when betting, were more likely to bet when not intending to do so, and tended to spend more than intended. However, there was no differential impact of messaging on PG/MR gam- blers compared to others. Both aggregate advertisements and inducements were associated with a greater likelihood of betting, and advertisements were related to greater spend.
However, neither was associated with spend in excess of intentions.
Table 7 summarizes models estimating the impact of specific advertisements and inducements on sports bettors.
An interaction model with PG/MR yielded an improvement infit due to PG/MR gamblers being more likely to gamble throughout the week. As there was no significant differential influence of messaging on PG/MR gamblers, the main effects model are reported. Exposure to advertising on websites/apps and brands, as well as to multibet offer inducements was associated with a higher likelihood of betting. Exposure to television advertisements was related to a greater spend.
Exposure to gambling websites/apps predicted an increased likelihood of betting when not originally intended.
Hurdle regression models with log-transformation of the response make it difficult to interpret coefficients in terms of the raw differences in dollars spent, and LME models are not amenable to straight-forward estimation of effect size.
However, summarizing raw differences is problematic be- cause of the disproportionate influence of a small number of huge spend amounts. Accordingly, Table8summarizes the simple average of spend with respect to differing exposure to inducements and advertisements, excluding spends of
$500 or greater. A consistent increase in average spend is apparent as exposure increases, for both advertisements and inducements, and for both sports and race bettors.
DISCUSSION
We found that aggregate exposure to wagering inducements and advertisements was associated with a greater likelihood of betting and increased spend when betting. For race bettors, but not sports bettors, aggregate advertising was also related to betting when not intended and spending more than intended. Given these effects, it is interesting to note messaging in general did not affect betting intentions, with the exception of direct messaging–according to thefindings of a recent similar study (Russell et al., 2018). In general, exposure to advertisements had a stronger relationship with betting compared to inducements. These results suggest that a reduction in wagering advertising would be a positive consumer protection measure across the board, as it would be likely to reduce betting expenditure and spending more than intended, including among people at higher risk of experiencing gambling-related harm. In March 2018, gam- bling advertising was banned from live sports broadcasts on television and radio in Australia between 5:00 a.m. and 8:30 p.m. in order to reduce exposure of children to sports- related gambling. This ban followed several years of strong community concern (Australian Communication and Media Authority [ACMA], 2013). If this ban was extended to Table6.LMEregressionbetacoefficients:aggregatemessagingonsportsbettors’intended,actual,andexcessspend Bettingspend IntendedActualActual(excess) Logistic($>0)Log-normal[ln($)]Logistic($>0)Log-normal[ln($)]Logistic($>0)Log-normal[ln($)] Fixedeffects Saturday(vs.weekday)0.596(0.116)**−0.100(0.035)**0.889(0.131)**0.127(0.040)**0.514(0.145)**0.046(0.043) Spendintention($>0)2.570(0.137)** Spendintention[ln($)]0.252(0.015)** PG/MRstatus0.799(0.236)**0.577(0.162)**0.804(0.250)**0.719(0.165)**0.595(0.199)**0.549(0.134)** Inducementcount(z)0.143(0.116)0.032(0.032)0.422(0.130)**0.092(0.045)*0.113(0.144)−0.014(0.053) Advertisementcount(z)−0.151(0.105)0.553(0.114)**0.155(0.045)**0.227(0.132)0.090(0.052) PG/MR:inducementcount(z)−0.132(0.170)−0.067(0.044)−0.059(0.195)−0.040(0.063)0.105(0.212)0.078(0.072) PG/MR:advertisementcount(z)0.194(0.160)−0.240(0.180)−0.002(0.063)−0.248(0.206)−0.104(0.073) Constant0.293(0.157)3.592(0.109)**0.850(0.164)**3.610(0.111)**−1.021(0.150)**2.789(0.100)** Randomeffects(participant) Variance(intercept)2.8811.7092.9521.7091.2680.974 No.ofobservations3,2281,9743,2312,2492,4881,641 No.ofparticipants279272279272258249 Note.Bracketedvaluesindicatestandarderrors.(z):predictorstandardized(i.e.,scaledandcentered);LME:linearmixedeffect;PG:problemgambler;MR:moderate-riskgambler. *p<.05.**p<.01.
encompass a blanket ban on wagering advertising, or at the very least to cover the entirety of sports games and racing programs, it may also assist in reducing harmful gambling behaviors among adults. The consistent level of community anger toward wagering advertising suggests that strength- ening advertising restrictions would be supported at the community level (ACMA, 2013). To best protect consu- mers, any such restrictions should encompass digital as well as traditional advertising, to prevent migration of advertising to less restricted online, social media, and mobile platforms, as has occurred with the introduction of previous advertising restrictions (Gainsbury et al., 2015;Sproston et al., 2015).
No differential effects of messaging on the PG/MR gamblers were found. Compared to other regular bettors, PG/MR gamblers did not bet more often; rather, they tended to spend more on betting on days when they bet, bet when not originally intending to, and spend more than intended.
Nevertheless, research suggests that 41% of all regular (at least monthly) sports bettors and race bettors in Australia experience one or more gambling-related problems (Armstrong & Carroll, 2017a, 2017b). Furthermore, this study found that exposure to wagering marketing increased the likelihood of betting and spending when betting. There- fore, it can be concluded that wagering marketing negatively affects substantial numbers of bettors already at-risk of, or currently experiencing gambling problems. Young adult males are the target group for this marketing, a group who are increasingly reporting betting-related problems and harm (Hing, Russell, Vitartas, & Lamont, 2016).
Inducements implicated as having most influence on betting expenditure were multibet and stake-back offers, which refund part or all of the bets (under certain conditions) via cash, bonus bets, deposits, or reward points. The appeal of these forms of messaging is based on conveying the impression of reduced risk, but they actually increase losses by encouraging increased betting expenditure. Conveying the impression of reduced risk is likely to contribute to erroneous cognitions (Hing, Sproston, Brook, & Brading, 2017; Lopez-Gonzalez & Griffiths, 2017b). A targeted approach to consumer protection would be, therefore, to ban or otherwise restrict these types of inducements.
A problematic form of wagering advertising is direct messaging via e-mails, texts, and phone calls from wagering operators. The majority of these direct messages promotes specific wagering inducements, and bettors report that this marketing is intense and particularly influential on their betting, encouraging them to bet and to spend more on betting (Russell et al., 2018). This study similarly found that this type of advertising was associated with a greater intention to bet, more betting, and betting more than intended for regular race bettors. A prudent regulatory measure would be to ban this type of push advertising or to mandate a rigorous opt-in requirement to receive these targeted inducements, rather than the current opt-out system.
Limitations
Only at-least fortnightly sports bettors and race bettors were included, which preclude any assessment of the effects of wagering advertisements and inducements on less frequent bettors. Substantial attrition occurred before and during the Table7.LMEregressionbetacoefficientsofspecificmessagingonsportsbettors’intended,actual,andexcessspend Bettingspend IntendedActualActual(excess) Logistic($>0)Log-normal[ln($)]Logistic($>0)Log-normal[ln($)]Logistic($>0)Log-normal[ln($)] Fixedeffects Saturday(vs.weekday)0.592(0.115)**−0.100(0.035)**0.884(0.132)**0.109(0.041)**0.521(0.145)**0.047(0.043) Spendintention($>0)2.572(0.137)** Spendintention[ln($)]0.256(0.015)** PG/MRstatus0.810(0.236)**0.569(0.162)**0.903(0.246)**0.731(0.162)**0.616(0.195)**0.551(0.134)** Rewardsprogram0.014(0.029)0.074(0.034)* Advertisementsonwebsites/apps0.411(0.098)**0.477(0.105)** Brandsduringevents0.496(0.090)** Multibetoffer0.518(0.096)** TVadvertisements0.194(0.032)** Constant0.285(0.157)3.571(0.117)**−1.725(0.260)**3.137(0.130)**−1.859(0.224)**2.779(0.099)** Randomeffects(participant) Variance(intercept)2.8921.6292.9231.6361.3070.971 No.ofobservations3,2281,9743,2312,2492,4881,641 No.ofparticipants279272279272258249 Note.Bracketedvaluesindicatestandarderrors.LME:linearmixedeffect;PG:problemgambler;MR:moderate-riskgambler. *p<.05.**p<0.01.
EMA survey periods. Thus, those who opted into the study, and who completed most or all EMA surveys may differ from the population of regular sports and race bettors, although no attrition bias was found by age or gender. The EMA intervals varied between 24/48 hr to conform to a weekly schedule. Our “Saturday” contrast only partially accounted for this. In order to maximize survey brevity, we only asked about how much money was placed (or intended to be placed) on betting and did not ask about wins.
While we attempted to describe each type of advertisement and inducement as accurately as possible, some participants may have confused some types, for example, “Betting brands promoted during live and televised (race/sports) events (e.g., logos and signage)”with“TV advertisements for betting brands.”Accurately measuring exposure to each type of wagering advertisements and inducements was impossible for numerous types of marketing, for example, number of brand exposures or amount of commentary during televised events. Finally, the EMA design does not conclusively demonstrate that exposure to messaging causes betting behavior: betting on or watching sports is likely to increase exposure to some (but not all) forms of messaging.
Future work might strengthen a causal interpretation by attempting to measure exposure occurring strictly before the betting behavior. Nevertheless, by observing exposure, intentions, and betting behavior close to the time at which it occurred, the EMA design provides stronger evidence of the link between advertisement and inducement exposure and subsequent betting expenditure.
CONCLUSIONS
Advertising and inducements are reliably linked to more intense betting behavior, particularly“push”messaging and inducements that convey the impression of reduced risk.
Given that a large proportion of regular sports and race bettors experience gambling-related harm, and are known to be vulnerable to such messaging, restrictions on these forms of marketing would be a positive consumer protection mea- sure that is likely to be welcomed by the wider community.
Funding sources: This study was funded by the Victorian Responsible Gambling Foundation.
Authors’contribution:MB conducted the statistical analy- ses and led the drafting of the manuscript. NH helped to
design the study and the study instruments, wrote the foundation literature review and discussion, and critically reviewed the manuscript. AMTR helped to design the study and survey instruments, assisted with data preparation and initial analyses, and critically reviewed the manuscript. AT and RJ helped to design the study and the study instruments and critically reviewed the manuscript.
Conflict of interest:MB has received funding from the New South Wales Office or Liquor and Gaming, the Victorian Responsible Gambling Foundation, the Queensland Gov- ernment Department of Health, the Tasmanian Department of Treasury and Finance, the Alberta Gambling Research Institute, Gambling Research Australia, the New Zealand Ministry of Health, the Department of Families, Housing, Community Services and Indigenous Affairs, the Austra- lian Department of Innovation, Industry, Science and Research, and the Department of Foreign Affairs and Trade.
He declares that he has no conflict of interest in relation to this research. NH has received research grants from the Australian Research Council, Gambling Research Australia, the Queensland Government, NSW Government, South Australian Government, Victorian Government, Vic- torian Responsible Gambling Foundation, the Australian Communications and Media Authority, the Alberta Gambling Research Institute, and the Australian National Research Organisation for Women’s Safety. She has con- ducted unpublished consultancy work for Echo Entertain- ment, Singapore Pools, and Sportsbet aimed at improving their responsible gambling practices. She declares no con- flict of interest in relation to this manuscript. AMTR has received research grants from Gambling Research Austra- lia, the Victorian Responsible Gambling Foundation, the Queensland and New South Wales Governments, the Alberta Gambling Research Institute, and the National Association of Gambling Studies. He has conducted un- published consultancy work for Echo/Star Entertainment, aimed at improving their responsible gambling practices in relation to gambling by their employees. He declares no conflict of interest in relation to this manuscript. He has also received research grants from Gambling Research Australia, Victorian Responsible Gambling Foundation, the Victorian Government and the Australian Government.
He has been paid to conduct peer reviews for Gambling Research Australia and the Victorian Responsible Gam- bling Foundation. RJ has received research grants from the Victorian Responsible Gambling Foundation, the Victorian Government, the Australian Government Department of Health, the Australian Government Department of Social Table 8. Average spend of sports and race bettors with respect to exposure to inducements and advertisements
Exposure
Sports bettors Race bettors
N. obs.=2,897* N. obs.=3,144*
Inducements Advertisements Inducements Advertisements
None $33.40 $42.04 $33.71 $42.44
1–4 $53.78 $53.78 $68.90 $62.61
5+ $67.35 $65.67 $78.09 $82.67
Note.*One-sided trimmed mean: cases reporting spend exceeding $500 (~8%) excluded from calculation. Zero spend observations included.