GIS BASED CLIMATE MODELING FOR ECOLOGICAL AND EPIDEMIOLOGICAL PREDICTION
Ákos Bede-Fazekas1 – Attila János Trájer2
1 Corvinus University of Budapest, Faculty of Landscape Architecture, Budapest, 1118, Hungary
2 Semmelweis University, National Institute of Environmental Health, Budapest, 1097, Hungary
Keyworlds: climate change, indicator species, vector, epidemiology, modeling
As the WHO (World Health Organisation) recommended using bioindicator species can help us to study and follow the effects of climate change. It is exciting research theme to compare the reaction to climate change of the animal vectors of infectious diseases with the reaction of plant species. As is to be expected the climate in the Carpathian Basin will be warmer, more arid, and will have extreme rainfalls more frequently in the colder half-year (Bartholy 2007).
This will, probably, shift the distribution not only of plant species but of the vectors bound to the vegetation. The modeling method previously built for examining plant distributions (Bede-Fazekas 2012a) is able to be, with certain modification, expanded to vector species.
Thus, we can study the future distribution of warm demanding vectors such as Tiger mosquitos (Aedes sp.) and several ticks (Ixodes, Dermacentor sps.).
Global climate change and ornamental plants
The phenomenon of global climate change has been accepted in quite broad extent. The reasons – whether the human influence is dominating or not – are still subject of scientific discussions. There are, however, a great amount of climate models based on the IPCC SRES climate scenarios. Free access is provided for these models. The models are reliable enough and have good horizontal resolution for studying the potential future distribution of plant and animal vector species. Thus, the maps created by the model have importance not only for landscape architects and botanists (Czinkóczky 2012), but also for the epidemiologists.
There is a two-way relationship between landscape design and climate change: on the one hand landscape design methods can help the protection of climate and on the other hand we have to adapt to the climate change. Regarding climate protection it is highly important to increase the spreading of CO2 bonding vegetation by various landscape planning methods:
regulation plans can help changes among cultivation types, it can prescribe particular plantation of vegetation, it can improve the living conditions of the vegetation, for example by establishing water surfaces, landscaping. Garden design, garden planning are parts of landscape design. It is thinking in small scale therefore its role in climate protection is limited;
its effects on the microclimate and the urban mesoclimate are more significant. Intensive garden maintenance – mainly due to increasing energy prices – may get into crisis in future decades. In order to avoid it ecologic efforts supporting the effectiveness of natural processes, like permaculture should be incorporated into the Hungarian professional knowledge.
Hungarian climate is affected by dry continental, wet oceanic and Mediterranean climate effects. It is very likely that the Mediterranean effects will dominate in the forthcoming century. This is why the assortment of plants applied in our gardens and parks have to be changed. Due to the long lifetime of woody plants landscape designers have to think in advance thus the plants that will be in their peak thirty years later – planted today – have to be selected from species enduring drought, preferring warmth and enduring Mediterranean climatic effects. A part of these plants survives difficultly the current severe winters (winter
cover and frost protection help) but the risk of freezing will decrease gradually in the forthcoming decades.
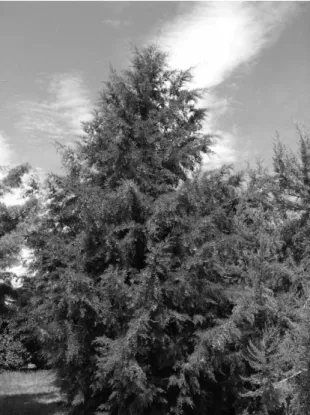
It is necessary to identify species and breeds that cope well with today’s climate conditions as well (enduring frost and winter). Unfortunately there are only a few example on selection of taxa originated from areas of warmer climate regarding frost endurance, on multiplication, presentation and spreading of selected species and breeds in Hungary. Botanic gardens (and arboreta) where older specimens of this warmth demanding exotic species can be found and plant hardiness experiences may have special role. Such collections in Hungary are in Pécs, Sopron, Badacsonyörs (Fig. 1.), Csákvár, Budakeszi and Somogyvámos. Most warmth demanding species are from the Mediterranean, western shores of North America and the Far East.
Fig. 1. Mexican Cypress (Cupressus lusitanica Mill.) specimen in the Folly Arboretum, Badacsonyörs, Hungary. One of the hardly ever planted species that
should be introduced
It is, however, not enough to give lists of new species as such lists are subjective based on only a few specimens. It is important therefore to predict in objective ways based on controllable scientific methods what taxa are expected to advance in our gardens in the future.
GIS based distribution modeling
In contrast to botanists for the landscape designers not the future distribution area of the given plant is interesting, rather whether the plant founds appropriate environmental conditions in the future (area of introduction). Thus in contrast to area shift it is much easier and more accurate to estimate and model which areas will meet the climate demands of the selected species in the future. Ecological demands of a plant can be determined accurately based on its current distribution area and the meteorological datasets of the reference period. This approach has some resemblance to the method of spatial analogy (Horváth 2008).
The method we used is a kind of climatic envelope modeling (CEM) based on the climatic values of average monthly mean temperature, average monthly minimum temperature, and average monthly precipitation found within the distribution of certain species in the reference period (1961-1990). The result of the CEM is a multi-layered map showing the current distribution, the modeled potential distribution for the reference period, and the modeled potential distribution for the two future periods (2011-2040, 2041-2070). ESRI ArcGIS 10 software’s Spatial Analyst module was used for this research. The climatic data were obtained from the REMO ENSEMBLES RT3 climate model (ENSEMBLES 2012) which contains data of a 25-km horizontal grid cell resolution of Europe.
The ‘A1B’ IPCC SRES scenario gave the base of the regional model. The A1 storyline and scenario family describes a future world of very rapid economic growth, global population that peaks in mid-century and declines thereafter, and the rapid introduction of new and more efficient technologies. Major underlying themes are convergence among regions, capacity building, and increased cultural and social interactions, with a substantial reduction in regional differences in per capita income. A1B scenario is one of the three from A1 scenario family. It describes a balance across all sources of energy system. (Nakicenovic 2000). No DTM (Digital Terrain Model) was used for the accurate interpolation. We prepared the climate data with some statistical processes: the lower and upper 5 or 10 percentiles of the dataset were left to avoid the wrong data (due to the weak resolution of the grid).
Model results based on plant’s distribution
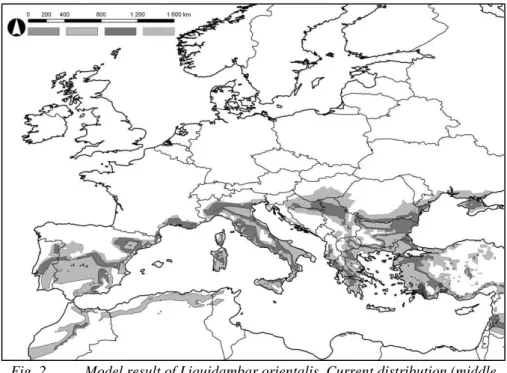
The results given by the model were not satisfactory when the input distribution was inaccurate and no percentiles were cut from the climatic data. There are, however, some results that can be accurate and spectacular enough for displaying. Figure 2. shows the current and predicted distributions of Turkish sweetgum (Liquidambar orientalis L.) in one map.
Fig. 2. Model result of Liquidambar orientalis. Current distribution (middle gray), modeled potential distribution in the reference period (light gray), modeled potential distribution in the two future periods (2011-2040 – dark gray, 2041-2070 –
light gray)
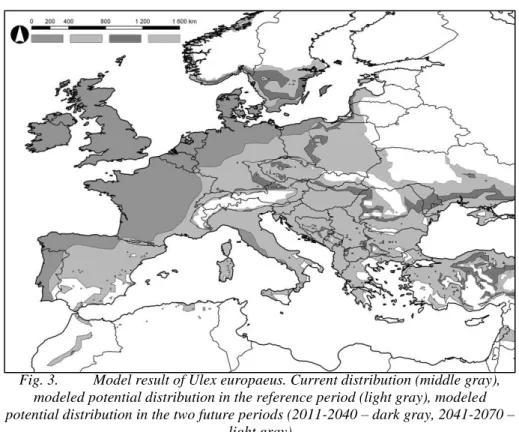
The input distribution was, in case of the Turkish sweetgum, very accurate, due to its point- type area map. Despite the continuous polygon-type area the common gorse (Ulex europaeus L.) has, the model result (Fig. 3.) is able to gain high interest. In contrast of the northward shift of the Mediterranean species common gorse shows an eastward distribution displacement. It should be examined whether other species from the Atlantic climate give similar model results.
Fig. 3. Model result of Ulex europaeus. Current distribution (middle gray), modeled potential distribution in the reference period (light gray), modeled potential distribution in the two future periods (2011-2040 – dark gray, 2041-2070 –
light gray)
In addition to run models on individual distribution we can couple them and model the shift of a floristic region or the border of it. One of these floristic borders is lying in the Northern Carpathians and is named after Gusztáv Moesz, who was a botanist and mycologist. The most important observation for the Central-European botany and landscape architecture he made was published more than 100 years ago. He discovered that certain plants share a common northern distribution border and this coincides with the line of vine cultivation (Moesz 1911).
We applied three different modeling methods on the Moesz-line (detailed description can be found in the study of Bede-Fazekas (2012b)). One of the model results is displayed on Figure 4., zoomed into Slovakia.
Fig. 4. Example of model result based on border of a floristic region. The original Moesz-line can be seen (drawn with continuous black color) together with
the model results for the reference period (1961-1990, dashed, light gray), for the first future period (2011-2040, dashed, dark gray) and the second future period
(2041-2070, continuous, dark gray)
Importance of vectorial diseases
One of the most important effects of climate change on human health is the increasing hazard of vectorial diseases (animal transmitted human diseases, mainly transported by arthropods:
insects, ticks, etc.). The current importance of the vectorial diseases is less in Europe than in the countries of the Third World, particularly in the Sub-Sahara Africa. The protective role of the cold winters of the temperate climate in the western World – in North America and Europe – may lose its importance. Due to the climate change the importance of arthropod- borne diseases can increases to the end of the 21st century. Didactically we can discern three groups of the vectorial diseases: the recently abundant ones, the diseases of the past centuries, which have disappeared but can appear again, and the new, „exotic” diseases. In this last group we can discern the Mediterranean or subtropical and tropical vectorial diseases. Lyme disease, tick born encephalitis and some other arthropod-borne diseases are good example of the first group.
The vectors and the parasites of the endemic diseases are well adapted to the climatic patterns of the last thousand of years. Despite of the fact that the cold climate of the latest glacial period vanished them from Europe, in some refugium habitats they could survive in the Mediterranean and Subtropical regions. Some vectors, like Ixodes ticks require the relatively high (more than 70%) air humidity, but some species, like the Dermacentors can survive also in more arid, vegetation-poor environments. It is probable that the increasing aridity will affect of their distribution in Europe, will press toward their distribution limits to the northern latitudes. The mosquito-borne diseases form a very diverse group in the aspect of climate demands, because this group contains also real tropical and temperate members, and the borders are highly transparent. Malaria, for example, belongs to the second group, because it was endemic in Europe until the 20th century, but the use of pesticides and the drainage of the wetlands eliminated malaria from the map of Europe. Anopheles messeae demonstrates that a malaria-mosquito can reach the Arctic Circle and indeed, in the beginning of the 20th century malaria caused great epidemics in Western Siberia and was endemic to 1950’s in Hungary.
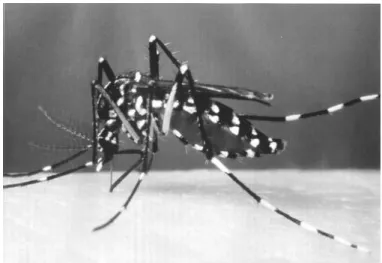
The population dynamics of the Anopheles mosquitoes, the transmission rate of the Plasmodium parasite from mosquito to human or human to human, furthermore the proportion of Anopheles mosquitos in the whole mosquito population are also important factors of becoming endemic or not in an area. Characterizing the geographical propagation of West Nile as a typical example of the effect of global warming – while it is noted, that the main vectors of West Nile virus are Culex mosquitoes which are endemic also beyond the Arctic Circle – is a misapprehension. Chikungunya disease (the vector is the Asian Tiger Mosquito, the Aedes albopictus; Fig. 5) as a tropical and monsoon climate disease is an extreme example of how a warm-consuming vector and its parasite can habit a new area and cause epidemics.
Fig. 5. Tiger mosquito (Aedes albopictus). Source:
http://support.mosquitomagnet.com/help/common/mosquito_sp.aspx Fig. 6.
Phlebotomus species and leishmaniasis
According to the parasite organism’s clinical symptoms and the main target within the human body we can divide Leishmaniasis into three main groups: cutan (dominated by skin affections), visceral (infection of the internal organs), and the various types of the mixed forms. Leishmaniasis however is a real Mediterranean disease, its vectors, the sand flies, were adapted to the climate of the Mediterranean area of Europe at least one million years ago and they survived the entire Ice Age in the Iberian Peninsula, the Apennines, Asia Minor, and the Balkan Peninsula. Sand flies are neither mosquitoes nor flies. They are more close relatives of mosquitoes, but they diverged from the basal Diptera family. They are small, a few mm-long animals which bite and feed on warm-blood living beings and are responsible for the transmission of Leishmania and Bartonella species, the causative agents of Pappataci fever and diverse types of Sandfly fevers. The geographical distribution of the Pappataci fever and Leishmania is restricted almost to the same regions of the Old World: the Mediterranean zone of Europe, Turkey, Arabian Peninsula (without the most arid deserted regions), Iran, Afghanistan, Pakistan, India, Bangladesh, and in north-south extension from Southern Switzerland to the northern coastal sides of the North African states. Some species of sand flies live only in the western Mediterranean (e.g. P. ariasi), many live in the east side (e.g. P.
papatasi; Fig. 7.), and some live in the whole Mediterranean Basin. There are relatively cold- tolerant ones (e.g. P. perniciosus) and not cold-tolerant species (e.g. P. similis), whose future expansion to northern latitudes are less likely.
Fig. 7. Phlebotomus papatasi. Source:
http://www.raywilsonbirdphotography.co.uk/Galleries/Invertebrates/vectors/san d_fly.html
Connection of vectorial diseases and climate change
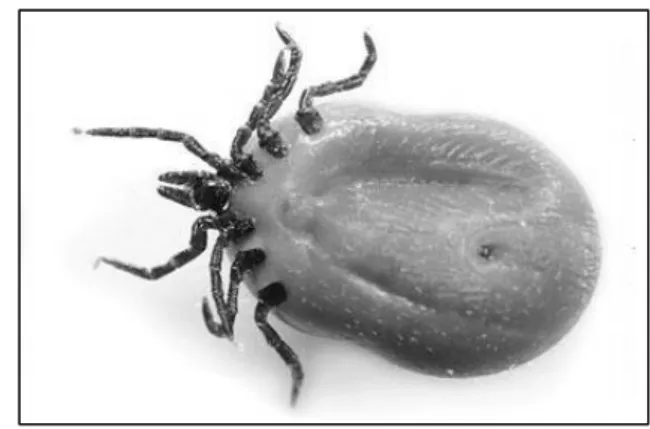
Climate change may have negative effects on vectors and some can increase the habitability of an area for the mosquitoes, sand flies and ticks. For many species the absolute limiting climate factor is the winter minimum temperature, but the warmth of the summer and the length of the vegetation period are also important limiting factors. Ixodes ticks (Fig. 8.) can survive low temperatures in refugiums, but many Mediterranean ticks are sensitive to the cold periods. The low soil moisture and the absence of the host animals are also important. The ontogeny of the mosquitoes is easier and more rapid than ticks’. Depending on the mean daily temperature they can multiply their population with different speed. The increasing length of the warm season and the milder winters favor for both ticks and mosquitoes. The projections also warn that the climate becomes not only warmer, but also drier. By using analogues the Mediterranean-like dry and hot summers may reduce the activity of ticks in summer and can reduce the southern distribution of Ixodes species, but also can allow the migration of the southern tick species to the north. Mosquitoes can live in little natural or artificial ponds, the decreasing summer precipitation can reduce the extension of the total water surface, but the shallow water level makes the ponds and backwaters warmer, which is appropriate for the mosquito larvae. The warmer winters are very important for the sand flies and since their larvae don’t require open water surface – but only wet rifts on walls or woods –, the decreasing precipitation may not be a limiting factor for them.
Fig. 8. Ventral aspect of the adult castor bean tick (Ixodes ricinus).Source:
http://www.pixmule.com/TicLK/34/
Hungary: the east gate of the Mediterranean vectors to Central Europe
Our study area, Hungary, is located between the warm Mediterranean, the more extreme climate continental and the mild Western-Central European Atlantic areas and has a special geographic profile, because the whole basin is surrounded by the mountains of the Carpathians, the Alps, and the Dinarids. Nevertheless, by river valleys and other channels (e.g. roads) the flora and fauna is connected with other regions of Europe. Because great areas of the Carpathian Basin are plains and it lies in the intersection of the three above mentioned different climate influences, this area is very sensitive to the changing climate. This is proved that the Carpathian Basin saved plant relicts from warm and cold periods from the Pleistocene era.
Indicator plant species
It has a high importance for the future to find some plant species that indicate the potential distribution of a vector or a vectorial disease. We aimed to bind some indicator plants to the Mediterranean originated vectors in our later studies. Preliminary results show that, among the ligneous Mediterranean species, the aggregated distribution of some Mediterranean flora elements joins mostly the distribution of sand flies.
Interglacial and glacial flora elements are not uncommon in Hungary, but surprisingly some plants have survived the Ice Age within the Carpathian Basin, as the Nymphaea lotus ssp.
thermalis in Oradea, Romania, the Carpinus orientalis in the Vértes Mountain of Hungary and the Syringa josikaea in Transcarpathia (Ukraine) and Transsylvania. For example the closest relatives of the S. josikaea live in the Himalayas. In the last two decades the northern expansion of the golden jackal (Canis aureus) to the Carpathian Basin is observed, which is a Mediterranean fauna element and at least to the early 1990’s the conservation status of this wild dog was extinct in Hungary. No doubt about that the Basin can serve as an acclimatization area for new plants, animals and diseases as in the past it happened with the highly allergenic Ragweed, the Ambrosia artemisiifolia.
Model results based on vector distributions
The distribution and the seasonal incidence of the vectorial diseases highly depend on the behavior of the different vector species. In case of a vector, such as the ticks, it means the requirements of the larva, the nymph, and the adult forms should be taken into consideration.
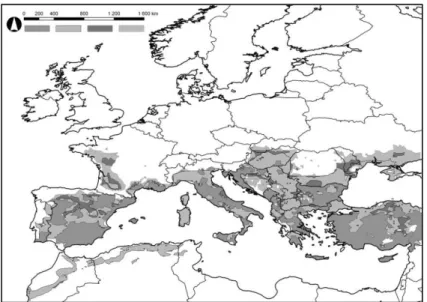
In the case of the mosquitoes and sand flies it is relatively easy, because they have only two active life stage. The environmental requirements of the vectors and parasites are only one of the important factors of the colonization of a disease, but are the most basic aspects. In case of Phlebotomus papatasi our model for the period of 2011-2070 predicts a continuous distribution area restricted to the Mediterranean and the Submediterranean areas of Europe without most parts of the Atlantic Region, as can be seen in Fig. 9.
Fig. 9. Model result of Phlebotomus papatasi. Current distribution (middle gray), modeled potential distribution in the reference period (light gray), modeled
potential distribution in the two future periods (2011-2040 – dark gray, 2041-2070 – light gray)
West Nile Virus is not native to Europe and its vectors are cold-tolerant species. As Fig. 10.
show, the relatively short and milder summers in the Atlantic are more important limiting factors of their distribution than cold winters themselves.
Fig. 10. Model result of West Nile Virus. Current distribution (middle gray), modeled potential distribution in the reference period (light gray), modeled potential distribution in the two future periods (2011-2040 – dark gray, 2041-2070 –
light gray)
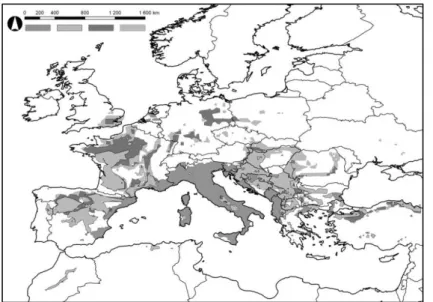
Tiger mosquito is sensitive to the low minimum ambient temperatures and require relatively wet environment, so due to climate change the expansion of this species is expected in the Atlantic Region, in the Balkan, the Iberian Peninsula and the western part of the Carpathian Basin (Fig. 11.).
Fig. 11. Model result of Aedes albopictus. Current distribution (middle gray), modeled potential distribution in the reference period (light gray), modeled potential distribution in the two future periods (2011-2040 – dark gray, 2041-2070 –
light gray)
Methodological questions, improvement of modeling
It is clear that the CEM method described in this paper gives results that illustrate the predicted effects of climate change well enough. However, including some other climatic (summarized heat, period endangered by frost) and non-climatic (edafic, such as carbonate content or pH) parameters could improve on results. The shortcoming of the method is that it selects only a few of the infinite combinations of the finite climate parameters and the selection is arbitrary. Advanced methodology can be attained by relieving the subjective parameter selection by more objective methods: either statistical or artificial intelligence (AI) ones. Numerous essential CEM methods are enumerated by Ibáñez (2006).
Moderation of subjectivity can be performed by logistic regression, cluster analysis and some classification methods. Major improvement can be achieved by AI algorithms, such as decision trees, genetic algorithm and artificial neural networks (ANN). The latter seems probably to be the best choice. There are some researches (Carpenter 1999, Özesmi 1999, Hilbert and Muyzenberg 1999, Özesmi 2006, Harrison 2010, Iverson 2008, and Ogawa- Onishi 2010) on the subject of modeling with artificial neural networks.
Conclusion
We can pronounce that the distribution range of the major vectors and the area of the vegetation of their habitat can be reliably drawn by the prediction methods based on regional climate models. We found that the CEM method is suitable for the co-modeling of vectorial and plant species. The back control of the requirements of the living beings based on the recent distribution area is an important and forward way in the modeling process. We aimed to extend our investigation to more plant species and diseases, and the comparative analysis of these species create a good practice of using various bioindicators for following and predicting the probable health and agricultural effects of climate change.
Acknowledgement
The research was supported by Project TÁMOP-4.2.1/B-09/1/KMR-2010-0005. The ENSEMBLES data used in this work was funded by the EU FP6 Integrated Project ENSEMBLES (Contract number 505539) whose support is gratefully acknowledged.
References
Bartholy J, Pongrácz R, Gelybó Gy: A 21. század végén várható éghajlatváltozás Magyarországon. Földrajzi Értesítő, 56(3-4): 147–168., 2007.
Bede-Fazekas Á: Melegigényes díszfák telepíthetőségi területének előrejelzése a 21. századra, dissertation, Corvinus University of Budapest, Budapest, Hungary, 2012a.
Bede-Fazekas, Á.: Methods of modeling the future shift of the so called Moesz-line. Applied Ecology and Environmental Research 10(2): 141-156., 2012b.
Carpenter, G.A., Gopal, S., Macomber, S., Martens, S., Woodcock, C.E., Franklin, J.: A Neural Network Method for Efficient Vegetation Mapping. – Remote Sensing of Environment 70(3): 326-338., 1999.
Czinkóczky A, Bede-Fazekas Á: Visualization of the climate change with the shift of the so called Moesz-line. In: Buhmann E, Ervin S, Pietsch M. Peer Reviewed Proceedings of Digital Landscape Architecture 2012 at Anhalt University of Applied Sciences. Herbert Wichmann Verlag, Berlin, Germany, 2012.
Czúcz B: Az éghajlatváltozás hazai természetközeli élőhelyekre gyakorolt hatásainak modellezése. Doktori értekezés, Budapesti Corvinus Egyetem, Budapest, 2010.
ENSEMBLES: The ENSEMBLES project RT3. http://ensemblesrt3.dmi.dk; 2012.10.28.
Führer E: Erdőgazdaság. In: Harnos Zs, Gaál M, Hufnagel L. Klímaváltozásról mindenkinek.
Corvinus University of Budapest, Faculty of Horticultural Science, Department of Mathematics and Informatics, Budapest, Hungary, 2008.
Harrison, S.; Damschen, E.I.; Grace, J.B.: Ecological contingency in the effects of climatic warming on forest herb communities, Proc Natl Acad Sci USA 107(45):19362-19367., 2010.
Hilbert, D.W., Muyzenberg, J.V.D.: Using an artificial neural network to characterize the relative suitability of environments for forest types in a complex tropical vegetation mosaic.
Diversity and Distributions 5(6): 263-274., 1999.
Horváth L.: Földrajzi analógia alkalmazása klímaszcenáriók elemzésében és értékelésében.
Dissertation. Corvinus University of Budapest, Budapest, Hungary, 2008.
Ibáñez, I, Clark, J.S, Dietze, M.C, Feeley, K, Hersh, M, Ladeau, S, McBride, A, Welch, N.E, Wolosin, M.S.: Predicting Biodiversity Change: Outside the Climate Envelope, beyond the Species-Area Curve. Ecology 87(8): 1896-1906., 2006.
Iverson, L.R.; Prasad, A.M.; Matthews, S.N.; Peters, M. Estimating potential habitat for 134 eastern US tree species under six climate scenarios, Forest Ecology and Management 254(3):
390-406., 2008.
Kovács-Láng E, Kröel-Dulay Gy, Czúcz B: Az éghajlatváltozás hatásai a természetes élővilágra és teendőink a megőrzés és kutatás területén. Természetvédelmi Közlemények 14(1): 5-39., 2008.
Moesz, G.: Adatok Bars vármegye flórájához. Botanikai Közlemények 10(5-6): 171-185., 1911.
Nakicenovic, N., Swart, R. eds.: Emissions Scenarios. Cambridge University Press, Cambridge, UK, 2000.
Ogawa-Onishi, Y., Berry, P.M., Tanaka, N. Assessing the potential impacts of climate change and their conservation implications in Japan: A case study of conifers, Biological Conservation 143(7): 1728-1736., 2010.
Özesmi, S.L., Özesmi, U.: An artificial neural network approach to spatial habitat modelling with interspecific interaction. Ecological Modelling 116(1): 15-31., 1999.
Özesmi, S.L., Tan, C.O., Özesmi, U.: Methodological issues in building, training, and testing artificial neural networks in ecological applications. Ecological Modelling 195(1-2): 83-93., 2006.