University of West Hungary Faculty of Forestry
Pál Kitaibel Doctoral School of Environmental Sciences
Modelling the future distribution of beech at low-elevation xeric limits
- comparison of empirical and stochastic models
DOCTORAL (PHD) DISSERTATION
Ervin Rasztovits
Supervisor: Prof. Dr. Csaba Mátyás
Sopron
2011
2
3
Modelling the future distribution of beech at low-elevation xeric limits
- comparison of empirical and stochastic models
Értekezés doktori (PhD) fokozat elnyerése érdekében készült a Nyugat- magyarországi Egyetem Kitaibel Pál Környezettudományi Doktori Iskolájának
Biokörnyezet-tudomány programja keretében
Írta:
Rasztovits Ervin
Témavezető: Prof. Dr. Mátyás Csaba
Elfogadásra javaslom (igen / nem) ………..
aláírás A jelölt a doktori szigorlaton ...%- ot ért el.
Sopron, ……….. ………
...
a Szigorlati Bizottság elnöke Az értekezést bírálóként elfogadásra javaslom (igen / nem)
Első bíráló (Dr. ………) igen / nem ………
(aláírás)
Második bíráló (Dr. ………) igen / nem ………
(aláírás) A jelölt az értekezés nyilvános vitáján ………..%-ot ért el.
Sopron, ... ...
a Bírálóbizottság elnöke A doktori (PhD) oklevél minısítése:………
...
Az EDT elnöke
4
5
Contents
Abstract / Kivonat………. 7
1 Introduction ... 8
2 Literature review ... 10
2.1 Climate change ... 10
2.1.1 Global changes ... 10
2.1.2 Climate change in Europe ... 11
2.1.3 Climate change in Hungary ... 11
2.1.4 Uncertainty of climate models ... 14
2.2 The effect of global climate change on forests ... 16
2.2.1 Drought-induced tree mortality and forest die-off ... 16
2.2.2 Plant physiology and biotic agents ... 19
2.2.3 Climate change and future mortality rate ... 20
2.2.4 Decline model (factors and their interactions) ... 20
2.3 Ecology of beech ... 22
2.3.1 The current distribution range of European beech ... 22
2.3.2 Ecological and climatic constraints of the distribution of beech ... 24
2.3.3 Beech provenace trials ... 27
2.4 Beech in Hungary ... 27
2.4.1 Beech associations in Hungary ... 29
2.4.2 Beech decline in Hungary ... 30
2.5 Distribution modelling ... 34
2.5.1 Distribution models ... 34
2.5.2 Process based models ... 37
2.5.3 Hybrid models ... 38
2.5.4 Empirical models ... 38
2.5.5 Critical evaluation ... 39
2.6 The problem of modelling the xeric limit ... 39
2.7 Distribution modelling of European beech ... 40
2.7.1 Distribution modelling of beech on European scale ... 40
2.7.2 Distribution modelling of beech on national level ... 41
2.7.3 Distribution modelling of beech in Hungary ... 44
1.1.1. Gaps ... 52
3 Materials and Methods ... 53
3.1 Climate database ... 53
3.1.1 Climate data for current conditions (1950-2000) ... 53
3.1.2 Meteorological database (1975-2006) ... 53
3.1.3 Scenarios for the future ... 58
3.2 Species distribution models (SDMs) using long-term climate data ... 61
3.2.1 The ModEco platform ... 61
3.2.2 Environmental layers ... 61
3.2.3 Factor analysis ... 64
3.2.4 Modelling methods ... 65
3.2.5 Accuracy assessment ... 67
3.3 Extreme drought event based empirical model (EM) ... 69
3.3.1 Study area ... 69
6
3.3.2 The extreme drought period of 2000-2003 ... 73
3.3.3 Forest data... 75
3.3.4 Vitality response of beech ... 75
4 Results ... 77
4.1 SDMs using long-term climate data ... 77
4.1.1 Performance of presence-only methods ... 77
4.1.2 Performance of presence/absence classification methods ... 79
4.1.3 Factor importance analysis ... 84
4.2 Extreme drought event based empirical model (EM) ... 85
4.2.1 Vitality response of beech ... 85
4.2.2 Simulation results of beech vitality in the future ... 85
5 Discussion ... 89
5.1 Performance of the SDMs ... 89
5.1.1 Actual and potential current distribution ... 89
5.1.2 Future potential distribution ... 90
5.1.3 Regional differences ... 91
5.1.4 Correlates of beech distribution ... 92
5.2 Performance of the EM ... 93
5.3 Comparison of stochastic (BP-ANN) and empirical model ... 94
5.4 Outlook ... 95
6 Summary ... 97
6.1 Introduction ... 97
6.2 Materials and methods... 98
6.3 Results ... 99
7 Utilization of the results ... 103
7.1 Utilization of the meteorological database ... 103
7.2 Utilization of the modelled distribution/vitality conditions results ... 103
7.3 Potential utilizations ... 104
8 Conclusions ... 105
9 Theses ... 107
10 Acknowledgements ... 108
11 References ... 109
12 Web references ... 131
13 List of tables ... 132
14 List of figures ... 133
15 Annex ... 137
7
Abstract
Modelling the future distribution of beech at low-elevation xeric limits - comparison of empirical and stochastic models
Potential future distribution of beech (Fagus sylvatica L.) was modelled for three terms (2025, 2050 and 2100) in the XXI. century in Hungary using stochastic species distribution models (SDMs) and a novel extreme drought event based empirical approach (EM). Although new SDM algorithms generally outperformed established ones, except the artificial neural networks all models performed poorly under future climate. Even advanced models failed in regions, where beech is situated close to its distributional range limit. Sanitary logging information as a proxy of vitality status was coupled with the modified Ellenberg’s climate quotient in a selected study area to obtain the vitality response of beech in the EM.
Prediction for 2025 obtained from the EM was in agreement with those of the SDM, but for the end of the century the EM predicted a more serious decline in all regions of Hungary.
The result of the comparison suggests that the increasing frequency and severity of extremes could play an important role in limiting the distribution of beech in the future.
Kivonat
A bükk jövőbeni elterjedésének modellezése az alsó szárazsági határ közelében - empirikus és korrelatív elterjedés modellek összehasonlítása
A bükk (Fagus sylvatica L.) potenciális jövőbeni elterjedésének modellezését végeztem el három jövőbeni időpontra (2025, 2050 és 2100) korrelatív elterjedés-modellek és egy új extrém szárazsági eseményen alapuló empirikus megközelítés segítségével. A korrelatív modellek általában jól teljesítettek a jelenlegi előfordulás leírásánál, de az alkalmazott nyolc módszerből csupán egy, a neurális hálózatok elvén működő modell adott konzisztens becslést a jövőre. Még a legfejlettebb algoritmusok is jelentős túlbecslést mutattak azokban az erdészeti tájakban, ahol a bükk az alsó szárazsági elterjedési határa közelében található, amely egyértelműen jelezte ezen statikus modellek alkalmazhatóságának korlátait. Az empirikus modellben a bükk szárazságra adott vitalitás-válaszreakciójának meghatározásához egészségügyi kitermelési adatok kerültek összevetésre a módosított Ellenberg indexszel a 2000 – 2003-as bükkpusztulással érintett délnyugat-magyarországi mintaterületen. Az empirikus és korrelatív modellek közeljövőre adott becslése hasonló volt, de a század végére az extrém szárazsági eseményen alapuló empirikus modell sokkal nagyobb mértékű vitalitás-gyengülést jelzett előre. Az eredmények alapján valószínűsíthető, hogy a klímaváltozással gyakoribbá és súlyosabbá váló száraz időszakok fontos szerepet játszanak a bükk jövőbeni előfordulásának alakításában.
8
1 Introduction
Although Fagus sylvatica L. is one of the dominant tree species’ in central European temperate forests with high physiological tolerance and competitiveness (Ellenberg et al., 1992), drought sensitivity is assumed to be a key factor limiting growth and distribution of beech near to its lower distributional limit (xeric limit) (Mátyás et al., 2009) in southern and south-eastern Europe (Backes and Leuschner, 2000).
Several studies suggest a decline in beech regeneration (Rennenberg et al., 2004; Penuelas et al., 2007) or extensive beech dieback (Berki et al., 2009; Czúcz et al., 2011; Kramer et al., 2010; Lindner et al., 2010) with worsening climatic conditions (Gálos et al., 2007).
Consequently modelling the vitality response of beech to predicted changes of climate is a critical issue (Franke and Köstner, 2007; Mátyás, 2009).
Drought is a common phenomenon of continental climate, supported also by historical datasets in Hungary (Pálfai et al., 1999). A significant drought event emerged between 2000 and 2003 in Southwest of Hungary which was unprecedented in duration and strength since the beginning of the 50’s. After this drought event large volume of declining or already dead beech was logged by forest managers supervised by forest inspectors. First, solitary trees showed the typical symptoms of reduced water availability (leaf yellowing, top drying) in 2002. The symptoms of xylo- and phloeophagous insect attack (Agrilus viridis, Taphrorychus bicolor) and fungal infection (Biscogniauxia nummularia, Nectria coccinea) appeared in 2003 and expanded rapidly after 2004 (Lakatos and Molnár, 2009).
For management and conservation issues (Hannah et al., 2002) species distribution models (SDMs) have been extensively used. SDMs connect the species’ environmental requirements of the localities where it is currently known to occur. They can be evaluated for their ability to predict current distributions but it is not tested whether models that are successful in predicting current distributions are equally powerful in predicting distributions under different climates. Studies comparing modelling algorithms are now common (Segurado and Araujo, 2004; Elith et al., 2006; Tsoar et al., 2007), but Thuiller et al. (2004) have pointed out the problem of strong variation between SDM predictions of future distributions. SDMs are
“statistical” models without specific ecological knowledge, they do not describe “cause and effect” between model parameters and response (Guisan and Zimmermann, 2000; Pearson and Dawson, 2003; Kearney and Porter, 2004).
Empirical models (EM) are considered superior for understanding the relationship between climate and the distribution of species (Woodward and Rochefort, 1991; Malanson et al., 1992; Prentice et al., 1992; Guisan and Zimmermann, 2000) and have been used to study the effects of climate change on distribution and production of trees and crops (Rosenzweig and Parry, 1994; Hijmans, 2003). In an EM, the distribution of a species is defined by functions based on ecological response of that species. A drawback of EMs is that ecological data limiting the distribution are not available for most species.
The multidimensional climatic envelope created by niche based models is often described by long-term averages, but long-term climatic means do not express the importance of extreme drought events, which act as triggering effect on growth decline and pests or diseases attacking populations of weakened vitality causing mortality (Bréda et al., 2006; Lakatos and Molnár, 2009).
9 Aim and scope
The aim of this study was to develop a consistent method to model potential future distribution of beech (Fagus sylvatica L.) near to the xeric limit with respect to the specific (ecological and climatic) problems of the region. Most of the species distribution models do not differentiate between the “leading” and “trailing” edge, although the processes are fundamentally different (Mátyás and Nagy, 2005; Aitken et al., 2008). Xeric limits of distribution are determined by climatic aridity, modified by local soil water regime conditions. These limits are more difficult to trace than thermal “upper” limits. This ecologically and climatically specific area has been chosen for the modelling which is largely neglected by European studies (Jump et al., 2009; Lindner et al., 2010; Mátyás, 2010).
Beech is considered a climate sensitive species, which is uniquely vulnerable in the region, therefore well suited for modelling. Another advantage is, that compared to other tree species in Hungary it is in a relatively natural condition as it was seldom regenerated artificially and its reproductive material was not subject to commercial relocations (Mátyás, 2010).
In this work it was hypothetised that:
the fitness of beech with worsening climatic conditions declines gradually and ends up in mass mortality when reaching the genetically set tolerance limit,
this decline is strongly connected to certain extreme drought events and the relationship could be described using an EM,
the EM could provide a better tool for predicting potential future distribution of beech near the xeric limit than SDMs.
The following scientific questions were addressed:
1. Which SDM can best describe the present distribution of beech in Hungary?
2. What is the relationship between weather conditions and vitality status of beech?
3. What are the projections for the potential future distribution of beech using SDMs and vitality condition using an EM?
To answer the research questions first (1) the current and potential future distribution of beech was modelled in Hungary using different SDMs, (2) sanitary logging information of beech as a proxy of vitality condition was coupled with meteorological data to obtain the vitality response of beech, (3) the future vitality status of beech was modelled and compared to different terms of this century by applying the same regional climate model projection as used for the SDMs.
10
2 Literature review
2.1 Climate change
2.1.1 Global changes
Since 1900 the global surface temperature of the Earth has risen by about 0.8°C. The closing decades of the twentieth century and the early years of present century were unusually warm. Globally, the last 30 years have been the warmest since accurate records began over 100 years ago (Figure 1).
Figure 1: Global surface temperature (land and sea) HADCRUT3 (Climatic Research Unit, http://www.cru.uea.ac.uk).
This temperature increase occurred during a significant atmospheric concentration increase of some greenhouse gases, especially CO2 and CH4, which is known to be mainly due to human emissions. The fourth report of the IPCC (2007) stated clearly the anthropogenic climate change: “Most of the observed increase in global average temperatures since the mid-20th century is very likely due to the observed increase in anthropogenic greenhouse gases concentrations.”
Even under conservative scenarios, future climate changes are likely to include further increases in mean temperature (about 2–4 :C globally) with significant drying in some regions (Christensen et al., 2007), as well as increases in frequency and severity of extreme droughts, hot extremes, and heat waves (IPCC, 2007; Sterl et al., 2008). The source of the uncertainty in the temperature range originates from the different emission scenarios and uncertainty in the feedback processes (e.g. clouds).
11 2.1.2 Climate change in Europe
In case of Europe, it is likely that the increase of annual mean temperature will exceed the global warming rate in the 21st century. The largest increase is expected in winter in northern Europe and in summer in the Mediterranean area (Figure 2).
Figure 2: Temperature and precipitation changes over Europe from the MMD-A1B simulations. Top row: Annual mean, winter (DJF) and summer (JJA) temperature change between 1980 to 1999 and 2080 to 2099, averaged over 21 models. Middle row: same as top, but for fractional change in precipitation. Bottom row: number of models out of 21 that
project increases in precipitation (IPCC, 2007).
For precipitation, the annual sum is very likely to increase in northern Europe and decrease in the Mediterranean area (IPCC, 2007). The largest decrease is expected in the Mediterranean during the summer months.
2.1.3 Climate change in Hungary
For the 20th century several climate extreme indices have been studied for Hungary (Bartholy and Pongrácz, 2007). Strong increasing trends have been observed in Central Europe for the annual numbers of hot days, summer days, warm days and warm nights in the second half of the 20th century. Additionally, intensity and frequency of extreme precipitation events have increased, while the total precipitation amount has decreased (Bartholy and Pongrácz, 2007).
12
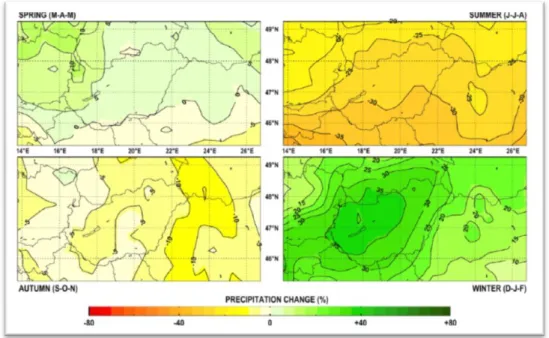
In Hungary, which is located at the transitional zone of these regions, precipitation is likely to increase in winter, while decrease in summer. In case of the summer drought events, the risk is likely to increase in Central-Europe and in the Mediterranean area due to decreasing summer precipitation and increasing spring evaporation (Figure 3).
Figure 3: Projected precipitation increase over Hungary for 2071-2100 using the A2 scenario (Bartholy et al., 2007).
In summer, the projected precipitation decrease is 24-33% (A2) and 10 – 20% (B2). In winter, the expected precipitation increase is 23 – 37% (A2) and 20 –27% (B2) (Bartholy et al., 2007).
Concerning air temperature, the largest increase is expected in summer, while the smallest increase in spring. The expected summer warming ranges are 4.5 – 5.1°C and 3.7 – 4.2°C for the A2 and B2 scenario, respectively. In case of spring, the expected temperature increase inside Hungary is 2.9 – 3.2°C (for A2 scenario) and 2.4 – 2.7°C (for B2 scenario).
Figure 4: Projected temperature increase over Hungary for 2071-2100 using the A2 scenario (Bartholy et al., 2007).
13
Droughts are common characteristic of the climate in Hungary supported also by historical data (Szinell et al., 1998). Similar to global and continental trends, annual mean temperatures became higher during the second half of the 20th century and the most affected region was Northwest Hungary (Szalai et al., 2005).
Figure 5: Change of the annual mean temperature during 1975-2004 in Hungary using linear trend analysis (Szalai et al., 2005).
Precipitation has decreased during the last century; the strongest negative trend appeared in West-Hungary (Szalai et al., 2005).
Figure 6: Change of the annual precipitation sum during 1951-2004 in Hungary using linear trend analysis (Szalai et al., 2005).
Gálos et al., (2007) have analyzed the dry events in Hungary using the regional climate model REMO for the 21st century. Drought periods were defined by considering the deviations of the modelled precipitation (>5% at annual and >15% at summer level) from the climate period 1961–90.
Based on the results of three IPCC scenario simulations (B1, A1B, A2), the probability of drought events will be higher in the second half of the 21st century (Figure 7).
14
Figure 7: Total number of dry years (left) and dry summers (right) (Gálos et al., 2007).
According to the scenarios A1B and A2 a drought summer may happen every second year, compared to the reference term (1961-1990) and the dry periods will last longer. The intensity of dry events increases also significantly in all scenarios compared to the control period.
For the 21th century climate simulation results agree on increasing frequencies of warm extremes (i.e. heat waves, hot periods) and on decreasing probability of cold extremes (i.e.
frost days, cold days) compared to 1961-1990. In summer, the strong warming and drying may increase the probability of severe droughts (Mika 1988, 2007; Bartholy et al., 2007).
2.1.4 Uncertainty of climate models
The numerical climate models, both global (GCMs) and regional (RCMs) have undergone considerable improvements recently and many experiments have been realized. All models simulate the present-day temperature and (to some degree) precipitation adequately on large scales (Randall et al., 2007), and simulated trend patterns are consistent with observations (Hegerl et al., 2007) if models are forced with all radiative forcings. Projected future warming patterns are robust (Meehl et al., 2007), but global temperature change is uncertain by approximately 50% (Knutti et al., 2008) owing to carbon cycle uncertainties (Friedlingstein et al., 2006) and models differing in their feedbacks (Bony et al., 2006).
Models project changes in precipitation, extreme events (Tebaldi et al., 2006) and many other aspects of the climate system that are consistent with our understanding, but agreement between models declines from continental (regional) to local scales. The simulations of present and past climate help to improve our understanding of processes in the climate system, but it is not possible for any model to exactly simulate the full complexity of the climate system (Räisänen, 2007). That is why the results of climate models can only be taken as climate projections with numerous uncertainties.
The uncertainties in climate models output can be attributed to variations of the initial conditions or boundary conditions provided by the GCMs, as well as parameterizations and the fact that models are imperfect (Stainforth et al., 2007; Tebaldi and Knutti, 2007).
The initial conditions uncertainty comes from the deterministic chaotic nature of weather and the resulting sensitivity to the initial state. The initial condition problem is eliminated by running multiple ensemble members (simulations with the same model, parameters,
15
boundary conditions and scenario, but slightly different initial conditions) or by averaging over longer time periods.
The boundary conditions-related uncertainty emerges from the fact that the regional climate models need determined values of variables on the border of the selected domain. Applying of different regional climate models with the same GCM may produce significantly different results. As it is not possible to simulate processes acting on spatial scales smaller than the model resolution (current RCMs have horizontal resolution of 10-50 km), the impact of these processes on large scale variables needs to be parameterized. This is the source of parameter uncertainty. The behaviour of a climate model in response to a forcing scenario on multi-decadal time scales is determined much more by the details of its parameterizations rather than the initial state (Annan and Hargreaves, 2007).
Another important source of uncertainty in case of model simulations of future climate is that we do not know the effect of all natural and anthropogenic forcings on the climate system. The natural forcings include in particular changes in solar and volcanic activity. The anthropogenic forcings include greenhouse gas emissions, aerosol emissions and changes in land-use.
Land-use change influence the climate by physical, chemical and biological processes, which affect the hydrological cycle and composition of the atmosphere. In general, tropical forests cool the climate by evapotranspiration on the other hand boreal forests have warming effect due to the low albedo (Bonan, 2008). In the Carpathian Basin the land use change contributed to the warming of the summer half-year by approximately 0.1°C, albeit forest cover has significantly increased (Drüszler et al., 2009). The uncertainty in greenhouse gas emissions has led the Intergovernmental Panel on Climate Change (IPCC) to the creation of a set of future emission scenarios (SRES scenarios) (Nakicenovic and Swart, 2000). Climate modellers will conduct new climate model experiments using the time series of emissions and concentrations associated with four Representative Concentration Pathways (RCPs), as part of the preparatory phase for the development of new scenarios for the IPCC's Fifth Assessment Report (expected to be completed in 2014).
Finally, all current climate models are known to be empirically inadequate in the sense that no set of parameters can always fit the observations within their uncertainty (Sanderson et al., 2008).
The summer drying problem is a disadvantageous feature of climate models in Central- Europe. A strong bias towards an extensive drying of the soil was detected during summer months in large areas of the Danube river basin, where the largest differences occurred in the Hungarian Lowlands. The validation has shown that summer months temperatures are overestimated (Figure 8).
16
Figure 8: Validation for the monthly temperature (T) means (Hungarian mean, 1961- 1990). Bars represent the spread of values within the 30-year period (Gálos, 2010).
The reasons for the disagreement between simulated and observed precipitation and temperature in the Danube river basin are not clear yet. The solution is complex and requires a more detailed investigation.
2.2 The effect of global climate change on forests
The effects of climate change on forests include some positive (e.g. increases in growth from CO2 fertilization, longer growing season and colonisation in the leading edge) but mainly negative effects (e.g. reduced growth and increases in stress and local extinction due to mass mortality in the trailing edge).
2.2.1 Drought-induced tree mortality and forest die-off1
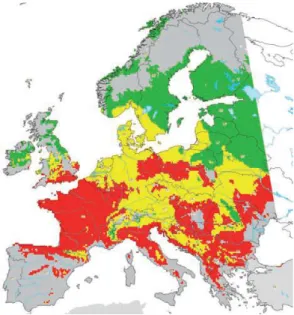
Increases in the frequency, duration, and severity of drought and heat stress connected with global climate change could fundamentally change the composition, structure, and distribution of forests. Increased tree mortality and die-offs triggered by drought are well documented for Europe and for temperate and boreal forests of North America (van Mantgem et al., 2009).
Forest mortality in Europe
Examples of forest mortality due to dry and warm conditions in the 1990’s and 2000’s in Europe (Table 1) includes increased death among many tree species in Spain (Penuelas et al., 2001), increased mortality of oak, fir, spruce, and pine species in France after the extreme heat wave and drought during the summer of 2003 (Bréda et al., 2006; Landmann et al., 2006), and increases in mortality of Pinus sylvestris near the species’ range limits in Switzerland and Italy (Dobbertin and Rigling, 2006; Bigler et al., 2006).
Summer drought has been tied with biotic stressors and led to mortality of Quercus robur in Poland (Siwecki and Ufnalksi, 1998), Picea abies in Norway (Solberg, 2004), and Picea obovata in northwest of European Russia (Kauhanen et al., 2008).
1die-off: a sudden sharp decline of a population of animals or plants that is not caused directly by human activity
17
Regionally extensive increase in the mortality of Fagus sylvatica was only reported from France (Ardennes, Vosges), Germany (Baden-Württemberg) (Petercord, 2008) and Hungary (Lakatos and Molnár, 2009).
Table 1: Documented drought and/or heat-induced mortality events in Europe, 1990–
2010 (Allen et al., 2010).
Location Year(s) of mortality
Dominant tree/
taxa
Spatial concentration
of mortality within geographic or elevational range
Stand/
population level mortality
(%)
Scale of impact/
area affected
Biotic agents associated with mortality
Reference
Italy
(South Tyrol) 1992 Pinus sylvestris
Lower/southern edges of ranges
- Landscape–
subregional insects Minerbi (1993) Austria
(Lower Austria) 1990-1996 Pinus sylvestris, Pinus nigra
Lower edge of
elevational range 27.6-49.2 Stand–
landscape Various insects Cech and Tomiczek (1996) Austria (Tyrol) 1991-1997 Pinus sylvestris Lower edge of
elevational range 10.0-70.0 landscape Various insects Cech and Perny (2000) Italy (Aosta) 1985-1998 Pinus sylvestris Lower/southern
edges of ranges - Landscape–
subregional
Fungi (Armillaria spp.);
wood borers
Vertui and Tagliaferro (1998) Spain
(Northeast, Central, South)
1994, 1998
Quercus spp., Pinus spp., Juniperus spp.
Patchy within elevational range;
southern edge of geographic range
0.0-19.4 Landscape–
subregional Not reported
Penuelas et al., (2001);
Lloret et al., (2004);
Martinez-Vilalta and Pinol (2002) France
(Ardennes, Vosges)
1998 Fagus sylvatica Middle of ranges 5-30
Subregional;
patchy across
~200.000 ha
non French Forest Health Department (1998–1999)
Norway 1992-2000 Picea abies Patchy across
ranges 2-6.6 Landscape–
subregional
Bark beetles (Polygraphus poligraphus)
Solberg (2004)
Greece (Samos) 2000 Pinus brutia Lower edge of
elevational range - Not reported Not reported Körner et al., (2005);
Sarris et al., (2007)
Austria (Tyrol) 2001 Pinus sylvestris Lower edge of
elevational range - Landscape–
subregional Not reported Oberhuber (2001)
Greece (South,
Central) 2000-2002 Abies
cephalonica Not reported
5-10/yr in drought 0.17-0.50/
yr in non- drought
Landscape
Primary role, bark beetles (Phaenopsknote
ki, Pityokteines spinidens)
Tsopelas et al., (2004);
Raftoyannis et al., (2008)
Switzerland 2003 Picea abies Not reported ~2.0Mm3 timber lost
Landscape–
subregional
Bark beetles (Ips typographus)
Forster et al., (2008)
Switzerland (Valais)
1973-1976, 1987-1993, 1996-2000, 2000-2004
Pinus sylvestris Lower/southern
edges of ranges 7–59 Landscape–
subregional
Primary role, bark beetles (Phaenops cyanea, Ips acuminatus);
nematodes;
mistletoe
Wermelinger et al., (2008);
Dobbertin et al., (2007);
Bigler et al., (2006);
Dobbertin and Rigling (2006); Rigling et al.,
(2006);
Dobbertin et al., (2005);
Rigling and Cherubini (1999)
18
Location Year(s) of mortality
Dominant tree/
taxa
Spatial concentration
of mortality within geographic or elevational range
Stand/
population level mortality
(%)
Scale of impact/
area affected
Biotic agents associated with mortality
Reference
Germany (B.-
Württemberg) 2003-2006 Fagus sylvatica Not reported ~98.000m3 timber lost
Landscape–
subregional
Bark, ambrosia beetles (Taphrorychus
bicolor, Trypodendron domesticum);
wood borer
Petercord (2008)
Russia
(Northwest) 2004-2006 Picea obovata Patchy 208Mm3 timber lost
~1.9Mha affected
Bark beetles (Ips typographus),
fungi
Shtrakhov (2008);
France (Provence, Southern Alps)
2003-2008 Pinus sylvestris Lower/southern edges of ranges
20–80
Subregional;
patchy across
~100.000 ha
Bark beetles Vennetier et al., (2007);
Thabeet et al., (2009)
France 2003-2008
Quercus spp.
Fagus sylvatica, Abies spp., Picea abies,
Pinus spp.
Lower and middle of elevational range
1–3/yr Regional Bark beetles;
fungi
Breda et al., (2006);
Landmann et al., (2006);
Rouault et al., (2006);
French Forest Health Department (2003–2008) France (Eastern
Pyrénées) 2003-2008 Abies alba
Lower edge to middle of ranges
10–30
Subregional;
patchy across
~150.000 ha
(Ips, Pissodes spp.)
French Forest Health Department (2003–2008) France
(Provence, Maures Mountains)
2006-2008 Quercus suber
Northern edge to middle of geographic
range
10–70
Subregional;
patchy across
~120.000 ha
Insects (Platypus spp., Coroebus spp.)
Vennetier et al., (2008)
It is important to outline that Table 1 - contrary to the name of the table - contains mortality events where the drought and heat was only “contributing factor”. This is mainly in association with the die-off of the Pinus species. Furthermore the author uses the “bark beetle”phrase for species, which taxonomically does not belong to the above mentioned group (e.g.: Pissodes spp.).
The rate of mortality could span a wide range from modest and short-lived local increases of background mortality rates to acute, regional or landscape-scale forest die-off.
The temporal pattern of mortality is difficult to interpret because of the lag effect, but the documented data suggest, that die-off events are clearly connected with single extreme events. Mortality due to the decline has been shown to occur years or even decades after the drought stress (Góber, 2005; Bigler et al., 2006).
The dataset from Europe confirms, that drought-related forest mortality has been reported in most cases from the range margins (geographic or elevational) where climatic factors (particularly water) are often limiting (Jump et al., 2009). Greater mortality can occur also on optimum sites within the middle of the distribution range (Horner et al., 2009; Klos et al., 2009), where higher tree density results increased competition for water. Trees in optimum conditions often do not invest in adequate root systems and become hydraulically overextended.
19 Examples from North America
Drought and heat across western North America in the last decade have led to extensive insect outbreaks and large scale mortality in many forest types, affecting ~20 million ha and many tree species from Alaska to Mexico (Raffa et al., 2008). Examples of forest die-offs close to the xeric limit cover millions of hectares of Populus tremuloides (Saskatchewan and Alberta) (Hogg et al., 2008) and Pinus edulis in the Southwestern U.S. (Shaw et al., 2005).
It should be outlined that forests of the above mentioned Pinus species can be found in natural conditions with low or no human impact.
Forest mortality in Hungary
The first large scale forest mortality partly connected to climatic factors was the oak decline2 in the late 80’s. Igmándy (1987) reported that the decline of Q. petraea in Hungary began in 1978 in the colline northeast and extended within three years to the whole of the country.
The symptoms of the oak decline were very complex. Macrosymptoms included: crown transparency, yellowing, excessive twig abscission, dieback3 of branches and the whole crown, epicormic sprouts on branches and trunk (Führer, 1998). Oak mortality was originally identified as a disease caused by fungi earlier mainly saprophytic, and turning to virulent, it was later admitted that the primary reason triggering the pandemy was climatic. The total extent and damage of the dieback hitting sessile oak stands in the Northern Mountain Range and in Transdanubia may be assessed to damaging ca. 35% of all stands above the age of 40 years, amounting to a total damage of 2.5 million m3 (Mátyás et al., 2009).
Subregional (Sopron and Kőszeg-mounteains) mass mortality of man-made Picea abies stands started in the early ’90s. The hot and dry summers, the decrease on winter precipitation were favourable for Ips typographus, which produced up to three generations per year. The outbreak of Ips typographus and Pityogenes chalcographus resulted in a strong decrease of this tree species (1990: 1.4%, 2008: 0.7%) and a high volume (~ 800.000 m3) of sanitary cuttings (Lakatos, 1997; Lakatos, 2006).
The mass mortality of beech in Hungary is discussed later.
2.2.2 Plant physiology and biotic agents Physiological response of trees to drought
The fundamental ecophysiological mechanisms controlling survival and mortality of trees during drought is still poorly understood (Bréda et al., 2006; Ogaya and Penuelas, 2007).
Raising temperature increases the vapour pressure deficit and evaporation to the atmosphere, which could results in increased water loss through transpiration. Two type of stomatal regulation mechanism exists to avoid severe consequences. The first is the drought avoidance (isohydric species), by which stomata close at a water potential threshold to minimize further transpiration. The second is drought tolerance (anisohydric species), by which stomatal closure is less severe and transpiration continues at relatively high rates (McDowell et al., 2008). The isohydric response protects xylem from cavitation through avoidance of low water potentials, but can cause eventual carbon starvation as stomatal
2 decline: a disease that gradually weakens the body; to tend toward an inferior state or weaker condition
3 dieback: a condition in woody plants in which peripheral parts are killed
20
closure shuts down photosynthesis while respiration costs continue to eat up carbon stores.
The anisohydric response can allow continued carbon gain through maintaining open stomata but at greater risk of cavitation, which might kill trees directly or could increase the likelihood of future carbon deficits. It is important to outline, that trees have the ability to shift allocation of resources and change their hydraulic architecture throughout their lifetime (McDowell et al., 2008).
Biotic agents and tree mortality
There is evidence that biotic agents are often involved in vegetation mortality (Molnár et al., 2010) and plant survival may be increased via application of insecticides or semiochemicals (Lakatos, 1997). Not all species of insects, fungi and bacteria benefit from drought. Bark beetles, which are the major mortality agents in the northern hemisphere, are restricted to rare, highly stressed trees under optimal conditions because they lack sufficient numbers to conduct mass attacks that can overcome the defenses of vigorous trees (Boone et al., 2011).
Population growth occurs when warm temperatures and/or the high number of breeding trees (windthrow) favour reproduction (Csóka 1997; Gan, 2004), and when environmental stress decreases plant defense (drought). Under these circumstances, population growth of the biotic agents can generate positive feedbacks through synchronized attacks that overwhelm the defenses of otherwise healthy trees. The final steps in biotic driven mortality can be the hydraulic failure associated with fungal occlusion of xylem or destruction of resource-acquiring tissues, such as foliage or roots (McDowell, 2011).
2.2.3 Climate change and future mortality rate
Plants adapted to historic climates might be exposed to novel, extreme conditions that overwhelm their acclimatory responses. For example, rising temperatures are likely to increase carbohydrate consumption owing to the temperature dependence of respiration (despite acclimation), particularly during extreme high temperature (McDowell, 2011).
Extreme temperatures damage photosynthetic apparatus, reducing photosynthesis and increasing carbohydrate use for repair (Mészáros et al., 2007). Temperature rise can increase insect population growth owing to reduced over-winter mortality, decreased generation times, greater host vulnerability and access to vulnerable hosts following range expansion.
Decreased water availability will compound temperature effects, by increasing cavitation and reducing xylem refilling, photosynthesis and phloem transport. Rising temperature increases evaporative demand, forcing greater stomatal closure and higher ecosystem evaporation, thus accelerating progression of mortality mechanisms (Mészáros et al., 2007).
2.2.4 Decline model (factors and their interactions)
Tree mortality commonly involves multiple, interacting factors. Based on the decline spiral model (Manion, 1991), drought can operate as an ‘‘inciting factor’’ that may ultimately lead to mortality in trees that are already under stress (by ‘‘predisposing factors’’ such as old age, poor site conditions) and result to consequent stem and root damage by biotic agents (‘‘contributing factors’’ such as insects and fungal pathogens).
McDowell et al. (2008) states three mutually non-exclusive mechanisms by which drought could lead to broad-scale forest mortality:
extreme drought and heat kill trees through cavitation within the xylem;
21
elongated water stress results carbon deficits and metabolic limitations that lead to carbon starvation and reduced ability to defend against attack by biotic agents such as insects or fungi and,
extended warmth during droughts can drive increased population abundance in these biotic agents, allowing them to overwhelm their already stressed tree hosts.
Genetic background of tree mortality
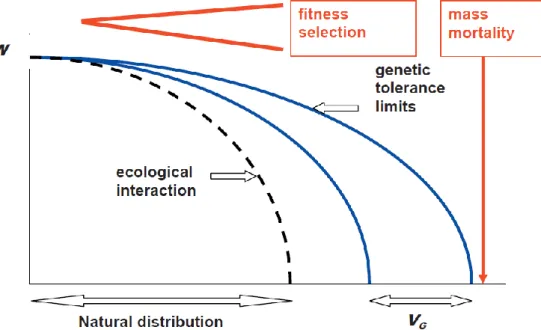
Bioclimatic modelling of distribution ranges is based on the concept that distributional patterns depend on the physiological tolerance limits to climate. Tolerance can be defined as the ability of a genotype to maintain its fitness despite damage (phenotypic plasticity). This physiological tolerance is determined by genetics. Thus, adaptive response to environmental stress is ultimately a genetic issue, and bioclimatic modelling is basically dealing with the search for the genetically set tolerance limitations (Mátyás et al., 2008) (Figure 9).
Figure 9. Ecological-genetic model of fitness decline and mortality triggered by worsening of climatic conditions. The phenotypic variance of limits of tolerance (VG) represents the basis of natural selection. Due to interactions in the ecosystem, the natural distribution is usually
stronger limited, than the genetically set critical tolerance (Mátyás, 2006).
Phenotypic plasticity provides the ability of instant acclimation without any change in the inherited genetic resources. Mainly for reasons of difficulty of experimental analysis, reaction norms and limits of adaptability set by phenotypic plasticity are rarely considered in connection with adaptation. It is an often underestimated issue both in forest genetics and ecology, in spite of the fact that considering the speed and magnitude of predicted changes, phenotypic plasticity is the most important and practically only natural buffering mechanism (Mátyás and Nagy, 2005).
22 Consequences (biotic and abiotic) of forest mortality
Trees grow relatively slowly but can die within a few months to a few years; therefore, mortality of trees can result in rapid changes.
Fundamental changes in species composition may occur (Rich et al., 2008), due to more competitive (also invasive) tree species that repopulate the overstory (Kotroczó et al., 2007).
Abiotic impacts include changes in solar energy fluxes with feedbacks to regional climate (Chapin et al., 2008; Gálos et al., 2007; Drüszler et al., 2009), and alterations in hydrology and ecosystem water budgets due to increases in evaporation and reductions in transpiration (Huxman et al., 2005) and changes in groundwater recharge (Móricz, 2010).
Forests store considerably more carbon than the atmosphere, and forest die-off could further redistribute carbon pools locally, regionally or even globally (Jones et al., 2009).
Drought induced mass mortality have recently transformed forests of British Columbia (Canada) from a net carbon sink into a net carbon source (Kurz et al., 2008)!
A litter manipulation experiment in a warming and drying oak forest in the Síkfőkút Project also stated that the increasing soil temperature raised the soil respiration exponentially, which could speed up global warming by positive feed back mechanism (Tóth et al., 2007).
2.3 Ecology of beech
2.3.1 The current distribution range of European beech
Fagus sylvatica is a late-successional forest tree with a life span of about 300 years, and a very late reproduction age (40–50 years old). The seed production is characterized by irregular mast years (Ellenberg, 1996).
Beech today extends from the tree-line forests of the Cantabrian Mountains in the west to the Carpathians and Balkan Mountains in the east and latitudinally from Sicily in the south to southern Sweden and Norway in the north (Figure 9). Beech is widely distributed in Central and Western European forests, however, there are areas where beech is absent as a native tree, such as the Po valley and the Hungarian plain (Pott, 2000). Beech does not spread far into the more continental east of Europe. The most continental occurrence of beech can be found in Ukraine (Bukovina) (Figure 10).
23
Figure 10: Present day distribution of Fagus sylvatica (Bohn, 1992).
Beech needs at least 140 days during the growing period, and for this reason it cannot survive too far north in Scandinavia (Peters, 1997). However beech can occupy a wide range of habitats with different soil types (Majer, 1968; Ellenberg, 1996), due to its intolerance against summer drought it cannot survive in southern Spain, southern Greece and in the most arid areas of southern and central Italy and the Hungarian plain. This suggests intolerance against aspects of the continental climate like low temperatures in winter as well as higher temperatures in summer (Iversen, 1973; Huntley et al., 1989).
After the last glacial beech spread to central and northern Europe from southern France, eastern Alps–Slovenia–Istria and possibly southern Moravia–southern Bohemia. Populations survived the last glacial period in the Mediterranean regions (Italian and Iberian peninsulas) did not spread into Central-Europe (Magri et al., 2006; Tinner and Lotter, 2006). Beech populated the Carpathian basin 5-6000 years ago (Comps et al., 1998).
In the Atlantic part of Europe (in the northwestern part of its range) beech is a typical lowland species, but in Central and Southern Europe it is connected to the middle or high mountains. In the southern part of its range it is stretching up to 2100 m above sea level (Figure 11). This suggests that the presence of beech is determined by specific climatic condition.
24
Figure 11: The altitudinal distribution histogram of beech based on the systematic grid sampling with a grid size of 5x5 km under the distribution map of EUFORGEEN. Elevation was
derived from the digital elevation model of Europe (GTOPO).
2.3.2 Ecological and climatic constraints of the distribution of beech
European beech is a strong competitor with high shadow tolerance as seedling and sapling.
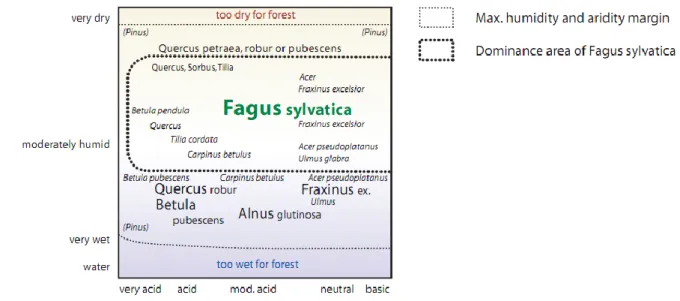
Beech is therefore able to get to dominance on sites with a relatively broad spectrum of nutrient and hydrological regimes, from highly acidic to basic soils (Leuschner et al., 2006) and from dry to moist conditions. In the southern part of its range, and at low elevations, the competitiveness of beech is limited by increasing water stress, until finally it is replaced by forests consist of more drought-tolerant species (Peters, 1997), mainly Quercus and Pinus (Horvat et al., 1974; Ellenberg, 1996) (Figure 12-13).
Figure 12: Natural humidity and acidity niche of beech under temperate sub-oceanic climate (Ellenberg, 1996).
25
Figure 13: Dominance and competition between different species of beech in Central- West European forests at present. (Ellenberg, 1996).
Minimum temperature
Beech is not found in places where the mean temperature of the coldest month is less than -3°C (Huntley et al., 1989). This is due to its intolerance against late frosts (Sykes et al., 1996).
Beech can be characterised with a distinctive response to the length of the chilling period (Crawford, 2000). This suggests that the budburst of beech definitely needs a not too cold and not too long chilling period (Crawford, 2000).
Drought
The water use of beech
Fagus sylvatica can get dominance on sites with a relatively broad spectrum of hydrological conditions, because beech can maintain the transpiration close to the cavitation induction point (Bréda et al., 2006). This makes beech very sensitive to drought-induced xylem embolism (Backes and Leuschner, 2000; Cochard et al., 2001).
The water use of beech is regulated conservatively (Backes and Leuschner, 2000). In case of a moderate water shortage, the stomatal regulation system prevents dramatic reductions in turgor, leaf water potential, and photosynthesis, but during severe droughts this system cannot adequately prevent the loss of hydraulic conductivity (Geßler et al., 2001). Thus decrease in predawn leaf water potential (Backes and Leuschner, 2000), canopy conductance (Granier et al., 2000; Schipka et al., 2005), photosynthetic capacity (Bergh et al., 2003), stem diameter growth (Lebourgeois et al., 2005), height growth (Frech, 2006), and net primary production (NPP) (Ciais et al., 2005) is expected. Short term dry and hot conditions during summer can also lead to a direct reduction of canopy leaf area index (LAI) or to dieback of the canopy (Berki et al., 2009; Bréda et al., 2006).
Effects of elongated water shortage (drought stress)
Drought stress happens, when the available water for plants drops below a limit inducing restrictions to growth and transpiration. This elongated water shortage leads to dysfunctions
26
but rarely results in direct and immediate tree die-off. Water shortage causes decrease in leaf area index not only seasonally but also on an inter-annual period and hence assist to decline of gross primary productivity in beech forests (Bréda et al., 2006).
Tree ring width and leaf area is often smaller during several years following drought event.
Moreover, physiological disorders increase tree vulnerability to stresses like insect damages, which leads eventually to mortality. If trees have been predisposed to stress because of poor growing conditions, site disturbance or damage, they may die this year or next year without showing visible warning signals.
Lower growth rate and poor crown condition are frequently reported before death, but it is not responsible for that. The probable explanation is that growth is an indicator of tree carbon balance dysfunction and mortality is very likely caused by reserve depletion (Bréda et al., 2006).
Very little is known about the response of the root system of mature beech trees to water shortage, which might respond more sensitively to drought than aboveground organs.
Effects of extreme heat and drought
Extreme heat and drought could have a direct effect on transpiration causing xylem embolism. Direct heat damage to trees was observed in 2003, since trees with closed stomata were unable to cool via transpiration (Bréda et al., 2006).
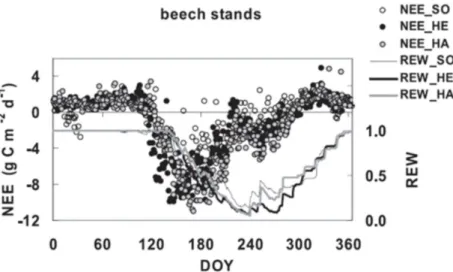
The net ecosystem exchange (NEE) measured above beech stands showed reduced CO2
uptake and transpiration during the severe drought period in 2003, mainly due to stomatal closure. Carbon uptake reached a maximum between days of year (DOY) 150 and 170 (depending on site), and thereafter rapidly decreased. At peak drought intensity (around DOY 220-240), NEE turned to positive, i.e. carbon was released by the ecosystems to the atmosphere (Figure 14) (Bréda et al., 2006).
Fine-root length is also influenced by weather extremes, i.e. rainfall is one of the major environmental factors controlling fine-root dynamics of beech. The fine root biomass was much less in a dry beech stand as compared to stands with higher rainfall due to the large mortality of fine roots during extreme drought (Eissenstat et al., 2000).
Beech regeneration exhibits reduced growth and nitrogen uptake from the soil when subjected to severe drought (soil water potential < -0.4 MPa) throughout several weeks (Fotelli et al., 2004).
27
Figure 14: Time course of net ecosystem exchange (NEE, daily data) and relative extractable soil water (REW) in beech stands in Germany (Bréda et al., 2006).
2.3.3 Beech provenace trials
In common garden experiments, the transfer to the planting “test” site is interpreted as simulation of sudden (within one generation) environmental change. Quantitative, adaptive responses (growth, phenology, health and survival) measured in comparative tests could be utilized to forecast the effects of climatic change.
Initially, a series of beech field trials was established in the early 1980s, but because of the political situation at that time, the sample of provenances neither included stands representing the whole species range nor did the trial locations represent all the habitats inhabited by beech. Therefore, following political changes in Europe another series of 49 trials were designed. In 1995 a series of 23 trials, and in 1998 26 trials were established. In Hungary, one test of the international series of 1998 has been outplanted in Bucsuta, Zala hills, Southwest Hungary.
The consequence of climatic selection, differentiation in phenological behaviour is well reflected by field test results. For example, budbreak of beech shows a clinal East-West pattern: Atlantic coast provenances are late, while Alpine and SE-European continental sources are early flushing (Wühlisch et al., 1995; Gömöry, 2009).
Beech provenance trials could provide valuable information on growth, phenology, health and survival for simulation of climate change, but data available at this time from the provenance trials are for the juvenile state!
2.4 Beech in Hungary
Beech is one of the main stand-forming tree species in Hungary. Out of the 20.3 % of land covered by forests, beech currently occupies 107.940 ha, which amounts to 5.9 % of the forest area. Beech is widely spread on zonal sites, where summer precipitation is significant and the humidity is high. The distribution of beech is suspected to be wider in the past centuries, especially in the Western half of Transdanubia. While beech forests were often replaced by agricultural land use at low elevations, in less accessible areas beech forests remained in close to natural state.
28
While the altitudinal occurrence is stretching from the lowlands up to 1.000 metres above sea level, the vast majority of the beech stands in Hungary can be found between 200 and 500 m (Figure 15). The lowest elevation is an extrazonal site in the upper valley of the Drava river, due to favourable microclimatic conditions (Southwest Hungary, altitude ca. 120 m asl.).
Figure 15: The altitudinal distribution of beech in Hungary.
Due to its climate sensitivity, beech is used in forestry practice as an indicator species for the beech forest belt, providing the most favourable growing conditions in the country. The climatic envelope of beech can be well characterized using summer mean temperature and precipitation of the growing season (Figure 16).
29
Figure 16: The 2 dimensional (precipitation of the growing season/mean summer temperature) climate envelope of beech subcompartments in Hungary.
2.4.1 Beech associations in Hungary
Typical mountain beech forests (Aconito-Fagetum) are found only at higher elevations of the North-Hungarian Middle Mountains. Their presence is restricted to the Bükk and Zemplén Mountains, and to smaller occurrences in the Mátra and Börzsöny Mountains. These are highly productive forests mainly growing on lessivated brown forest soils. Beside beech, common ash (Fraxinus excelsior), sycamore (Acer pseudoplatanus), European rowan (Sorbus aucuparia) and mountain elm (Ulmus glabra) are admixed species (Borhidi, 2003).
Only isolated, small fragments represent the mixed fir-beech forests (Abieti-Fagetum) in the Sopron and Kőszeg Mountains (Borhidi, 2003).
The largest occurrences are submontane beech forests (Melitti-Fagetum) occupying the lower elevations of the Hungarian Middle Mountains crossing the country from NE to SW (first of all in the Zemplén, Bükk Börzsöny, Bakony and Kőszeg Mts.). Westward, in Southwest Transdanubia beech occupies more frequently collinal sites under 400 m a. s. l.
The latter region receives more precipitation and is under moderate sub-Mediterranean influence, therefore floristically distinguished as Illirian beech forests (Vicia oroboidis- Fagetum). Submontane beech forests are mixed with hornbeam (Carpinus betulus) and sessile oak (Quercus petraea) indicating higher temperatures and less favourable humidity conditions (Borhidi, 2003).
Regarding specific site conditions, beech is a dominant tree species on humid-acidophilous sites (Deschampsio flexuosae-Fagetum). It is also present as admixed species beside common ash (Fraxinus excelsior) and large-leaved linden (Tilia platyphyllos) on the comparatively dry sites of calcareous ravine slopes of the Transdanubian Middle Mts.
(Mercuriali-Tilietum). A relict-type occurrence with yew (Taxus baccata) in the Bakony Mts.
has been described as Taxo-Fagetum (Majer, 1980).
30 2.4.2 Beech decline in Hungary
A considerable part of beech stands are situated close to the xeric limit, i.e. at the drought- related (trailing, or retreating) end of their warm-temperate distribution range in Southwest- Hungary (Mátyás et al., 2009).
Background
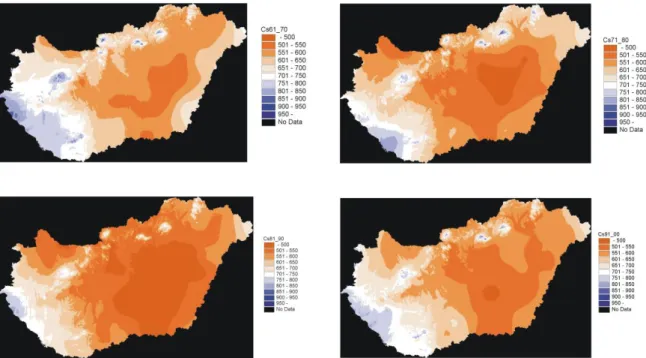
During the last century there have been unfavourable changes in the climate conditions for the beech forests in Southwest Hungary. The summer mean temperature has increased while the annual rainfall showed a decreasing trend. This has lead to a significant aridification, which could be also expressed by the shift of the isolines of the Ellenberg quotient (EQ) computed at the beginning and at the end of the last century (Figure 17). Jahn (1991) and Czúcz et al., (2011) proposed the EQ=29 value as threshold for the lower distribution limit for beech.
Figure 17: The distribution limit EQ=29 for the period 1901-1930 (green) and for 1975- 2004 (red).
Besides the long term trends, the fluctuation of precipitation on a finer temporal scale could be also observed especially in Southwest Hungary by comparing the decadal rainfall sums (Figure 18).
31
Figure 18: The decadal rainfall sums in Hungary.
A long drought period has occurred already during the 90’s, which has hit mostly beech forests, standing at the trailing edge (Leskó, 1995). The next mass mortality of beech occurred in the early 2000’s in Southwest Hungary. Due to the prolonged drought, the soil water storage has been almost completely depleted and the air humidity was often under the climatic mean.
Symptoms, secondary pest and diseases during the 2000-2003 droughts
The mass mortality of beech in the early 2000’s was the result of a typical damage chain (Lakatos and Molnár, 2009). Drought has weakened the trees and favoured the development of different pests and pathogens. The weakened trees were ideal places for mass reproduction of different pests and heavy infestation of pathogens (Csóka et al., 2007;
Lakatos and Molnár, 2009). Similar symptoms were only recorded in the 1880s (Piso, 1886).
32
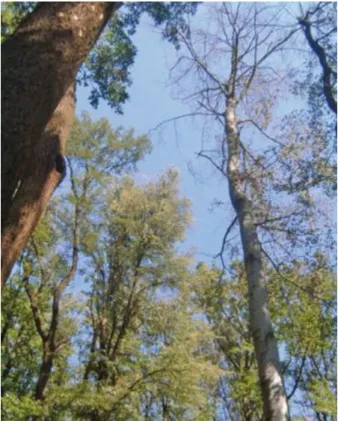
Figure 19: Mortality caused by drought in late summer 2003 in a beech stand in Balatonszárszó (admixed oaks showed no damage!).
The direct causes of mortality were insects, the green jewel beetle (Agrilus viridis), the beech bark beetle (Taphrorychus bicolor) and the fungus species of Biscogniauxia nummularia.
Agrilus viridis was the main pest species, while T. bicolor attacked only the weakened trees.
Both insects damage the phloem and cambium thus sap flow occurred on the infested trees (Lakatos and Molnár, 2009). The physiological disorder has led often to direct dieback of trees, which can last for years. Other xylo- and phloeophagous species had no importance in the damage chain, since their presence can be explained by the large amount of dry trees to be optimal for their development (Lakatos and Molnár, 2009).
The affected area
Symptoms were first observed in Balaton highlands and Bakony Mountains, but the most severe damage occurred in the Southwest part of Hungary.
The most damaged beech stands were situated mainly in mixed forests with significant ratio of hornbeam and sessile oak. The following forest were affected by the mass mortality in Zala county: Csács, Kapornak, Kalamászos, Almás, Ligetfalva, Csáford (Zalaegerszeg Forest Office), Kondora, Irsa and Csöde (Lenti Forest Office).
33
Figure 20: The affected (red) and healthy (green) beech subcompartments in Southwest Hungary.
Sporadic beech dieback was observed in Vétyem, Istvánd, Barkócás (Letenye Forest Office), Szentpéterfölde (Csömödér Forest Office), Templom forest, Alsóváros forest (Nagykanizsa Forest Office).
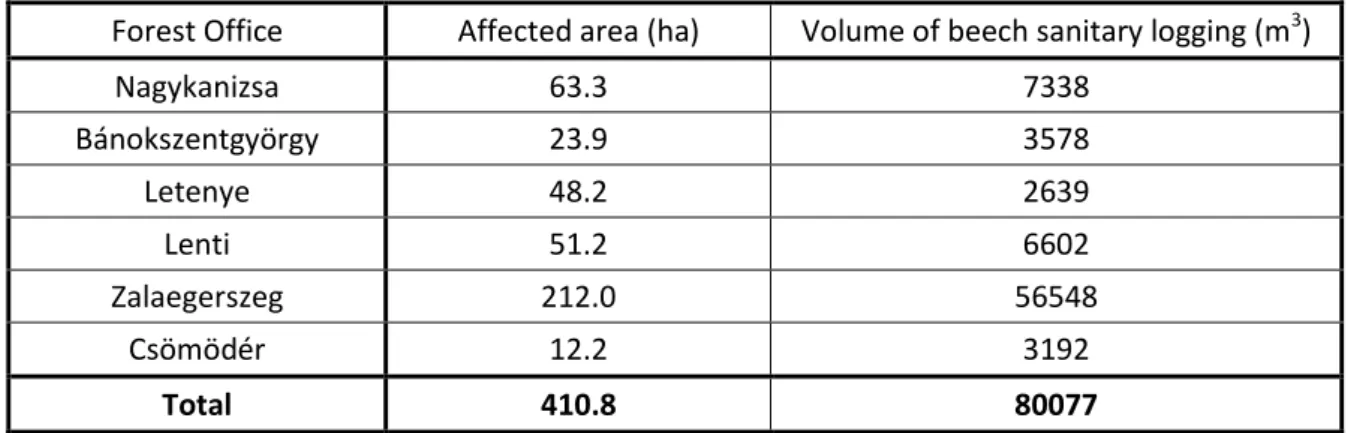
The affected area and the amount of sanitary felling per forest offices in 2004 can be found in Table 2.
Table 2: The affected area and the amount of sanitary felling per forest offices of the Zalaerdő Zrt. in 2004 (Góber, 2005).
Forest Office Affected area (ha) Volume of beech sanitary logging (m3)
Nagykanizsa 63.3 7338
Bánokszentgyörgy 23.9 3578
Letenye 48.2 2639
Lenti 51.2 6602
Zalaegerszeg 212.0 56548
Csömödér 12.2 3192
Total 410.8 80077