Modeling the future distribution of Mediterranean Pinus species
BEDE-FAZEKAS Ákosa*
aDepartment of Garden and Open Space Design, Corvinus University of Budapest, Budapest, Hungary Abstract – The potential future distribution of four Mediterranean pines was aimed to be modeled supported by EUFORGEN digital area database (distribution maps), ESRI ArcGIS 10 software’s Spatial Analyst module (modeling environment), PAST (calibration of the model with statistical method), and REMO regional climate model (climatic data). The studied species were Pinus brutia, Pinus halepensis, Pinus pinaster, and Pinus pinea.
The climate data were available in a 25 km resolution grid for the reference period (1961-90) and two future periods (2011-40, 2041-70). The climate model was based on the IPCC SRES A1B scenario. The model results show explicit shift of the distributions to the north in case of three of the four studied species. The future (2041-70) climate of Western Hungary seems to be suitable for Pinus pinaster.
Keywords: Mediterranean pines / climate envelope model / potential distribution / climate change / distribution modeling
1. INTRODUCTION
According to the predictions for the period of 2011-40, spatially analogue territories of Hungary – the territories with present climate similar to the future climate of Hungary – can be found in Southern Romania, Northern Bulgaria, Serbia, Macedonia and Northern Greece (HORVÁTH 2008). Therefore the ornamental plant assortment of Hungary – as the assortment of other Central and Eastern European countries – should be reconsidered. This realization inspired some previous studies (BEDE-FAZEKAS 2012a, BEDE-FAZEKAS 2012b).
The regional climate models have, by this time, good horizontal resolution and are reliable enough for creating some models based on the current distribution of tree species. Our previous researches were about modeling the future area of introduction (or potential distribution) of several Mediterranean ligneous plant species that can have importance in the future ornamental plant usage. Based on these former studies we aimed to run a new and more accurate model on four of the previously studied species. The improvement of the modeling method was achieved by statistical calibration based on an iterative error evaluation.
We aimed to create multi-layered distribution maps with GIS (Geographic Information System) software, displaying the predicted shift of the distributions. These maps can have importance not only in forestry, landscape architecture and botany, but in visualization of the climate change also for non-professionals (CZINKÓCZKY –BEDE-FAZEKAS 2012).
*Corresponding author: bfakos@gmail.com, H-1118 Budapest, Villányi út 27-43.
2. MATERIALS AND METHODS
2.1. Climate data and distribution maps
The studied species are Brutia pine (Pinus brutia Ten.), Aleppo pine (Pinus halepensis Mill.), Maritime pine (Pinus pinaster Aiton), and Italian stone pine (Pinus pinea L.), which are very close relatives according to phylogenetic studies (WANG et al. 1999). The current (latest update was achieved in 2008) continuous distribution map of the species was derived from the EUFORGEN digital area database (EUFORGEN 2008), while the discrete (fragmented) observations were ignored. In our model the distributions from 2008 were bound to the reference period. This difference may not cause any problem since the pines have long life cycle and can slowly adapt to the changing climate.
The climatic data were gained from the REMO regional climate model (RCM); the grid had a 25 km horizontal resolution. The model REMO is based on the ECHAM5 global climate model and use the IPCC SRES scenario called A1B. This scenario supposes a future world of very rapid economic growth, global population that peaks in the mid-century, and the rapid introduction of new and more efficient technologies (NAKICENOVIC –SWART 2000). The reference period was 1961-90, the two future periods of modeling were 2011-40 and 2041-70. The entire European Continent is within the domain of REMO, we used, however, only a part of the grid (25724 of the 32300 points).
36 climatic variables were used for the distribution modeling: monthly mean temperature (T,
°C), monthly minimum temperature (M, °C), and monthly precipitation (P, mm). All the climatic data were averaged in the three periods. Indirectly, accumulated heat, seasonality, and some other climate parameters were applied.
2.2. Climate envelope modeling
2.2.1. Modeling approach and software
ESRI ArcGIS 10 software was used for preparing climatic data, running the model, and displaying the model results. Climatic data were managed and the expressions for modeling were prepared with the assistance of Microsoft Excel 2010 program. PAST statistic analyzer software (HAMMER et al. 2001) was used for creating the cumulative distribution function of the climatic parameters, and getting the percentile values of the parameters (model calibration).
The impact of climate change on the distribution of selected species was modeled with Climate Envelope Modeling (CEM; also known as niche-based modeling, correlative modeling) (HIJMANS – GRAHAM 2006). This method is about predicting responses of species to climate change by drawing an envelope around the domain of climatic variables where the certain species is recently found and then identifying areas predicted to fall within that domain under future scenarios (IBÁÑEZ et al. 2006). It hypothesizes that (both present and future) distributions are dependent mostly on the climatic variables (CZÚCZ 2010) which is somewhat dubious (SKOV – SVENNING 2004). Compared to mechanistic models, CEM tries to find statistical correlations between climate and the distribution of species (GUISAN – ZIMMERMANN 2000, ELITH – LEATHWICK 2009), and models the future temporal correspondence based on the present spatial correspondence between the variables (PICKETT 1989).
2.2.2. Calibration by iterative modeling
The calibration of the model has been achieved by iterative error evaluation. This technique shows several similarities with “area under the receiver operating characteristic (ROC) curve”
(AUC), which is a plot of a test's true positive fractions vs. false positive fractions (HANLEY – MCNEIL 1982). The comments of LOBO et al. (2008) on AUC may also refer to the calibration
method used in this research. For further error-based model calibration procedures see FIELDING – BELL (1997).
The model was run iteratively to determine the optimal amount of percentiles to be left from the climatic values. Cumulative distribution functions were calculated by PAST for all climatic parameters. Then 0 to 14 percentiles has been left from the lower values of a certain type of climate parameters (e.g. 12 monthly precipitations), while the maximum values were fixed and also the other 24 climatic parameters were fixed at the extreme values. In case of a certain species 90 error evaluations were done. Two types of error values were calculated: internal (the ratio of the current distribution segment not determined by the model), and external (the ratio of area outside the current distribution, determined wrongly by the model). The errors were summarized. The increasing accumulated error function determined the appropriate number of percentiles to left:
the greatest number of percentiles was chosen which produces no more than 100% summarized error.
2.2.3. Modeling method
First, climatic data were refined by Inverse Distance Weighted interpolation method. Then the modeling steps were as follows:
1. the grid points within the distribution were queried (a few hundred × 36 data; ArcGIS);
2. the percentile points of the 36 climatic parameters (101×36 data, PAST) were calculated;
3. the appropriate percentiles of the climatic parameters determined by the calibration were selected (2×36 data, Excel);
4. modeling phrases (3 strings, Excel) were created by string functions for the three modeling periods;
5. those territories were selected where all the climatic values of the certain period were between the extremes selected in step 3. (ArcGIS – Raster Calculator function).
The positive raster results were transformed to ESRI shapefile format (polygons). The order of the four layers (one observed and three modeled distributions) determined that the result maps are able to display the northward expansion, not the retreat from the southern parts (trailing edge) of the current distribution.
3. RESULTS
3.1. Result of iterative modeling
Based on the iterative modeling the optimal number of percentiles to be left was determined in case of the four species, and two extremes of the three type of climate variables (Table 1).
Table 1. The result of model calibration: the number of percentiles to be left
Species min(T) max(T) min(M) max(M) min(P) max(P)
P. brutia 3 2 3 3 5 3
P. halepensis 9 2 9 3 3 2
P. pinaster 6 3 6 3 2 4
P. pinea 6 1 5 2 2 1
3.2. Modeled potential distributions 3.2.1. Brutia pine (Pinus brutia)
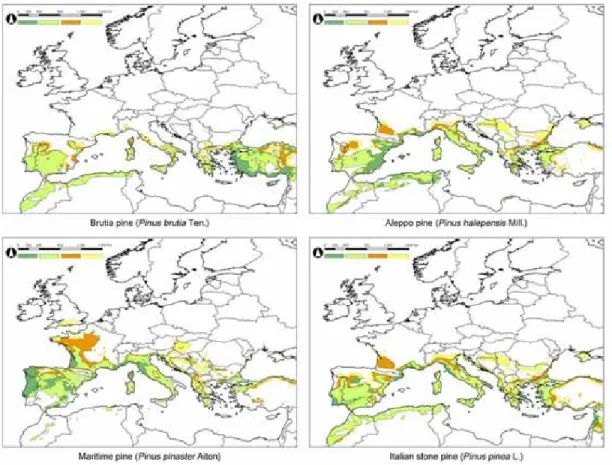
The current distribution of Pinus brutia (Figure 1) is focused on the Eastern Mediterranean region (Turkey, Cyprus, and Malta), while the model results in a much larger potential distribution for the
reference period that includes Southern Portugal, Southern Spain, Northern Morocco, Northern Algeria, Sardinia, Southern Italy, and Greece. Significant northern expansion is not predicted, and Hungary is not affected by the model.
3.2.2. Aleppo pine (Pinus halepensis)
Segments of the observed distribution of Pinus halepensis (Figure 1) can be found in Eastern Spain, Southern France, Italy, Southern Greece, and Northern Morocco, Algeria, Tunisia and Libya. The model cannot redraw the Libyan distribution fragment. The potential distribution for the reference period seems to be larger than the observed area: Southern Portugal and Spain, Italy, Corsica and Sardinia, the coast of the Aegean Sea, and greater North African territories are modeled to be suitable. In Spain, France, Italy, Croatia, Bosnia and Herzegovina, Serbia, Bulgaria, and in the Crimea future expansion is predicted.
Figure 1. Current distribution (dark green), modeled potential distribution in the reference period (light green), and modeled potential distribution in the period of 2011-2040 (orange) and 2041-2070 (yellow) of the four
studied Pinus species 3.2.3. Maritime pine (Pinus pinaster)
The current distribution of Pinus pinaster (Figure 1) is focused on the Western Mediterranean (Portugal, Spain, Southern France, Corsica, and Northern Italy), which is well expressed by the model. The African distribution segments are, however, not redrawn by the model. Significant northern expansion is predicted to occur in Western France, Southern England, the Balkans, and the western part of the Carpathian Basin.
3.2.4. Italian stone pine (Pinus pinea)
Apart from Central Spain, Pinus pinea (Figure 1) is clearly a coastal pine: its current distribution includes maritime parts of Portugal, Spain, France, Italy, Turkey, Syria and Lebanon. The potential distribution for the reference period is modeled to include North African coastal territories, Southern Portugal and Spain, Italy, and the coastline of the Eastern Mediterranean. Northern future expansion can be seen in France, Italy, and the Balkans.
4. DISCUSSION 4.1. Model evaluation
Although the aforementioned predictions are obviously valuable and spectacular, there are some questions and disadvantages concerning the model used. Opinions differ if climatic variables are by themselves sufficient or even the most important factors for explaining the distribution of species (DORMANN 2007). It should also be noted that extremes and absolute climatic values (rather than averages) may better explain the limits of distribution (KOVÁCS-LÁNG et al. 2008). The input climate data were obtained from RCM, which differ from the observed meteorological data.
No bias correction was applied on the modeled climate data. Nonetheless, the model calibration technique we used seems to result in a realistic and supportable model, since the differences between the potential and observed distributions are not unacceptably large.
Various other ways can be found to determine the climate envelope, including simple regression, distance-based methods, genetic algorithms for rule-set prediction, and neural nets (IBÁÑEZ et al. 2006). Our subsequent aim is to develop a program module for ArcGIS that implements the artificial intelligence algorithm artificial neural network (ANN) for modeling the future distribution of Mediterranean tree species.
4.2. Shift of distributions
Our former research found that the extent of future shift of distributions is much larger. That model was, however, inaccurate. The results of this improved model show that the most affected territories are France and the Balkans. The greatest expansion is predicted to occur in case of Pinus pinaster, while the distribution of Pinus brutia seems to be nearly unchanged. Although the current distribution of Pinus halepensis and Pinus pinea differs remarkably, the predictions are almost the same, which is caused by the similar climatic demand and tolerance of the two species.
The North-eastern African coastline was predicted to be suitable for Pinus brutia, Pinus halepensis, and Pinus pinea. By 2070, the climate of Western Hungary seems to become suitable for Pinus pinaster. The model results show clearly and spectacularly the impacts of the predicted climate change on the distribution of Mediterranean pines.
Acknowledgements: Special thanks to Levente Horváth and Levente Hufnagel (Corvinus University of Budapest, Department of Mathematics and Informatics) for their assistance. The research was supported by Project TÁMOP-4.2.1/B-09/1/KMR-2010-0005. The ENSEMBLES data used in this work was funded by the EU FP6 Integrated Project ENSEMBLES (Contract number 505539) whose support is gratefully acknowledged.
References
BEDE-FAZEKAS, Á. (2012a): Melegigényes díszfák telepíthetőségi területének előrejelzése a 21. századra.
[Predicting the area of introduction of warm-demand ornamental trees for the 21st century.] Thesis, Corvinus University of Budapest, Faculty of Landscape Architecture, Budapest, Hungary (in Hungarian)
BEDE-FAZEKAS,Á. (2012b): Methods of modeling the future shift of the so called Moesz-line. Applied Ecology and Environmental Research 10(2): 141-156.
CZINKÓCZKY,A.–BEDE-FAZEKAS,Á(2012): Visualization of the climate change with the shift of the so called Moesz-line. In: BUHMANN,E.–ERVIN,S.–PIETSCH,M. (eds.): Peer Reviewed Proceedings of Digital Landscape Architecture 2012 at Anhalt University of Applied Sciences. Herbert Wichmann Verlag, Berlin, Germany. 437-444
CZÚCZ,B. (2010): Az éghajlatváltozás hazai természetközeli élőhelyekre gyakorolt hatásainak modellezése.
[Modeling the impact of climate change on natural habitats in Hungary.] Dissertation. Corvinus University of Budapest, Faculty of Horticultural Sciences, Hungary (in Hungarian)
DORMANN,C.F. (2007): Promising the future? Global change projections of species distributions. Basic and Applied Ecology. 8: 387–397.
ELITH,J.–LEATHWICK,J.R.(2009): Species Distribution Models: Ecological Explanation and Prediction Across Space and Time. Annual Review of Ecology, Evolution, and Systematics. 40(1): 677-697.
EUFORGEN (2008): Distribution maps. Bioversity International, Rome, Italy. Online:
www.euforgen.org/distribution_maps.html
FIELDING, A. H. – BELL, J. F. (1997): A review of methods for the assessment of prediction errors in conservation presence/absence models. Environmental Conservation. 24(1): 38–49.
GUISAN,A. – ZIMMERMANN, N. E. (2000): Predictive habitat distribution models in ecology. Ecological Modelling. 135(2-3): 147-186.
HAMMER,Ř.–HARPER,D.A.T.–RYAN,P.D. (2001): PAST: Paleontological statistics software package for education and data analysis. Palaeontologia Electronica. 4(1): 9
HANLEY,J.A.–MCNEIL,B.J.(1982): The meaning and use of area under a receiver operating characteristics (ROC) curve. Radiology. 143(1): 29–36.
HIJMANS,R.J.–GRAHAM,C.H.(2006): The ability of climate envelope models to predict the effect of climate change on species distributions. Global Change Biology. 12: 2272-2281.
HORVÁTH,L. (2008): Földrajzi analógia alkalmazása klímaszcenáriók elemzésében és értékelésében. [Use of spatial analogy in analysis and valuation of climate scenarios.] PhD dissertation, Corvinus University of Budapest, Budapest, Hungary. (in Hungarian)
IBÁÑEZ,I.–CLARK,J.S.–DIETZE,M.C.–FEELEY,K.–HERSH,M.–LADEAU,S.–MCBRIDE,A.–WELCH,N.E.– WOLOSIN,M. S. (2006): Predicting Biodiversity Change: Outside the Climate Envelope, beyond the Species-Area Curve. Ecology. 87(8): 1896-1906.
KOVÁCS-LÁNG,E.–KRÖEL-DULAY,GY.–CZÚCZ,B. (2008): Az éghajlatváltozás hatásai a természetes élővilágra és teendőink a megőrzés és kutatás területén. [The impacts of climate change on the wildlife and our protecting und researching tasks.] Természetvédelmi Közlemények. 14: 5-39. (in Hungarian)
LOBO,J.M.–JIMENEZ-VALVERDE,A.–REAL, R. (2008): AUC: a misleading measure of the performance of predictive distribution models. Global Ecol Biogeogr. 17(2): 145-151.
NAKICENOVIC,N.–SWART,R.(eds.) (2000): Emissions Scenarios. Cambridge University Press, Cambridge, UK.
PICKETT,S.T.A. (1989): Space-for-time substitution as an alternative to long-term studies. In LIKENS,G.E.
(ed.): Long-Term Studies in Ecology: Approaches and Alternatives. Springer, New York, USA. 110-135.
SKOV,F.–SVENNING,J.C.(2004): Potential impact of climatic change on the distribution of forest herbs in Europe. Ecography. 27(3): 366-380.
WANG,X.-R.–TSUMURA,Y.–YOSHIMARU,H.–NAGASAKA,K.,–SZMIDT,A.E. (1999): Phylogenetic relationships of Eurasian pines (Pinus, Pinaceae) based on chloroplast rbcL, matK, rpl20-rps18 spacer, and trnV intron sequences. Amer. J. Bot. 86:1742-1753.