crystals
Article
Fluorescent Labeling of Hyaluronic Acid-Chitosan Nanocarriers by Protein-Stabilized Gold Nanoclusters
Árpád Turcsányi1, Ditta Ungor1 and Edit Csapó1,2,*
1 Department of Physical Chemistry and Materials Science, University of Szeged, Rerrich Béla Square 1, H-6720 Szeged, Hungary; tarpad@chem.u-szeged.hu (Á.T.); ungord@chem.u-szeged.hu (D.U.)
2 MTA-SZTE Biomimetic Systems Research Group, Department of Medical Chemistry, Faculty of Medicine, University of Szeged, Dóm Square 8, H-6720 Szeged, Hungary
* Correspondence: juhaszne.csapo.edit@med.u-szeged.hu
Received: 6 November 2020; Accepted: 4 December 2020; Published: 6 December 2020 Abstract:In medical research the visualization of drug carrier accumulation and release of the loaded drugs in vivo is an important field. In this work, two protein-stabilized gold nanoclusters (Au NCs) as effective fluorescent reporters (FRs) were investigated for labeling of biocompatible chitosan-modified hyaluronic acid based nanocarriers having two different structures. The colloid stability of the labeled carriers was studied by dynamic light scattering and Zeta potential measurements, while the changes in the fluorescence of the lysozyme- (LYZ) and bovine serum albumin (BSA)-stabilized Au NCs were analyzed by spectrofluorimetry and confocal fluorescent microscopy. We found that the labeling was effective with a wide range of marker:carrier mass ratios, and the fluorescence of the NCs and the colloid stability of the complexes were retained. Labeling during preparation and subsequent labeling were compared, and based on composition (nanocluster:carrier mass ratio) and structure of the complex systems we preferred the latter method, as it left the Au NCs free for further modifications.
Considering both marker:carrier mass ratios and emission intensities, the LYZ-stabilized Au NCs proved to be better labels. The core-shell type carrier formulations showed increased fluorescence with LYZ-stabilized NCs, presumably from aggregation induced emission.
Keywords: gold nanoclusters; fluorescence; colloidal drug carriers; fluorescence labeling; hyaluronic acid; chitosan; aggregation-induced emission
1. Introduction
The polymer-based nanostructured drug carrier systems play an increasing role in the fields of biomedicine, nanomedicine, and pharmacy [1]. By using them, we can prolong and increase the efficacy of the drugs; furthermore, it is possible to introduce therapeutic compounds which are significantly hampered by the specific properties of the given active ingredient. (e.g., hydrophilicity, charge, degradation) [2,3]. The biocompatibility and biodegradability are crucial properties because they ensure that the carriers do not cause inflammation or accumulate in the organs and tissues after releasing the drug load. Polysaccharides such as chitosan (Chit) and hyaluronan (HyA) are promising materials in this field due to their advantageous characteristics [1,4,5]. Accordingly, they are used in several forms (hydrogels, films, and nanoparticles (NPs)) and applications [2,6–8]. The precise combination of these oppositely charged polysaccharides can produce finely tuned NPs, which can be used for gene delivery, or for loading different drugs and cancer therapeutics [9,10].
In medical applications, the noninvasive detection and monitoring of colloidal carrier accumulation in tissues is an important aspect, especially in cancer therapy. The selective release of drugs can be observed in vivo, without removing tissues in harmful operations and sacrificing the test animal in the appropriate phases of clinical tests [11–14]. There is an increasing number of publications in the
Crystals2020,10, 1113; doi:10.3390/cryst10121113 www.mdpi.com/journal/crystals
Crystals2020,10, 1113 2 of 15
literature reporting the possible use of organic dye molecules (e.g., cyanine derivatives) as potential fluorescent reporters (FRs) for drug delivery monitoring. These materials must meet a number of requirements, such as suitable brightness and solubility, good photo- and chemical stability, low toxicity as well as the absorption and emission are suggested to be in the red and near infrared (NIR) region (~600–900 nm) where biological objects have a negligible autoabsorption and autofluorescence.
Highly fluorescent gold nanoclusters (Au NCs) are widely used sub-nanometer sized objects in chemical and medical fields due to their numerous special characteristics [15,16]. Depending on their size/structure, the type of stabilizing (bio)ligands as well as their fabrication methods, several Au NCs with a wide range of properties, like tunable fluorescence in visible light and NIR region can be prepared [17–20]. There is a growing interest in these materials in biological applications like in analytical methods [17,20–22] as well as in theranostics [11,14,16,17] and fluorescent labeling of cells and tissues [12,15,17,23,24]. In contrast to the previously mentioned organic dye molecules or the intensively studied quantum dots (QDs) these Au NCs possess less toxic feature and better photochemical stability as well. In biological applications it is imperative that the stabilizing ligands and the whole nanocluster are biocompatible to prevent harmful side effects during and after administration.
Generally, nucleic acids, amino acids, peptides, and proteins are applied as reducing and stabilizing ligands to synthesize fluorescent Au NCs via a one-pot “green” synthetic approach [18,19,22,25–29].
So far, the fluorescent Au NCs were mainly used for cell labeling [12,15,17,24], and as drug carriers in cancer therapy [11,14–16,30], but the labeling of conventional nanosized drug carrier formulations was very rare [14,18,23].
The main motivation of this work was to investigate the limitations of the applicability of protein-stabilized red-emitting Au NCs as effective FRs for labeling of polysaccharide-based colloidal drug delivery systems. Namely, bovine serum albumin- (BSA-Au NCs) and lysozyme-directed (LYZ-Au NCs) Au NCs as fluorescent markers and chitosan-modified hyaluronic acid based colloidal nanoparticles as drug carriers with tocopherol as a test drug were fabricated reproductively according to our previous works [10,29]. On one hand, the quantitative evaluation of the Au NC–polymer carrier interaction was accomplished and the formation, the size distribution and stability of the fluorescent metal cluster/polymer carrier complexes were also investigated at several cluster:carrier mass ratios.
The fluorescent labeling of colloidal carriers was carried out in two different ways. Based on these studies we tried to emphasize that the efficacy of the fluorescent labeling can be greatly controlled by the applied cluster:carrier mass ratio, the type of the protein-stabilized Au NCs as well as the type and the structure of polysaccharide-based colloidal drug carriers NPs.
2. Materials and Methods
2.1. Materials
The following materials were used for the preparation of fluorescent Au NCs: bovine serum albumin (BSA,≥90%, Sigma-Aldrich, Budapest, Hungary), lysozyme (LYZ,≥90%, Sigma-Aldrich), HAuCl4·3H2O (Sigma-Aldrich), and sodium hydroxide (≥99%, Molar Chemicals, Halásztelek, Hungary). In all cases, the stock solutions were freshly prepared using Milli-Q ultrapure water (18.2 MΩcm at 25◦C). High-molecular-weight chitosan (HMW Chit, 310–375 kDa,>75% deacetylated, Sigma-Aldrich, Budapest, Hungary) and hyaluronic acid sodium salt (HyA, 1.5–1.8×10⁶Da,≤1%
protein, Sigma-Aldrich, Budapest, Hungary) were used for the preparation of the nanoparticles, with Tripolyphosphate (TPP, for BOD determination, Merck KGaA, Darmstadt, Germany) as cross-linking agent. Acetic acid (AcOH,≥99.5%, Erd˝okémia Co, Tolmács, Hungary) and sodium hydroxide were used for controlling the pH during synthesis, and±-α-tocopherol (TCP,≥96%, Sigma-Aldrich, Budapest, Hungary) was used as a model drug. All solvents and reagents used for preparation were of analytical grade and no further purifications were carried out.
Crystals2020,10, 1113 3 of 15
2.2. Preparation and Characterization of Protein-Stabilized Au NCs
The preparation of protein-stabilized Au NCs was carried out based on the well-known template method [29,31]. Briefly, 500µL of 0.1 M HAuCl4solution was added into the adequate volume of aqueous solution of 0.4 g LYZ or 0.2 g BSA protein, separately. The final gold content was 1 mM and the applied weight ratios were 20:1 and 15:1 in the case of LYZ and BSA, respectively. The pH was adjusted to pH=12 with 1 M NaOH solution and the reaction mixture was kept at 37±0.1◦C for 24 h. During the synthesis, the intensive yellow color of the HAuCl4changed to light brown, which indicated the formation of the ultrasmall gold nanohybrid systems. Before the exact structural characterization and further applications, the dispersions were purified by dialysis for 24 h using general cellulose dialysis membrane with 12 kDa cut-off. The emission features of the prepared Au NCs were studied by spectrofluorimetry (λex=350 nm and slit=3 nm) using a Jobin Yvon Fluoromax-4 spectrofluorometer (Horiba, Retsch Technology GmbH, Haan, Germany) while the size of the NCs was measured by a FEI Tecnai G2 20 X-Twin high-resolution transmission electron microscope (HRTEM) (Auroscience Ltd, Budapest, Hungary) applying an accelerating voltage of 220 kV. The final metal content was determined by the ICP-MS technique applying dissolution of the nanodispersion by hotaqua regiawith 1 h contact time. The measurements were done using an Agilent 7700x inductively coupled plasma mass spectrometer (ICP-MS). The matrix-matched multipoint calibration was performed applying the IV-ICPMS-71C certified calibration standard (Inorganic Ventures), while the ICP-MS plasma and interface parameters were optimized via standard tuning solutions (G1820-60410, Agilent). The data was evaluated using Agilent Mass Hunter software. The oxidation state of the Au was determined by X-ray photoelectron spectroscopy (XPS) studies using a SPECS instrument, which was equipped with a PHOIBOS 150 MCD 9 hemispherical analyzer. The conformational changes in the proteins were analyzed by Fourier-transform infrared (FT-IR) and Circular dichroism (CD) before and after cluster synthesis. The spectra were recorded on a BIO-RAD Digilab Division FTS-65 A/896 infrared spectrometer equipped with a single-reflection diamond Attenuated Total Reflectance (ATR) accessory (Harrick’s Meridian®SplitPea) and an ABL&E-JASCO J-1100 CD spectrometer (ABL&E-JASCO, Budapest, Hungary) in a 1 cm quartz cuvette between 190 and 300 nm. To determine the kinetic stability of the Au NCs based on the values of their hydrodynamic diameter andζ-potential, a Malvern Nano ZS ZEN 4003 (PCT, Mosonmagyaróvár, Hungary) Zetasizer apparatus was employed with a He-Ne laser (λ=633 nm) at 25±0.1◦C.
2.3. Preparation of Polysaccharide-Based Colloidal Drug Carrier Particles
The preparation of the Chit-HyA drug carriers was reproduced from our previous work, with slight changes [10]. The TPP cross-linked Chit-HyA NPs (labeled as type II) were fabricated using the ionic gelation method. First, the stock solutions of HMW Chit (cChit = 2 mg/mL) and HyA (cHyA=0.615 mg/mL) were prepared by dissolving the polysaccharides in appropriate solvents (2 vol%
AcOH for Chit and MilliQ water for HyA). The Chit solution was then diluted to 0.727 mg/mL with buffering to pH=4.55–4.60 using 2 vol% AcOH and 1 M NaOH solutions, and the HyA stock solution was simply diluted to 15.4µg/mL. Then 8.125 mL of the HyA solution was mixed with 1.25 mL of 2 mg/mL TPP solution (Chit:TPP mass ratio was 2:1). To obtain NPs, the full amount of HyA-TPP mixture was added in one step to 6.875 mL of diluted Chit solution under strong magnetic stirring.
The final obtained Chit:HyA mass ratio was 40:1. For the Chit-TPPcore–HyAshellNPs (labeled as type III) the core NPs (Chit-TPPcore) were prepared in the first step. Here 1.25 mL of TPP solution (c=2 mg/mL) was added to heavily stirred 6.875 mL of buffered HMW Chit solution (cChit=0.727 mg/mL) in 50µL portions, waiting five seconds for mixing before the following addition of TPP. The formed suspension was stirred for a few minutes before the next step. To make the HyA coating, 8.125 mL HyA solution (c=15.4µg/mL and 61.5µg/mL) was mixed to the vigorously stirred Chit-TPPcoresuspension, resulting in Chit:HyA mass ratios of 40:1 and 10:1, respectively.
Crystals2020,10, 1113 4 of 15
2.4. Fluorescent Labeling of Nanocarriers
The labeling process was carried out using two methods: (i) addition of the labeling agents during the preparation of colloidal carriers or (ii) subsequent labeling of the preformed composites. In the first method, different amounts of Au NC dispersions were added to the synthesis mixture containing negatively charged substances (HyA and/or TPP), and then added to the buffered Chit solution. In the latter case, the Au NCs were added to previously prepared NP dispersions, labeling the surface of carriers utilizing electrostatic interaction between the polysaccharides and Au NCs. The labeling was the same for carriers containing TCP as well.
2.5. Characterization of the Fluorescent Labeling Procedure
The pure drug carriers and the labeled samples were characterized using dynamic light scattering (DLS) for determination of particle size and size distribution, and Zeta potential measurements for evaluating stability in all cases. The measurements were performed on a HORIBA SZ-100 NanoParticle Analyzer (Retsch Technology GmbH, Haan, Germany). To determine the charge neutralization point of each carrier–Au NC pair, 1 mL of drug carrier dispersion was first diluted to 3 mL with ultrapure water, and then increasing amounts of BSA- or LYZ-Au NC were added to obtain a series of samples with different carrier-Au NC mass ratios. (These labeled complexes served as titration points for the labeling process, with mass ratios before, during and after charge neutralization.) The six titrations were also investigated using DLS and Zeta potential measurements. The point of zero charge for every titration was calculated using non-linear regression method, using the six-parameter Boltzmann equation [32,33]:
y= A1∗x+A2 1+expx−A4
A3
+A5∗x+A6,
whereA1–A6 are fitting parameters. This method was not suitable for the 40:1 Chit-HyA type III+ LYZ-Au NC titration, because the fitted function always gave unsatisfactoryyvalues close tox=0, so here the four-parameter Boltzmann equation was used instead:
y=A2+ A1−A2 1+expx−A3
A4
,
whereA2 is the top value,A1 is the bottom value,A3 is thexvalue of the inflection point (half the distance betweenA2 andA1) andA4 is the range where the y value changes fromA2 toA1. After getting the parameters of the functions, the point of zero charge was calculated for every titration, and then they were compared.
The labeled complexes were investigated using fluorescent microscopy (Leica DM IL LED inverted laboratory microscope), where morphology of the labeled carriers, fluorescence emission intensity and distribution were determined. For this measurement, the samples were prepared on microscope slides using a stamping method. In our case the complexes chosen from the titration process were placed on the slides, then a small piece of fabric (stamp) was placed on the droplet. This method allowed the labeled carriers to congregate in the crevices between the fibers of the stamp during the drying step, resulting in stronger, more distinguishable fluorescence.
3. Results
3.1. Characterization of BSA- and LYZ-Au NCs
As the red-emitting Au NCs are well-known fluorescent materials, several publications can be found in the literature related to the optimization of the synthesis protocols, as well as the characterizations. In this article, we decisively focused on their applications as FRs of drug carrier systems, the detailed description of their optical and structural properties can be found in our previous articles [29,34].
Crystals2020,10, 1113 5 of 15
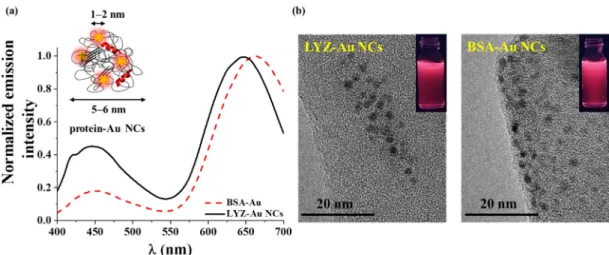
The prepared Au NCs showed intensive red emissions (λem~650 nm) using 350 nm as excitation wavelength (Figure1a), which was associated with 1.9 and 1.2µs fluorescence lifetimes (τ) in the case of LYZ- and BSA-Au NCs, respectively. The quantum yields (QY%) were ca. 4%. No plasmon bands were identified in the UV-Vis spectra, which refers to the absence of larger plasmonic Au NPs.
The optical data strongly support the presence of ultrasmall protein-Au NCs [35].
Crystals 2020, 10, x FOR PEER REVIEW 5 of 15
of LYZ- and BSA-Au NCs, respectively. The quantum yields (QY%) were ca. 4%. No plasmon bands were identified in the UV-Vis spectra, which refers to the absence of larger plasmonic Au NPs. The optical data strongly support the presence of ultrasmall protein-Au NCs [35].
Figure 1. (a) The photoluminescence (PL) spectra of the lysozyme (LYZ)- and bovine serum albumin (BSA)-gold nanoclusters (Au NCs) with the schematic illustration of protein-Au NCs and (b) the representative high resolution transmission electron microscopic (HRTEM) images of the NCs with the photos of the samples under a UV lamp.
After purifications, the dispersions contained ca. 80% of the initial gold amount, which was determined by ICP-MS. To investigate the exact structure of these Au NCs, it was found that the NCs were mostly built up from Au(0) because the 4f7/2 band was detected between 84.2–84.5 eV [36] on the XPS spectra (Figure S1). The protein chains are stretched and unfolded due to the cluster- formations, which has been verified by FT-IR and CD spectroscopy [37,38]. Based on the HRTEM images (Figure 1b), the average diameter of the synthesized Au seed was ca. 1.4 nm depending on the applied stabilizing protein. The kinetic stability of the Au NCs was determined based on DLS and ζ-potential measurements using pH = 7.4 and 0.1 M ionic strength. The hydrodynamic diameters were 5.0 ± 1.4 and 4.7 ± 1.8 nm using LYZ or BSA as stabilizing protein, respectively. Based on the data, the hydrodynamic diameters are larger than the primer gold seeds based on HRTEM thanks to the large protein shell. The ζ-potentials were −15.4 ± 2.7 and −26.4 ± 1.3 mV in the case of LYZ- and BSA-Au NCs, respectively, which refers to the good kinetic stability of the clusters under physiological conditions. To investigate the fluorescence behavior depending on the pH, it was determined that the prepared Au NCs preserved their emission properties in a wide pH range. They lost their stability and fluorescence only under extremely acidic conditions [29].
3.2. Characterization of Chit-HyA Drug Carrier NPs
The type II and type III carriers with different Chit:HyA mass ratios were successfully prepared using the ionic gelation method and simple electrostatic interaction [10]. The formed NPs have two different structures which are presented in Figure 2.
Figure 1.(a) The photoluminescence (PL) spectra of the lysozyme (LYZ)- and bovine serum albumin (BSA)-gold nanoclusters (Au NCs) with the schematic illustration of protein-Au NCs and (b) the representative high resolution transmission electron microscopic (HRTEM) images of the NCs with the photos of the samples under a UV lamp.
After purifications, the dispersions contained ca. 80% of the initial gold amount, which was determined by ICP-MS. To investigate the exact structure of these Au NCs, it was found that the NCs were mostly built up from Au(0) because the 4f7/2band was detected between 84.2–84.5 eV [36] on the XPS spectra (Figure S1 in supplementary materials). The protein chains are stretched and unfolded due to the cluster-formations, which has been verified by FT-IR and CD spectroscopy [37,38]. Based on the HRTEM images (Figure1b), the average diameter of the synthesized Au seed was ca. 1.4 nm depending on the applied stabilizing protein. The kinetic stability of the Au NCs was determined based on DLS andζ-potential measurements using pH=7.4 and 0.1 M ionic strength. The hydrodynamic diameters were 5.0±1.4 and 4.7±1.8 nm using LYZ or BSA as stabilizing protein, respectively. Based on the data, the hydrodynamic diameters are larger than the primer gold seeds based on HRTEM thanks to the large protein shell. Theζ-potentials were−15.4±2.7 and−26.4±1.3 mV in the case of LYZ- and BSA-Au NCs, respectively, which refers to the good kinetic stability of the clusters under physiological conditions. To investigate the fluorescence behavior depending on the pH, it was determined that the prepared Au NCs preserved their emission properties in a wide pH range. They lost their stability and fluorescence only under extremely acidic conditions [29].
3.2. Characterization of Chit-HyA Drug Carrier NPs
The type II and type III carriers with different Chit:HyA mass ratios were successfully prepared using the ionic gelation method and simple electrostatic interaction [10]. The formed NPs have two different structures which are presented in Figure2.
Crystals2020,10, 1113 6 of 15
Crystals 2020, 10, x FOR PEER REVIEW 6 of 15
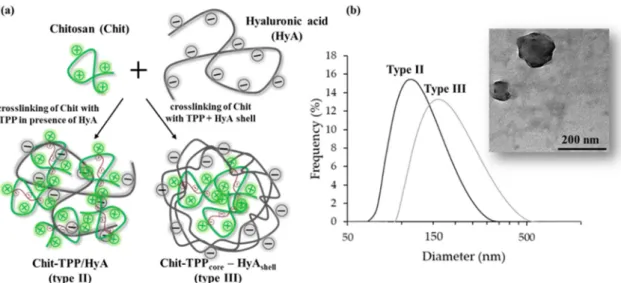
Figure 2. (a) Schematic illustration of the preparation ways of chitosan-hyaluronic acid (Chit-HyA) NPs and (b) representative dynamic light scattering (DLS) curves of type II and type III NPs with a TEM image of type II NPs.
For type II, the simultaneous addition of TPP and HyA gave more compact NPs, with the polysaccharides evenly distributed in the bulk phase. In the case of type III, the particles gained a core-shell structure, with TPP cross-linked Chit core and HyA shell, where the large molecular weight HyA polymer (approximately 6.6 times larger than Chit MW) could not penetrate the cross-linked, compact Chit core, resulting in bigger NPs [10]. The size of the carriers was measured with DLS, and size distribution was calculated from the results. Comparing the carriers with same composition (40:1 mChit:mHyA) the type III system was larger (dZ-average =187.7 ± 2.5 nm, mean size was 186.4 ± 69.0 nm), compared to type II with the same composition (dZ-average =135.4 ± 3.6 nm, the mean size for distribution calculations was 126.4 ± 40.6 nm), verifying the difference in structure. To evaluate the stability and surface charge of the carriers, zeta potential measurements were made. The values obtained from the samples were close to +11.9–13.3 mV in the synthesis buffer, which indicated that the NPs were not very stable. After three dilutions of the samples, these values rose to +15.4–20.6 mV, resulting in more stable suspensions. Furthermore, after cleaning the dispersions from the buffer with centrifugation and then redispersing the NPs in ultrapure water, the zeta potential values increased dramatically to +60–70 mV, showing that the stability of the nanocarriers is heavily dependent on the matrix conditions (mainly pH and ionic strength). The loading of hydrophobic drug TCP into the carriers slightly changed their properties, for example increased the overall charge of the NPs to +14.2–20.6 mV, enhancing the stability of the dispersion in the synthesis matrix. Aside from this the drug carriers could be used the same way as the empty NPs in the subsequent labeling process.
3.3. Evaluation of the Fluorescence Labeling with Au NCs
In order to determine the appropriate amount of the Au NCs for optimal labeling, a series of samples with different Au NC:carrier mass ratios were prepared and investigated. The goal was to examine the effect of the labeling on the size and stability of the carrier particles using DLS and zeta potential measurements. The results for different carrier formulations and Au NCs are visualized in Figure 3.
Figure 2. (a) Schematic illustration of the preparation ways of chitosan-hyaluronic acid (Chit-HyA) NPs and (b) representative dynamic light scattering (DLS) curves of type II and type III NPs with a TEM image of type II NPs.
For type II, the simultaneous addition of TPP and HyA gave more compact NPs, with the polysaccharides evenly distributed in the bulk phase. In the case of type III, the particles gained a core-shell structure, with TPP cross-linked Chit core and HyA shell, where the large molecular weight HyA polymer (approximately 6.6 times larger than Chit MW) could not penetrate the cross-linked, compact Chit core, resulting in bigger NPs [10]. The size of the carriers was measured with DLS, and size distribution was calculated from the results. Comparing the carriers with same composition (40:1 mChit:mHyA) the type III system was larger (dZ-average=187.7±2.5 nm, mean size was 186.4±69.0 nm), compared to type II with the same composition (dZ-average = 135.4 ± 3.6 nm, the mean size for distribution calculations was 126.4±40.6 nm), verifying the difference in structure. To evaluate the stability and surface charge of the carriers, zeta potential measurements were made. The values obtained from the samples were close to+11.9–13.3 mV in the synthesis buffer, which indicated that the NPs were not very stable. After three dilutions of the samples, these values rose to+15.4–20.6 mV, resulting in more stable suspensions. Furthermore, after cleaning the dispersions from the buffer with centrifugation and then redispersing the NPs in ultrapure water, the zeta potential values increased dramatically to+60–70 mV, showing that the stability of the nanocarriers is heavily dependent on the matrix conditions (mainly pH and ionic strength). The loading of hydrophobic drug TCP into the carriers slightly changed their properties, for example increased the overall charge of the NPs to +14.2–20.6 mV, enhancing the stability of the dispersion in the synthesis matrix. Aside from this the
drug carriers could be used the same way as the empty NPs in the subsequent labeling process.
3.3. Evaluation of the Fluorescence Labeling with Au NCs
In order to determine the appropriate amount of the Au NCs for optimal labeling, a series of samples with different Au NC:carrier mass ratios were prepared and investigated. The goal was to examine the effect of the labeling on the size and stability of the carrier particles using DLS and zeta potential measurements. The results for different carrier formulations and Au NCs are visualized in Figure3.
Crystals2020,10, 1113 7 of 15
Crystals 2020, 10, x FOR PEER REVIEW 7 of 15
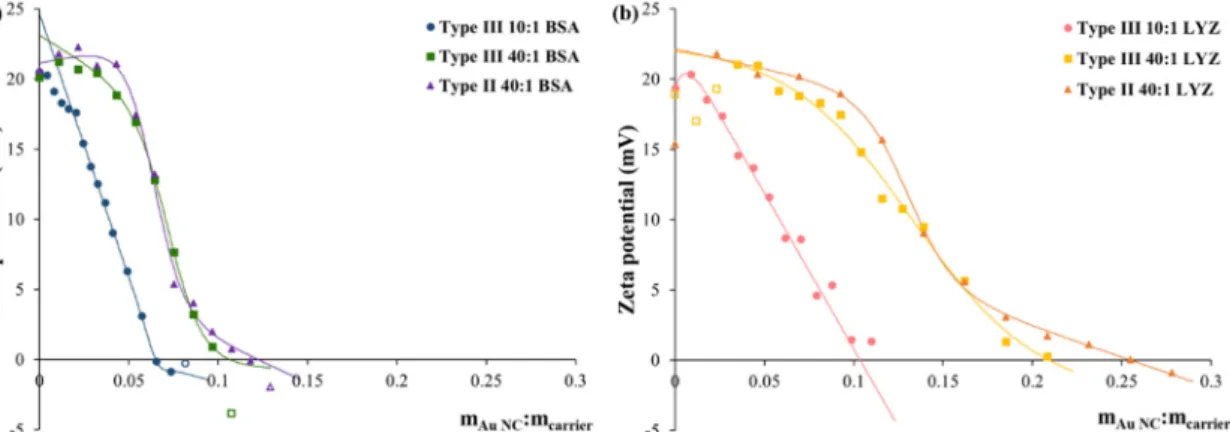
Figure 3. Zeta potential values of the (a) BSA-Au NC-labeled and (b) LYZ-Au NC-labeled Chit/HyA colloidal carriers (type II and III) as a function of Au NC:carrier mass ratios.
We observed that small amount of the NCs increases the Zeta potential values first in most cases, then it decreases in the expected way. We can state that, depending on the available polysaccharides on the surface of the carrier NPs and the type of Au NCs, the point of zero charge (ζ = 0 mV) can be observed at different mAuNC:mcarrier mass ratios. Comparing the titration results for the two nanoclusters (Figure 3a,b), it was evident that more LYZ-Au NCs are necessary to neutralize all three examined drug carriers, most probably due to their lower charge (see Section 3.1). For type III with 10:1 Chit:HyA coreChit-shellHyA NPs, the charge neutralization occurs at 0.0648 mAuNC:mcarrier for BSA- Au NC and at 0.1035 mAuNC:mcarrier for LYZ-Au NC, which means that ca. 60% more LYZ-Au NC is required compared to BSA-Au NCs. For similar type NPs (type III) with 40:1 ratio (less HyA content), 1.6 and 2.0 more BSA- and LYZ-Au NCs can bind to the carrier NPs, respectively (0.1064 mAuNC:mcarrier for BSA-Au NCs and 0.2091 mAuNC:mcarrier for LYZ-Au NCs). For type II carriers, the point of zero charge is at 0.1222 mAuNC:mcarrier for BSA-Au NCs and at 0.2548 mAuNC:mcarrier for LYZ-Au NC, which means a 15% and 22% increase in bound Au NCs quantity instead of type III with the same 40:1 mass ratio. It can be concluded that the protein-stabilized BSA- and LYZ-Au NCs having negative surface charge can bind better to the Chit-HyA colloidal NPs if the carriers are in “composite” form (type II) instead of core-shell type structure with negatively charged HyA shell. This observation clearly indicates the formation of electrostatic interaction between the colloidal carriers and the protein- stabilized Au NCs.
Observing the changes in size throughout the labeling, we could see that the particle size gradually increased between the first additions of nanoclusters, where the zeta potential was relatively large. Closer to the neutralization point the stability of the labeled systems rapidly decreased, which manifested in the exponential increase of the measured size well above 1 µm, and the particles also partially aggregated when the Zeta potential was ~5 mV or lower. After neutralization, the dispersion completely aggregated, and the Zeta potential became negative, indicating the presence of free Au NCs in the system. Figure 4 shows the representative size distribution curves of type III colloidal carriers with 40:1 Chit:HyA ratio labeled with two different fluorescent clusters.
Figure 3.Zeta potential values of the (a) BSA-Au NC-labeled and (b) LYZ-Au NC-labeled Chit/HyA colloidal carriers (type II and III) as a function of Au NC:carrier mass ratios.
We observed that small amount of the NCs increases the Zeta potential values first in most cases, then it decreases in the expected way. We can state that, depending on the available polysaccharides on the surface of the carrier NPs and the type of Au NCs, the point of zero charge (ζ=0 mV) can be observed at different mAuNC:mcarrier mass ratios. Comparing the titration results for the two nanoclusters (Figure3a,b), it was evident that more LYZ-Au NCs are necessary to neutralize all three examined drug carriers, most probably due to their lower charge (see Section3.1). For type III with 10:1 Chit:HyA coreChit-shellHyANPs, the charge neutralization occurs at 0.0648 mAuNC:mcarrierfor BSA-Au NC and at 0.1035 mAuNC:mcarrierfor LYZ-Au NC, which means that ca. 60% more LYZ-Au NC is required compared to BSA-Au NCs. For similar type NPs (type III) with 40:1 ratio (less HyA content), 1.6 and 2.0 more BSA- and LYZ-Au NCs can bind to the carrier NPs, respectively (0.1064 mAuNC:mcarrier for BSA-Au NCs and 0.2091 mAuNC:mcarrierfor LYZ-Au NCs). For type II carriers, the point of zero charge is at 0.1222 mAuNC:mcarrierfor BSA-Au NCs and at 0.2548 mAuNC:mcarrier
for LYZ-Au NC, which means a 15% and 22% increase in bound Au NCs quantity instead of type III with the same 40:1 mass ratio. It can be concluded that the protein-stabilized BSA- and LYZ-Au NCs having negative surface charge can bind better to the Chit-HyA colloidal NPs if the carriers are in “composite” form (type II) instead of core-shell type structure with negatively charged HyA shell. This observation clearly indicates the formation of electrostatic interaction between the colloidal carriers and the protein-stabilized Au NCs.
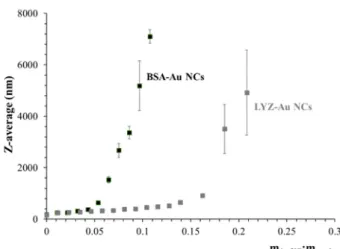
Observing the changes in size throughout the labeling, we could see that the particle size gradually increased between the first additions of nanoclusters, where the zeta potential was relatively large. Closer to the neutralization point the stability of the labeled systems rapidly decreased, which manifested in the exponential increase of the measured size well above 1µm, and the particles also partially aggregated when the Zeta potential was ~5 mV or lower. After neutralization, the dispersion completely aggregated, and the Zeta potential became negative, indicating the presence of free Au NCs in the system. Figure4shows the representative size distribution curves of type III colloidal carriers with 40:1 Chit:HyA ratio labeled with two different fluorescent clusters.
Crystals2020,10, 1113 8 of 15
Crystals 2020, 10, x FOR PEER REVIEW 8 of 15
Figure 4. Average particle size (Z-average) of type III (40:1 Chit:HyA ratio) colloidal NPs labeled with BSA- (black) and LYZ- (grey) Au NCs as a function of Au NC:carrier mass ratios.
3.3.1. Comparison of Different Labeling Techniques
Following the quantitative evaluation of the labeling, we tried to determine whether labeling during or after carrier synthesis is the better method. For this experiment we chose different carrier- Au NC compositions, and prepared the samples in the following sequence: for labeling after synthesis, the Au NCs were added to the previously fabricated NPs under vigorous stirring. For simultaneous labeling, the NCs were introduced during preparation, where they were mixed to the HyA-TPP mixture (for type II) or to the TPP solution (for type III, during the Chit-TPPcore preparation step). From these two methods, we expected two different structures to form: one with high Au NC content on the surface, and one with the nanoclusters evenly distributed in the marked particle.
The results of these experiments showed that the two methods gave clearly different products, and the difference was also visually perceptible. The postlabeled carriers were obviously larger in size (ca. 30–40% higher), and even the turbidity of these dispersions was bigger. These observations were also verified with DLS measurements, as shown in Figure 5. The particle size also increased for simultaneous labeling (ca. 10–15% higher) compared to the bare drug carriers. Summarizing our findings, we were able to choose which method was better for the fluorescent labeling. On the one hand, the labeling during synthesis produced smaller particles, with the marker evenly distributed in the entire nanocarrier. This means that normalizing for particle size, larger amounts of Au NCs could be introduced to the system this way, but this method strongly changes the particle structure, thus its encapsulation and drug release capabilities. Furthermore, large amounts of the nanoclusters became unreachable with this method, which could hinder the release of drugs linked to the BSA or LYZ by changing the tertiary structure of the proteins. This structural modification could also cause detrimental effects on the fluorescence stability and intensity. On the other hand, the postlabeling method gave larger particles with lower fluorescent marker density comparing same-sized NPs. The NCs were situated on the surface of the labeled carrier, which has several advantages. First, the structure of both the carrier and the fluorescent marker remained rather intact, which would mean fewer changes in the encapsulation and release properties of the carrier and the proteins in the nanoclusters. With this method, the initial fluorescence properties of the Au NCs could be better preserved as well. Thus, we chose the labeling of the pre-formed colloidal NPs for the investigations on fluorescence.
Figure 4.Average particle size (Z-average) of type III (40:1 Chit:HyA ratio) colloidal NPs labeled with BSA- (black) and LYZ- (grey) Au NCs as a function of Au NC:carrier mass ratios.
3.3.1. Comparison of Different Labeling Techniques
Following the quantitative evaluation of the labeling, we tried to determine whether labeling during or after carrier synthesis is the better method. For this experiment we chose different carrier-Au NC compositions, and prepared the samples in the following sequence: for labeling after synthesis, the Au NCs were added to the previously fabricated NPs under vigorous stirring. For simultaneous labeling, the NCs were introduced during preparation, where they were mixed to the HyA-TPP mixture (for type II) or to the TPP solution (for type III, during the Chit-TPPcorepreparation step). From these two methods, we expected two different structures to form: one with high Au NC content on the surface, and one with the nanoclusters evenly distributed in the marked particle.
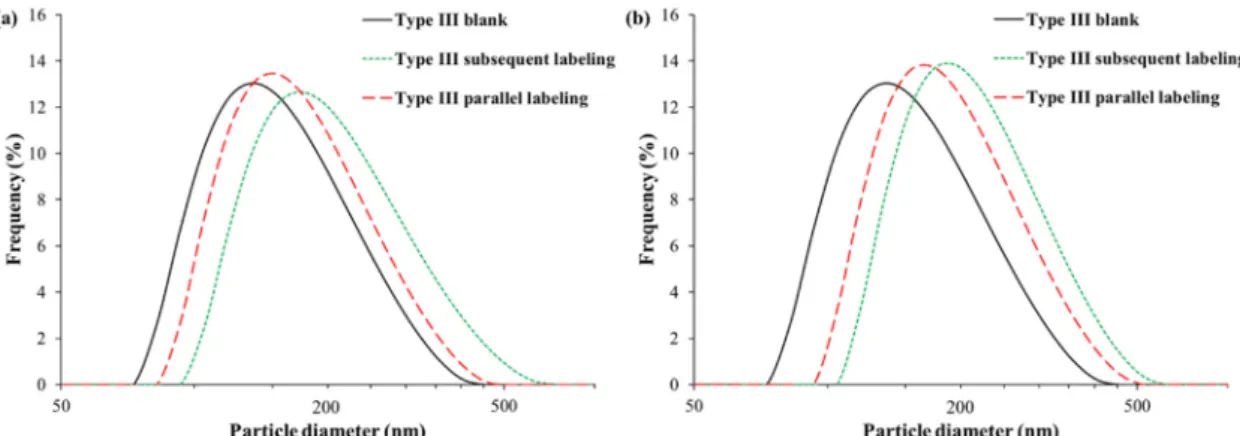
The results of these experiments showed that the two methods gave clearly different products, and the difference was also visually perceptible. The postlabeled carriers were obviously larger in size (ca. 30–40% higher), and even the turbidity of these dispersions was bigger. These observations were also verified with DLS measurements, as shown in Figure5. The particle size also increased for simultaneous labeling (ca. 10–15% higher) compared to the bare drug carriers. Summarizing our findings, we were able to choose which method was better for the fluorescent labeling. On the one hand, the labeling during synthesis produced smaller particles, with the marker evenly distributed in the entire nanocarrier. This means that normalizing for particle size, larger amounts of Au NCs could be introduced to the system this way, but this method strongly changes the particle structure, thus its encapsulation and drug release capabilities. Furthermore, large amounts of the nanoclusters became unreachable with this method, which could hinder the release of drugs linked to the BSA or LYZ by changing the tertiary structure of the proteins. This structural modification could also cause detrimental effects on the fluorescence stability and intensity. On the other hand, the postlabeling method gave larger particles with lower fluorescent marker density comparing same-sized NPs. The NCs were situated on the surface of the labeled carrier, which has several advantages. First, the structure of both the carrier and the fluorescent marker remained rather intact, which would mean fewer changes in the encapsulation and release properties of the carrier and the proteins in the nanoclusters. With this method, the initial fluorescence properties of the Au NCs could be better preserved as well. Thus, we chose the labeling of the pre-formed colloidal NPs for the investigations on fluorescence.
Crystals2020,10, 1113 9 of 15
Crystals 2020, 10, x FOR PEER REVIEW 9 of 15
Figure 5. Representative size distributions of the type III (40:1 Chit:HyA ratio) carriers labeling with BSA- (a) or LYZ-Au NC (b).
3.3.2. Labeling of Drug-Loaded Carriers
Continuing the investigation of drug carrier labeling, we examined whether the hydrophobic model drug TCP could be introduced into this system without complications. First, we tested the ethanol and TCP tolerance of the nanoclusters. In this experiment different amounts of ethanol or TCP/ethanol solution was added to Au NC dispersions under stirring. The dispersion did not show any changes to ethanol, no aggregation occurred even after adding twice the amount to the system.
In the case of TCP, only the drug formed particles in the Au NC dispersion due to the high water content where TCP was insoluble, while the nanoclusters remained stable.
The nanocluster stability measurements allowed us to try preparing drug-loaded, fluorescence- labeled complexes. The preparation methods were the same as mentioned before, but the drug was added to the HyA-TPP or TPP solutions, accompanied by parallel fluorescent marking of the fabricated samples. The final products showed good stability, no aggregation happened during or after synthesis. These samples were also investigated by DLS. The results in Figure S2 further proved that the drug loading only caused a small increase in particle size. Zeta potential measurements also ascertained the stability of the NPs, with values around +19.4–23.6 mV. These results showed that the fluorescent labeling of loaded carriers can be successfully carried out.
3.4. Fluorescence Measurements
3.4.1. Fluorescence Spectroscopy Studies
To quantify the effectiveness of the postlabeled syntheses, the emission intensities of the NCs were measured by a simple spectrofluorimetric technique. In all cases, five individual samples were prepared based on the previously registered titration curves (Figure 3) in the case of the type II and the type III (40:1) composites. After the measurements, the relative fluorescence (F/F0) was calculated by using blank solutions, which contained the adequate amount of protein-Au NCs without the drug carrier systems under the same conditions. The results can be seen on the Figure 6.
Figure 5.Representative size distributions of the type III (40:1 Chit:HyA ratio) carriers labeling with BSA- (a) or LYZ-Au NC (b).
3.3.2. Labeling of Drug-Loaded Carriers
Continuing the investigation of drug carrier labeling, we examined whether the hydrophobic model drug TCP could be introduced into this system without complications. First, we tested the ethanol and TCP tolerance of the nanoclusters. In this experiment different amounts of ethanol or TCP/ethanol solution was added to Au NC dispersions under stirring. The dispersion did not show any changes to ethanol, no aggregation occurred even after adding twice the amount to the system.
In the case of TCP, only the drug formed particles in the Au NC dispersion due to the high water content where TCP was insoluble, while the nanoclusters remained stable.
The nanocluster stability measurements allowed us to try preparing drug-loaded, fluorescence-labeled complexes. The preparation methods were the same as mentioned before, but the drug was added to the HyA-TPP or TPP solutions, accompanied by parallel fluorescent marking of the fabricated samples. The final products showed good stability, no aggregation happened during or after synthesis. These samples were also investigated by DLS. The results in Figure S2 further proved that the drug loading only caused a small increase in particle size. Zeta potential measurements also ascertained the stability of the NPs, with values around+19.4–23.6 mV. These results showed that the fluorescent labeling of loaded carriers can be successfully carried out.
3.4. Fluorescence Measurements
3.4.1. Fluorescence Spectroscopy Studies
To quantify the effectiveness of the postlabeled syntheses, the emission intensities of the NCs were measured by a simple spectrofluorimetric technique. In all cases, five individual samples were prepared based on the previously registered titration curves (Figure3) in the case of the type II and the type III (40:1) composites. After the measurements, the relative fluorescence (F/F0) was calculated by using blank solutions, which contained the adequate amount of protein-Au NCs without the drug carrier systems under the same conditions. The results can be seen on the Figure6.
CrystalsCrystals 2020, 10, x FOR PEER REVIEW 2020,10, 1113 10 of 1510 of 15
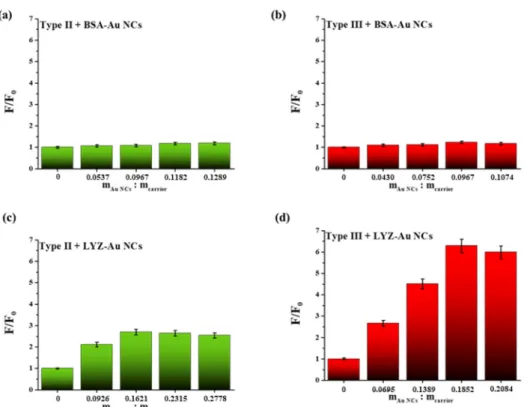
Figure 6. The relative fluorescence of the postlabeled composites using BSA-Au NCs (a,b) and LYZ- Au NCs (c,d).
Based on the measurements, it was found that more intensive fluorescence can be detected using LYZ-Au NCs. As it can be seen, in the case of the type II carrier system the measured intensity was increased threefold, while the F/F0 reached ca. 6.5 value at the type III delivery system. In contrast, the BSA-Au NCs did not show any significant changes in the luminescent properties independently from the chemical structure of the carriers. After a deeper study of the measured data, some interesting phenomena can be identified. On one hand, if we examine the difference between the same types of carriers, this growth can be due to the larger amount of the LYZ-Au NCs. As the larger amount of the fluorescent object can lead to a decrease in the distance between the NCs, aggregation- induced emission (AIE) can be realized [39]. Due to the strongly inhibited intramolecular rotations and vibrations, the decrease of PL intensity does not occur. On the other hand, the type of carrier systems also has a large effect on the detected intensities. Based on Section 3.2, the exact structure of the type III drug carrier system was assigned. This well-defined Chit-TPPcore–HyAshell, which has a large local negative charge excess on its surface, can bind much more LYZ-Au NCs on its surface.
The applied pH (pH = 4.50) is close to the charge transfer point of the stabilizer BSA, while the LYZ has positive charge till pH = 10.0 [29]. Based on this fact, most probably the strength of the electrostatic interaction between the LYZ-stabilized NCs as potential FRs and the drug delivery system having core-shell structure with negative surface charge is more dominant.
3.4.2. Fluorescence Microscopy Measurements
In the case of fluorescently labeled samples, it was important to determine whether the interaction between the carrier and the Au NCs was strong, or the NCs could be washed off from the surface. It was also necessary to figure out whether a minimal amount of NCs could provide enough fluorescence. To resolve these questions, samples with no fluorescent marker and ones with few or many nanoclusters (close to zero charge mass ratios) were put on microscope slides with a stamping method. This way allowed the fluorescent complexes (NPs or larger aggregates) to gather in the holes left by the stamping fabric between its fibers, thus giving stronger fluorescence compared to normally prepared samples, where the particles are evenly distributed on the slide. This method was
Figure 6.The relative fluorescence of the postlabeled composites using BSA-Au NCs (a,b) and LYZ-Au NCs (c,d).
Based on the measurements, it was found that more intensive fluorescence can be detected using LYZ-Au NCs. As it can be seen, in the case of the type II carrier system the measured intensity was increased threefold, while the F/F0reached ca. 6.5 value at the type III delivery system. In contrast, the BSA-Au NCs did not show any significant changes in the luminescent properties independently from the chemical structure of the carriers. After a deeper study of the measured data, some interesting phenomena can be identified. On one hand, if we examine the difference between the same types of carriers, this growth can be due to the larger amount of the LYZ-Au NCs. As the larger amount of the fluorescent object can lead to a decrease in the distance between the NCs, aggregation-induced emission (AIE) can be realized [39]. Due to the strongly inhibited intramolecular rotations and vibrations, the decrease of PL intensity does not occur. On the other hand, the type of carrier systems also has a large effect on the detected intensities. Based on Section3.2, the exact structure of the type III drug carrier system was assigned. This well-defined Chit-TPPcore–HyAshell, which has a large local negative charge excess on its surface, can bind much more LYZ-Au NCs on its surface. The applied pH (pH=4.50) is close to the charge transfer point of the stabilizer BSA, while the LYZ has positive charge till pH=10.0 [29]. Based on this fact, most probably the strength of the electrostatic interaction between the LYZ-stabilized NCs as potential FRs and the drug delivery system having core-shell structure with negative surface charge is more dominant.
3.4.2. Fluorescence Microscopy Measurements
In the case of fluorescently labeled samples, it was important to determine whether the interaction between the carrier and the Au NCs was strong, or the NCs could be washed offfrom the surface. It was also necessary to figure out whether a minimal amount of NCs could provide enough fluorescence.
To resolve these questions, samples with no fluorescent marker and ones with few or many nanoclusters (close to zero charge mass ratios) were put on microscope slides with a stamping method. This way allowed the fluorescent complexes (NPs or larger aggregates) to gather in the holes left by the stamping fabric between its fibers, thus giving stronger fluorescence compared to normally prepared samples, where the particles are evenly distributed on the slide. This method was appropriate for samples with
Crystals2020,10, 1113 11 of 15
no marker or close to zero charge, but, for carriers with few attached NCs, the aggregation effect was not enough to detect any fluorescence. For these samples, the NPs were aggregated by adding more NaOH solution to the labeled dispersions, this way more fluorescent NPs could be placed on the slides.
The results of the microscopy verified that the labeling was successful, as it can be seen in Figure7 and Figures S3 and S4.
Crystals 2020, 10, x FOR PEER REVIEW 11 of 15
appropriate for samples with no marker or close to zero charge, but, for carriers with few attached NCs, the aggregation effect was not enough to detect any fluorescence. For these samples, the NPs were aggregated by adding more NaOH solution to the labeled dispersions, this way more fluorescent NPs could be placed on the slides.
The results of the microscopy verified that the labeling was successful, as it can be seen in Figure 7 and Figures S3 and S4.
Figure 7. Fluorescence microscopy images of BSA- (left) and LYZ- (right) Au NCs-labeled type III NPs with 40:1 mass ratio (upper: addition of 50 µL NC dispersion; below: addition of 300 µL NC dispersion mAu NC/mcarrier = 0.0215 (upper) and 0.1389 (below).
For samples with no marker, no light emission was detected, showing that the carrier NPs had no detectable intrinsic fluorescence. The carriers with few NCs gave minimal fluorescence (Figure 7 upper images), as the stamping method could not accumulate the particles very well due to the hardened structure of the aggregates caused by the high pH. Nevertheless, the presence of gold NCs linked to the carriers could be verified, and even small amounts caused visible emission. For labeled carriers close to zero charge, the stamping could effectively increase the fluorescence in certain positions, therefore enabling us to better discern differences between each formulation. Compared to BSA-Au NC, carriers marked with LYZ-Au NC gave stronger emission in all cases, verifying the results of the fluorescence spectroscopy. This effect could be caused by the higher concentration of LYZ-Au NCs required for charge neutralization, so we compared the carriers using the same amount of both NCs. We discovered that the fluorescence intensity remained higher, so the LYZ-Au NCs performed better in the labeling experiments (Figure 7). This difference could be caused by the AIE effect, as mentioned in the previous section [39]. Comparing our samples based on the carrier type, we could see that some changes in fluorescence occurred due to the different Chit:HyA mass ratios and structures. For type III formulations, larger amounts of HyA meant that fewer Au NCs could be linked to the carrier, meaning lower fluorescence intensity. This amount could be increased with simultaneous marking during fabrication, taking into consideration the effects on the structure of both carrier and Au NCs. The exchange of HyA with NCs is also possible, but in this case the shell thickness would be sacrificed for higher fluorescence intensity. However, it is also important to mention that using the same amount of marker for different compositions, the ones with more HyA gave higher fluorescence, but this effect also resulted in the loss of particle stability and increase in size. Examining type II and III carriers with the same composition (Figures S3 and S4), we could see that the fluorescence was more intensive for type III carriers. This could be explained by the fact that the surface concentration of HyA was higher for the core-shell type particles, and the proximity of the polysaccharide to the NCs somehow increased the fluorescence intensity, maybe due to HyA molecules inhibiting the free movement of the cluster-stabilizing LYZ protein. This could also explain why the higher HyA concentration in type III carriers caused stronger emission despite using equal amounts of nanoclusters.
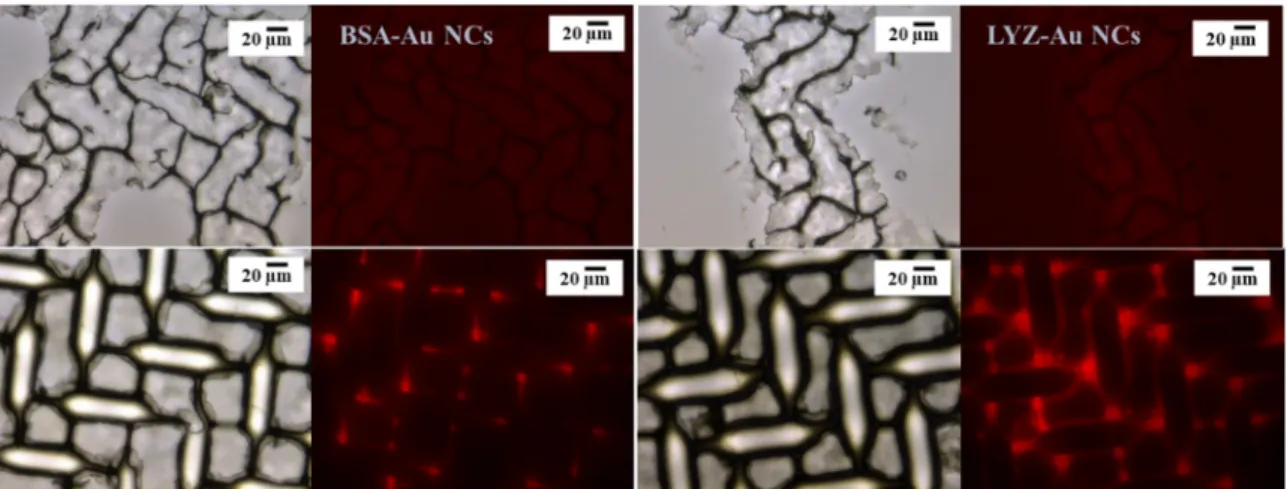
Figure 7.Fluorescence microscopy images of BSA- (left) and LYZ- (right) Au NCs-labeled type III NPs with 40:1 mass ratio (upper: addition of 50µL NC dispersion; below: addition of 300µL NC dispersion mAu NC/mcarrier=0.0215 (upper) and 0.1389 (below).
For samples with no marker, no light emission was detected, showing that the carrier NPs had no detectable intrinsic fluorescence. The carriers with few NCs gave minimal fluorescence (Figure7upper images), as the stamping method could not accumulate the particles very well due to the hardened structure of the aggregates caused by the high pH. Nevertheless, the presence of gold NCs linked to the carriers could be verified, and even small amounts caused visible emission. For labeled carriers close to zero charge, the stamping could effectively increase the fluorescence in certain positions, therefore enabling us to better discern differences between each formulation. Compared to BSA-Au NC, carriers marked with LYZ-Au NC gave stronger emission in all cases, verifying the results of the fluorescence spectroscopy. This effect could be caused by the higher concentration of LYZ-Au NCs required for charge neutralization, so we compared the carriers using the same amount of both NCs. We discovered that the fluorescence intensity remained higher, so the LYZ-Au NCs performed better in the labeling experiments (Figure7). This difference could be caused by the AIE effect, as mentioned in the previous section [39]. Comparing our samples based on the carrier type, we could see that some changes in fluorescence occurred due to the different Chit:HyA mass ratios and structures.
For type III formulations, larger amounts of HyA meant that fewer Au NCs could be linked to the carrier, meaning lower fluorescence intensity. This amount could be increased with simultaneous marking during fabrication, taking into consideration the effects on the structure of both carrier and Au NCs. The exchange of HyA with NCs is also possible, but in this case the shell thickness would be sacrificed for higher fluorescence intensity. However, it is also important to mention that using the same amount of marker for different compositions, the ones with more HyA gave higher fluorescence, but this effect also resulted in the loss of particle stability and increase in size. Examining type II and III carriers with the same composition (Figures S3 and S4), we could see that the fluorescence was more intensive for type III carriers. This could be explained by the fact that the surface concentration of HyA was higher for the core-shell type particles, and the proximity of the polysaccharide to the NCs somehow increased the fluorescence intensity, maybe due to HyA molecules inhibiting the free movement of the cluster-stabilizing LYZ protein. This could also explain why the higher HyA concentration in type III carriers caused stronger emission despite using equal amounts of nanoclusters.
Crystals2020,10, 1113 12 of 15
After successfully verifying the fluorescence of the complexes, we investigated the stability of the interaction by washing the samples before or after the stamping. For the first method, the dispersions were centrifuged, and then the carriers were redispersed in ultrapure water. The washed samples were placed on the slides as described previously. For the other method, the samples dried on the slides were wetted with ultrapure water to dissolve and to get rid of the buffer salts and other contaminants.
The water was removed from the glass, and the complexes were dried again. The samples washed both ways showed satisfactory emission during measurements, meaning that the interaction between the carriers and the nanoclusters was strong enough to retain the fluorescent properties of the complexes.
4. Discussion
Different protein-stabilized red-emitting Au NCs having same size and optical properties and Chit-HyA drug carriers have been fabricated to investigate whether their interaction could lead to fluorescently labeled complex systems. DLS and zeta potential measurements clearly proved the size, good size distribution and adequate stability of the prepared systems in both cases. Then, the Chit-HyA colloid carrier systems were titrated with the nanocluster aqueous dispersions, and the resulting complex dispersions were evaluated using DLS, zeta potential, fluorimetry and fluorescent microscopy studies. Based on the quantitative charge titration measurements we established that the carriers having more HyA molecules closer to the particle surface (either because of larger HyA content or different structure) could bind less Au NCs, losing their stability sooner. From this point of view, the type II with 40:1 Chit:HyA ratio could be labeled with the most fluorescent NCs. Comparing the two gold NCs, more LYZ-Au NCs were necessary for charge neutralization, therefore stronger fluorescence could be reached with these. Fluorescence spectroscopy and microscopy helped us in visualizing the actual emission properties of the complexes. Our findings gave similar results with both techniques, further proving the superiority of LYZ-Au NCs, because higher emission intensity could be reached with these, even using the same NC concentrations. As for the carriers, the ones with higher HyA concentration near the surface showed stronger fluorescence with LYZ-Au NCs despite the lower Au NC concentration, probably due to the AIE effect. Based on these facts, for a good labeling reaction the NC content has to be precisely controlled to reach high fluorescence, while also keeping the particle size and stability in check.
The next step in our work was to evaluate two different labeling methods: adding the fluorescent marker during or after synthesis. While both methods have their own advantages and drawbacks, the postlabeling allows fewer NCs to be bound to the carrier particles, but, this way, the structure, and thus the encapsulation and release properties of the two components, as well as the freedom of Au NCs, could be better retained.
The last part of our investigation was to determine whether the labeling works for drug loaded carriers or not. We concluded that the labeling method was capable of producing small, stable fluorescent drug loaded nanocarriers, which could be used in further pharmaceutical or medical applications.
Supplementary Materials:The following are available online athttp://www.mdpi.com/2073-4352/10/12/1113/s1, Figure S1. Representative XPS spectra of (a) LYZ-Au NC and (b) BSA-Au NC, Figure S2: Representative DLS curves of type III NPs labeled with (a) BSA-Au NC or (b) LYZ-Au NC, with the blank (black), labeled (red) and labeled, drug-loaded carriers (green), Figure S3: Fluorescence microscopy images of BSA- (left) and LYZ- (right) Au NCs-labeled type III NPs with 10:1 mass ratio (upper: addition of 50µL NC dispersion; below: addition of 140 µL NC dispersion cAu=0.0163 (upper) and 0.0615 (below)), Figure S4: Fluorescence microscopy images of BSA- (left) and LYZ- (right) Au NCs-labeled type II NPs with 40:1 mass ratio (upper: addition of 50µL NC dispersion;
below: addition of 350µL NC dispersion cAu=0.0215 (upper) and 0.1621 (below)).
Author Contributions: Conceptualization, D.U. and E.C.; methodology,Á.T. and D.U.; formal analysis, E.C.;
investigation,Á.T. and D.U.; writing—original draft preparation,Á.T. and D.U.; writing—review and editing, E.C.; visualization,Á.T., D.U., E.C.; supervision, E.C.; funding acquisition, E.C. All authors have read and agreed to the published version of the manuscript.
Funding:This research was supported by the National Research, Development and Innovation Office-NKDIH through GINOP-2.3.2-15-2016-0038 and FK 131446.
Crystals2020,10, 1113 13 of 15
Acknowledgments:E. Csapóthanks the financial support of János Bolyai Research Scholarship of the Hungarian Academy of Sciences.
Conflicts of Interest:The authors declare no conflict of interest.
References
1. Liu, Z.; Jiao, Y.; Wang, Y.; Zhou, C.; Zhang, Z. Polysaccharides-based nanoparticles as drug delivery systems.
Adv. Drug Deliv. Rev.2008,60, 1650–1662. [CrossRef]
2. Ye, Y.J.; Wang, Y.; Lou, K.Y.; Chen, Y.Z.; Chen, R.; Gao, F. The preparation, characterization, and pharmacokinetic studies of chitosan nanoparticles loaded with paclitaxel/dimethyl-β-cyclodextrin inclusion complexes.Int. J. Nanomed.2015,10, 4309–4319. [CrossRef]
3. Varga, N.; Hornok, V.; Janovák, L.; Dékány, I.; Csapó, E. The effect of synthesis conditions and tunable hydrophilicity on the drug encapsulation capability of PLA and PLGA nanoparticles. Colloids Surf.
B Biointerfaces2019,176, 212–218. [CrossRef] [PubMed]
4. Mohammed, M.; Syeda, J.; Wasan, K.; Wasan, E. An Overview of Chitosan Nanoparticles and Its Application in Non-Parenteral Drug Delivery.Pharmaceutics2017,9, 53. [CrossRef] [PubMed]
5. Huang, G.; Chen, J. Preparation and applications of hyaluronic acid and its derivatives.Int. J. Biol. Macromol.
2019,125, 478–484. [CrossRef] [PubMed]
6. Kovács, A.N.; Varga, N.; Juhász,Á.; Csapó, E. Serum protein-hyaluronic acid complex nanocarriers: Structural characterisation and encapsulation possibilities.Carbohydr. Polym.2020,251, 117047. [CrossRef] [PubMed]
7. Coimbra, P.; Alves, P.; Valente, T.A.M.; Santos, R.; Correia, I.J.; Ferreira, P. Sodium hyaluronate/chitosan polyelectrolyte complex scaffolds for dental pulp regeneration: Synthesis and characterization. Int. J.
Biol. Macromol.2011,49, 573–579. [CrossRef] [PubMed]
8. Rocha Neto, J.B.M.; Taketa, T.B.; Bataglioli, R.A.; Pimentel, S.B.; Santos, D.M.; Fiamingo, A.; Costa, C.A.R.;
Campana-Filho, S.P.; Carvalho, H.F.; Beppu, M.M. Tailored chitosan/hyaluronan coatings for tumor cell adhesion: Effects of topography, charge density and surface composition.Appl. Surf. Sci.2019,486, 508–518.
[CrossRef]
9. Almalik, A.; Donno, R.; Cadman, C.J.; Cellesi, F.; Day, P.J.; Tirelli, N. Hyaluronic acid-coated chitosan nanoparticles: Molecular weight-dependent effects on morphology and hyaluronic acid presentation.
J. Control. Release2013,172, 1142–1150. [CrossRef]
10. Turcsányi,Á.; Varga, N.; Csapó, E. Chitosan-modified hyaluronic acid-based nanosized drug carriers.Int. J.
Biol. Macromol.2020,148. [CrossRef]
11. Liu, R.; Hu, C.; Yang, Y.; Zhang, J.; Gao, H. Theranostic nanoparticles with tumor-specific enzyme-triggered size reduction and drug release to perform photothermal therapy for breast cancer treatment.Acta Pharm.
Sin. B2019,9, 410–420. [CrossRef] [PubMed]
12. Tao, Y.; Li, M.; Kim, B.; Auguste, D.T. Incorporating gold nanoclusters and target-directed liposomes as a synergistic amplified colorimetric sensor for HER2-positive breast cancer cell detection.Theranostics2017,7, 899–911. [CrossRef] [PubMed]
13. Wang, X.; Ai, A.; Yu, Z.; Deng, M.; Liu, W.; Zhou, G.; Li, W.; Zhang, W.; Cao, Y.; Wang, X. Dual-modal non-invasive imaging in vitro and in vivo monitoring degradation of PLGA scaffold based gold nanoclusters.
Mater. Sci. Eng. C2020,107, 110307. [CrossRef] [PubMed]
14. Khandelia, R.; Bhandari, S.; Pan, U.N.; Ghosh, S.S.; Chattopadhyay, A. Gold Nanocluster Embedded Albumin Nanoparticles for Two-Photon Imaging of Cancer Cells Accompanying Drug Delivery. Small2015, 11, 4075–4081. [CrossRef] [PubMed]
15. Bai, Y.; Shu, T.; Su, L.; Zhang, X. Fluorescent Gold Nanoclusters for Biosensor and Bioimaging Application.
Crystals2020,10, 357. [CrossRef]
16. Cantelli, A.; Battistelli, G.; Guidetti, G.; Manzi, J.; Di Giosia, M.; Montalti, M. Luminescent gold nanoclusters as biocompatible probes for optical imaging and theranostics.Dye. Pigment.2016,135, 64–79. [CrossRef]
17. Zhang, Y.; Zhang, C.; Xu, C.; Wang, X.; Liu, C.; Waterhouse, G.I.N.; Wang, Y.; Yin, H. Ultrasmall Au nanoclusters for biomedical and biosensing applications: A mini-review. Talanta 2019, 200, 432–442.
[CrossRef]
Crystals2020,10, 1113 14 of 15
18. Csapó, E.; Ungor, D.; Kele, Z.; Baranyai, P.; Deák, A.; Juhász,Á.; Janovák, L.; Dékány, I. Influence of pH and aurate/amino acid ratios on the tuneable optical features of gold nanoparticles and nanoclusters.Colloids Surf.
A Physicochem. Eng. Asp.2017,532, 601–608. [CrossRef]
19. Csapó, E.; Ungor, D.; Juhász,Á.; Tóth, G.K.; Dékány, I. Gold nanohybrid systems with tunable fluorescent feature: Interaction of cysteine and cysteine-containing peptides with gold in two-and three-dimensional systems.Colloids Surf. A Physicochem. Eng. Asp.2016,511, 264–271. [CrossRef]
20. Ungor, D.; Csapó, E.; Kismárton, B.; Juhász, A.; Dékány, I. Nucleotide-directed syntheses of gold nanohybrid systems with structure-dependent optical features: Selective fluorescence sensing of Fe3+ions.Colloids Surf.
B Biointerfaces2017,155, 135–141. [CrossRef]
21. Xie, J.; Zheng, Y.; Ying, J.Y. Highly selective and ultrasensitive detection of Hg2+based on fluorescence quenching of Au nanoclusters by Hg2+-Au+interactions.Chem. Commun.2010,46, 961–963. [CrossRef]
[PubMed]
22. Wei, H.; Wang, Z.; Yang, L.; Tian, S.; Hou, C.; Lu, Y. Lysozyme-stabilized gold fluorescent cluster: Synthesis and application as Hg2+sensor.Analyst2010,135, 1406–1410. [CrossRef] [PubMed]
23. Yahia-Ammar, A.; Sierra, D.; Mérola, F.; Hildebrandt, N.; Le Guével, X. Self-Assembled Gold Nanoclusters for Bright Fluorescence Imaging and Enhanced Drug Delivery.ACS Nano2016,10, 2591–2599. [CrossRef]
[PubMed]
24. Shang, L.; Nienhaus, G.U. Gold nanoclusters as novel optical probes for in vitro and in vivo fluorescence imaging.Biophys. Rev.2012,4, 313–322. [CrossRef]
25. Zheng, Y.; Liu, W.; Chen, Y.; Li, C.; Jiang, H.; Wang, X. Conjugating gold nanoclusters and antimicrobial peptides: From aggregation-induced emission to antibacterial synergy.J. Colloid Interface Sci.2019,546, 1–10.
[CrossRef]
26. Gao, F.; Zheng, W.; Gao, L.; Cai, P.; Liu, R.; Wang, Y.; Yuan, Q.; Zhao, Y.; Gao, X. Au Nanoclusters and Photosensitizer Dual Loaded Spatiotemporal Controllable Liposomal Nanocomposites Enhance Tumor Photodynamic Therapy Effect by Inhibiting Thioredoxin Reductase.Adv. Healthc. Mater.2017,6, 1601453.
[CrossRef]
27. Volden, S.; Lystvet, S.M.; Halskau, Ø.; Glomm, W.R. Generally applicable procedure for in situ formation of fluorescent protein-gold nanoconstructs.RSC Adv.2012,2, 11704–11711. [CrossRef]
28. Xie, J.; Zheng, Y.; Ying, J.Y. Protein-directed synthesis of highly fluorescent gold nanoclusters.J. Am. Chem. Soc.
2009,131, 888–889. [CrossRef]
29. Hornok, V.; Csapó, E.; Varga, N.; Ungor, D.; Seb˝ok, D.; Janovák, L.; Laczkó, G.; Dékány, I. Controlled syntheses and structural characterization of plasmonic and red-emitting gold/lysozyme nanohybrid dispersions.
Colloid Polym. Sci.2016,294, 49–58. [CrossRef]
30. Silva, A.S.; Silva, M.C.; Miguel, S.P.; Bonifácio, V.D.B.; Correia, I.J.; Aguiar-Ricardo, A. Nanogold POxylation:
Towards always-on fluorescent lung cancer targeting.RSC Adv.2016,6, 33631–33635. [CrossRef]
31. Ungor, D.; Horváth, K.; Dékány, I.; Csapó, E. Red-emitting gold nanoclusters for rapid fluorescence sensing of tryptophan metabolites.Sens. Actuators B Chem.2019,288, 728–733. [CrossRef]
32. Páhi, A.B.; Király, Z.; Mastalir,Á.; Dudás, J.; Puskás, S.; Vágó,Á. Thermodynamics of micelle formation of the counterion coupled gemini surfactant bis(4-(2-dodecyl)benzenesuifonate)-jeffamine salt and its dynamic adsorption on sandstone.J. Phys. Chem. B2008,112, 15320–15326. [CrossRef] [PubMed]
33. Juhász, Á.; Tabajdi, R.; Dékány, I.; Csapó, E. Thermodynamic Characterization of Temperature- and Composition-Dependent Mixed Micelle Formation in Aqueous Medium. J. Surfactants Deterg. 2017,20, 1291–1299. [CrossRef]
34. Ungor, D.; Dékány, I.; Csapó, E. Reduction of Tetrachloroaurate(III) Ions With Bioligands: Role of the Thiol and Amine Functional Groups on the Structure and Optical Features of Gold Nanohybrid Systems.
Nanomaterials2019,9, 1229. [CrossRef] [PubMed]
35. Zheng, J.; Zhou, C.; Yu, M.; Liu, J. Different sized luminescent gold nanoparticles.Nanoscale2012,4, 4073–4083.
[CrossRef]
36. Peters, S.; Peredkov, S.; Neeb, M.; Eberhardt, W.; Al-Hada, M. Size-dependent XPS spectra of small supported Au-clusters.Surf. Sci.2013,608, 129–134. [CrossRef]
37. Adochitei, A.; Drochioiu, G. Rapid Characterization of Peptide Secondary Structure By Ft-Ir Spectroscopy.
Rev. Roum. Chim.2011,56, 783–791.
Crystals2020,10, 1113 15 of 15
38. Reed, J.; Reed, T.A. A set of constructed type spectra for the practical estimation of peptide secondary structure from circular dichroism.Anal. Biochem.1997,254, 36–40. [CrossRef]
39. Yang, T.Q.; Peng, B.; Shan, B.Q.; Zong, Y.X.; Jiang, J.G.; Wu, P.; Zhang, K. Origin of the photoluminescence of metal nanoclusters: From metal-centered emission to ligand-centered emission.Nanomaterials2020,10, 261.
[CrossRef]
Publisher’s Note:MDPI stays neutral with regard to jurisdictional claims in published maps and institutional affiliations.
©2020 by the authors. Licensee MDPI, Basel, Switzerland. This article is an open access article distributed under the terms and conditions of the Creative Commons Attribution (CC BY) license (http://creativecommons.org/licenses/by/4.0/).