Colloid and Interface Science Communications 46 (2022) 100564
2215-0382/© 2021 The Author(s). Published by Elsevier B.V. This is an open access article under the CC BY license (http://creativecommons.org/licenses/by/4.0/).
Rapid Communication
Self-assembly of delaminated layered double hydroxide nanosheets for the recovery of lamellar structure
Ad ´ el Szerlauth
a,b, Edina Balog
b, D ´ ora Tak ´ acs
a,b, Szil ´ ard S ´ aringer
a,b, G ´ abor Varga
b,c, G abor Schuszter ´
b,*, Istv ´ an Szil ´ agyi
a,b,*aMTA-SZTE Lendület Biocolloids Research Group, University of Szeged, H-6720 Szeged, Hungary
bDepartment of Physical Chemistry and Materials Science, University of Szeged, H-6720 Szeged, Hungary
cMaterial and Solution Structure Research Group, University of Szeged, H-6720 Szeged, Hungary
A R T I C L E I N F O Keywords:
Layered double hydroxide Nanosheet
Ordered restacking Self-assembly
A B S T R A C T
The aggregation mechanism of delaminated layered double hydroxide (dLDH) to form lamellar or even more complex nanostructures is revealed. It is found that dLDH nanosheets undergo ordered restacking via self- assembly upon salt induced aggregation within a short period of time. This first step is followed on longer term by the formation of house-of-cards-type aggregated clusters.
Lamellar inorganic nanostructures attracted widespread contempo- rary interest in liquid phase delamination processes as they are potential sources of unilamellar nanosheets and 2-dimensional graphene ana- logues [1–4] Among them, layered double hydroxides (LDHs) represent an important class of materials with a general formula of [M1−x2+Mx3+(OH)2]x+[Ax/nn-] ⋅ mH2O, where M2+and M3+stand for di- and trivalent metal ions, respectively, and An− can be a variety of intercalated charge compensating anions [5–7].
To enlarge their potential exploitation in the field of catalysis and materials science, the synthesis of porous and highly dispersed LDHs has become a priority [8]. Efforts were made to minimize the mass transfer limitations as well as to maximize the accessibility of the active sites on the surface of LDHs. However, conventionally synthesized, stone-like” hydrotalcites cannot be used because of their well-known hydrophilic nature, high affinity to aggregation, and high surface charge density [8,9]. To address these drawbacks, the long-range order of the stone-like LDHs have been systematically broken producing single layers of LDHs (dLDHs), i.e., positively charged platelets with a thickness of 1 − 2 nm during delamination processes [8,10]. Various polar solvents such as DMF [8], alcohols [11], and acrylates [12] are commercially applied as delamination medium. Regardless of the noticeably advances obtained, these methods were as of yet strongly limited to the significant product losses and their non-ecofriendly features. Moreover, these methods cannot ensure that dLDHs still remain exfoliated after drying. Accord- ingly, water- and aqueous-miscible solvent-based strategies have been
designed and developed. These methods facilitate the existence of exfoliated hydrotalcite layers in solid phase, however, they are two-step synthesis procedures and still involve the application of non-ecofriendly organic additives [13,14]. Recently, direct syntheses of dLDHs have already become possible without the solidification of stone-like LDH phase [15]. Such dLDHs were applied as building blocks of catalysists [16], photodetectors [17], anion adsorbers [14], and electrodes [18], and for the preparation of ultrathin films [19]. Therefore, the self- assembly-driven restacking mechanism of dLDHs either into ordered or random morphologies is extensively studied.
LDHs of various compositions were delaminated either in alcohols or in the presence of surfactants and restacked by the evaporation or po- larity change of the solvent [20]. The investigation of the recovered solid LDH particles revealed that the evaporation conditions determine the product morphology [21]. In general, restacking can be achieved by the addition of multivalent anions [11,22]. However, borate modified dLDHs remained delaminated upon drying after an appropriate aqueous miscible organic solvent treatment [9]. Such a dLDH powder can be a promising source for large scale production of unilamellar nanosheets.
Despite the above delamination–restacking studies, in which the products were characterized mainly in solid state, there is a lack of comprehensive investigation on such processes in colloid systems. Given the fact that application of dLDHs usually takes place in liquid media, aggregation mechanism and corresponding dispersion stability are major issues, which were explored, to the best of our knowledge, only in
* Corresponding authors at: Department of Physical Chemistry and Materials Science, University of Szeged, H-6720 Szeged, Hungary.
E-mail addresses: schuszti@chem.u-szeged.hu (G. Schuszter), szistvan@chem.u-szeged.hu (I. Szil´agyi).
Contents lists available at ScienceDirect
Colloid and Interface Science Communications
journal homepage: www.elsevier.com/locate/colcom
https://doi.org/10.1016/j.colcom.2021.100564
Received 21 September 2021; Received in revised form 12 November 2021; Accepted 29 November 2021
one report so far [23]. It was concluded that with increasing salt con- centration, the surface charge of the dLDHs decreases which causes particle aggregation. Furthermore, the critical coagulation concentra- tion (CCC) drops with the increasing valence of the anions. Apart from this study on the aggregation of dLDHs, the orientation of the nanosheets and the morphology of the aggregates upon destabilization of dLDHs were not investigated in colloid dispersions to date.
Therefore, the aim of the present study is to explore the salt induced aggregation of dLDHs in dispersions produced via a simple aqueous synthetic route (see SI for the experimental procedure of dLDH disper- sion preparation) [15]. The colloidal behaviour is assessed in light scattering, turbidity, and zeta potential measurements, while the structure of the primary particles and their aggregates are revealed by X- ray diffractometry (XRD), atomic force (AFM) and transmission electron microscopy (TEM). The experimental details of the synthesis method and characterization protocols are given in SI. The effect of salt con- centration and reaction time on the morphology of the aggregates is clarified for the first time in aqueous dispersions.
The delaminated structure of dLDHs is confirmed by XRD measure- ments (see Fig. S1). No characteristic diffraction peak is detected in 2Θ
=5 − 50◦range indicating that the dispersion does not contain lamellar LDHs. Indeed, the reflections at 2Θ ≈61◦with Miller indices of (110) and (113) prove the formation of unilamellar dLDHs [11]. Calculated unit cell parameters are presented in SI.
To probe the mechanism of salt induced restacking and aggregation self-assembly, time resolved dynamic light scattering (DLS) measure- ments are carried out, in which the dLDH concentration is kept constant while that of NaCl is systematically varied. The results indicate that the time evolution of the average hydrodynamic radius strongly depends on the salt concentration (see Fig. 1A). At low ionic strength, the dispersion is stable, i.e., the average hydrodynamic radius is constant over time within experimental error. By increasing the electrolyte concentration beyond a system-dependent threshold, the time evolution of the hy- drodynamic radius can be divided in two distinct regimes. First, no change is observed within a short period whose length decreases with increasing electrolyte concentration. Second, the radius increases steeply after a threshold time denoted as critical coagulation time (CCT).
The change in the second phase after CCT is in line with the theory by Derjaguin, Landau, Vervey and Overbeek (DLVO) [24,25], which states that an increasing electrolyte concentration leads to the weakening of electrical double layer repulsion and to subsequent particle aggregation due to predominating van der Waals attraction. The slopes of the radii versus time plots beyond CCT first increase in conjunction with the increasing ionic strength and then become constant above a certain electrolyte concentration, which is also predicted by this theory.
However, no sensible explanation can be found in the literature for the existence of the first regime, i.e., the lag phase, before the CCTs. To understand the striking fact that, although aggregation must have already started by the addition of electrolyte, no size growth is detected by DLS, let us consider the following. DLS is appropriate for measuring only the hydrodynamic radii, i.e., the largest dimension of the scattering objects [26]. Therefore, in accordance with the measured data, no sig- nificant change should be detected upon restacking the nanosheets in an ordered fashion, since such a plate–plate orientation increases only the thickness, but does not contribute significantly to the lateral dimension (see the schematics in Fig. 1B). In aqueous solutions, the plate–plate restacking is driven by the solvent water molecules which bind the metal hydroxide nanosheets together via hydrogen bonds [9]. After the re- covery of their lamellar structure, i.e., after the CCTs, the LDHs randomly aggregate which leads to the prominent increase of the average hydrodynamic radius [27]. By increasing the ionic strength, the initial lag phase becomes shorter and completely disappears beyond 50 mM NaCl concentration.
The two distinct regimes with well-defined breakpoints are also observed when dLDH aggregation is studied via turbidity measurement (see Fig. S3), which has been proven earlier as a suitable tool to explore particle aggregation processes [28] and even to study the kinetics and mechanism of chemical precipitation [29,30]. After the initial steeply increasing part, a slighter change is detected in the turbidity at longer periods. Unlike DLS, turbidity measurement is sensitive to changes both in particle concentration and size even for not spherical objects. How- ever, if the particle size is small, higher colloid concentration is required to detect the cloudiness. Since the initial dLDH colloid dispersion is somewhat transparent due to the small size and concentration of the platelets, the initial turbidity increase upon adding the electrolyte is caused by the growing thickness and thus stronger light scattering of LDHs. The less steep turbidity increase in the second regime might originate from the formation of larger aggregates of house-of-cards structures. The situation is similar to that when chemical precipitation occurs in a highly supersaturated solution. In such scenario, nucleation is predominant until the reactant concentration drops and crystal growth becomes advanced. In this analogy, dLDHs are thought as re- actants to self-assemble to nuclei, i.e., LDHs, which then aggregate similarly to polynuclear crystal growth mechanism. Therefore, it is assumed that the two distinct regimes correspond to the oriented stacking and random aggregation, respectively. The threshold time separating the two regimes is denoted as CCT here as well. Similarly to the DLS results, the initial phase before the CCT becomes shorter at higher ionic strengths (see Fig. S3).
To highlight the synergy of turbidity and DLS results and to Fig. 1.Part A: Hydrodynamic radii of dLDH particles versus time measured by DLS at 10 mg/L particle concentration and different ionic strengths. Part B: The schematics of the restacking and aggregation mechanism.
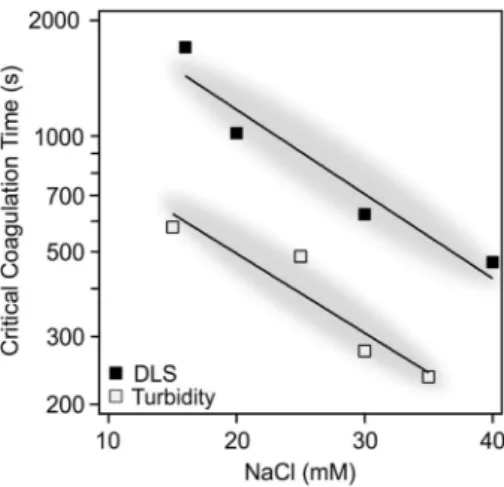
strengthen their interpretation, the trends obtained for CCTs by the two different methods are compared (see Fig. 2). Note, however, that the absolute CCTs are somewhat different. This might be because the turbidity measurement is less sensitive than DLS thus such experiments must have been performed at 200-times higher dLDH concentration.
Although aggregation could be expected at this high concentration, we recall that XRD measurements carried out with the same conditions indicated the absence of lamellar LDHs (Fig. S1). Nevertheless, CCTs determined by either method depict the same descending tendency at elevated ionic strengths, i.e., the exponents of the fitted exponential functions overlap within experimental error (− 0.051 ±0.004 for DLS and − 0.048 ±0.003 for turbidity). Such a result indicates similar ag- gregation mechanism in the dLDH dispersions.
To further confirm the above scenario, i.e., dLDHs first restack in an
ordered manner to form lamellar LDHs and then they aggregate, height profile assessment of the particles is carried out with AFM in a time resolved fashion. The dLDH suspension is sampled at selected times by dipping and then drying the AFM sample holder under ambient condi- tions. To obtain reliable data, the height of 15 particles is determined for each individual time step. In the absence of electrolyte, i.e., before the onset of stacking / aggregation, an average thickness of (1.75 ±0.25) nm is measured (Fig. S4A), which indicates that the particles consist of 1
− 2 layers only [15,16,31]. Once the electrolyte is added (30mM NaCl), restacking starts which results in growing nanosheet thickness over time (see Fig. S4). As an example, Fig. 3A shows the AFM record of particles 3 min after the addition of NaCl solution; the corresponding height pro- files are presented in Fig. 3B. It is found that the nanosheet thickness reaches (6.02 ±0.75) nm over this short period, i.e., it triples, while the lateral dimensions barely change (Fig. S4). Again, this observation co- incides with the DLS results presenting no significant change of the hydrodynamic radius during the first regime. In addition to that, the increase in LDH thickness at different reaction times is shown in the inset of Fig. 3A. The tendency obtained for the average height of the particles at selected times is linear within a short time interval, while the curve saturates at longer runs (see SI–S2.3 for more data). These results further prove our hypothesis, that is, the nanosheets first recover the lamellar structure of the conventional LDHs while restacking layer-by- layer upon salt induced aggregation. Thereafter, during the second regime, large aggregates appear as a result of random aggregation and subsequent formation of house-of-cards structures of dimensions up to (18.42 ±5.21) nm, as represented in Fig. S4D. Note that the onset time of aggregation, taking place after ordered restacking, determined either by DLS (Fig. 1A, yellow markers) or AFM (Fig. 3A) measurements is very similar, although significantly different parameters are followed.
The thickness of dLDHs determined by TEM imaging is in good agreement with the AFM measurements. The average TEM thickness of the nanosheets shown in Fig. S5 is (1.75 ±0.33) nm, while the lateral dimension is in the range of (130 ±30) nm. The TEM image of randomly aggregated LDHs recorded after 20 min reaction time depicts the pres- ence of flower-like motives (Fig. S6), which is similar to organic solvent treated LDHs reported elsewhere [32].
XRD measurements are also carried out at different time intervals with aggregating samples to confirm the formation of lamellar LDHs upon salt induced restacking of dLDHs. Considering the results (compare Fig. S1 and S2), no significant difference can be observed between the diffractograms of dLDHs recovered from a suspension containing no electrolyte and those obtained after 3 min aggregation time, since the small number of consecutive layers does not allow detecting any LDH- like reflections. However, after 10 and 20 min, the reflections corre- sponding to the lamellar LDH structure appear and the common LDH is recognized. Furthermore, the specific surface area obtained from BET analysis performed on nitrogen gas adsorption measurements decreases (210-, 45- and 30 m2/g after 3-, 10- and 20 min reaction time, respec- tively; see SI for details) during the aggregation process in agreement with the literature [32]. Clearly, the specific surface area is in correla- tion with the number of separated nanosheets. Free dLDHs represent high specific surface area, while their restacking into consecutive layers and later on the aggregation of LDHs shrink such value. Accordingly, nitrogen gas adsorption results are also in good agreement with the turbidity, DLS and AFM results discussed above. Each method approves the existence of a two-step mechanism, i.e., a layer-by-layer restacking is followed by and somewhat separated from the aggregation of lamellar structures. As mentioned above, increasing the ionic strength leads to shorter lag phase. At 50 mM NaCl concentration, no such initial stage is detected either by DLS or turbidity measurements which logically means that no dLDHs should be present in the dispersion. Indeed, XRD pattern recorded with such electrolyte concentration right after the initiation of the experiment shows clear LDH reflections (Fig. S2–D).
The colloidal stability of dLDH dispersions is also assessed by investigating the charging and aggregation behaviour of the particles in Fig. 2. CCTs as a function of NaCl concentration determined via DLS and
turbidity measurements. The vertical scale is logarithmic.
Fig. 3. AFM image of dLDHs 3 min after maintaining 30 mM NaCl concen- tration (A) and the height profiles related to the labelled particles (B). The inset shows the change in particle thickness as a function of reaction time based on the height profiles presented in Fig. S4.
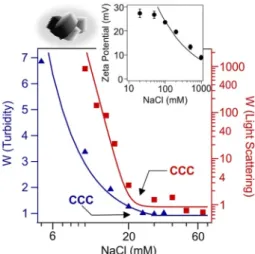
a wide range of electrolyte concentration. The zeta potential decreases by increasing the ionic strength due to the screening effect of the dis- solved salt constituents. However, it remains positive in the entire NaCl concentration regime investigated (see the inset of Fig. 4). The zeta potential values are fitted with the Gouy–Chapman model [33] which was developed for the description of the change in potentials in the electrical double layer at different ionic strengths (see SI for details).
This theory gives reliable estimate of the surface charge density at higher ionic strength, where friction forces are suppressed in electroki- netic experiments. According to the fit, a surface charge density of 18 mC/m2 is determined for dLDHs. This finding is in line with literature data obtained for LDHs in different electrolyte solutions [23,27,34] and further confirms that the restacking process leads to the formation of conventional LDH structures.
Finally, to assess the resistance of dLDH colloids against salt induced aggregation, time resolved DLS and turbidity measurements are per- formed. Stability ratio, the inverse of whose is equal to the fraction of particle collisions which results in aggregation (see SI for details), determined at different ionic strengths using the two methods show very similar trends (see Fig. 4). At low electrolyte concentrations, stable colloids form. Beyond the CCC, the dispersion becomes unstable indi- cated by stability ratios close to one. In this case the aggregation is controlled solely by the diffusion of particles. The CCCs determined in turbidity (16 mM) and DLS (20 mM) measurements are in good agree- ment. Such a tendency in the colloidal stability of the dLDH–NaCl samples is in qualitative agreement with the predictions of the DLVO theory implying the presence of interparticle forces of electrostatic origin similar to other LDH–electrolyte systems [23,27,34]. Note that non-DLVO interactions such as short-ranged forces originating from the hydration and the roughness of the surfaces may be present [35], however, we do not have experimental evidence to underpin this assumption.
In conclusion, the salt induced self-assembly-driven restacking and aggregation mechanism of dLDHs is investigated in aqueous dispersions.
At low electrolyte concentration and for a short period of time, dLDHs stack together in plate–plate orientation giving rise to the recovery of conventional LDH nanostructure, while particle thickness linearly scales with time. Once the lamellar structure is formed, the LDHs aggregate and house-of-cards structures grow. The initial stacking regime becomes shorter upon increasing the electrolyte concentration and even disap- pears at high enough ionic strength. The results of morphological and
structural studies are in good agreement with the findings obtained in colloidal dispersions. Overall, the restacking mechanism of unilamellar dLDHs is explored in aqueous dispersions for the first time. We also highlight the possibility that a commercial UV–Vis photometer can be used to reliably determine some properties of colloid dispersions (e.g., critical coagulation time and stability ratio).
Declaration of Competing Interest There are no conflicts to declare.
Acknowledgment
This work was supported by the Hungarian National Research, Development and Innovation Office through the grant SNN131558.
Appendix A. Supplementary data
Supplementary data to this article can be found online at https://doi.
org/10.1016/j.colcom.2021.100564.
References
[1] J.N. Coleman, M. Lotya, A. O’Neill, S.D. Bergin, P.J. King, U. Khan, K. Young, A. Gaucher, S. De, R.J. Smith, I.V. Shvets, S.K. Arora, G. Stanton, H.Y. Kim, K. Lee, G.T. Kim, G.S. Duesberg, T. Hallam, J.J. Boland, J.J. Wang, J.F. Donegan, J.
C. Grunlan, G. Moriarty, A. Shmeliov, R.J. Nicholls, J.M. Perkins, E.M. Grieveson, K. Theuwissen, D.W. McComb, P.D. Nellist, V. Nicolosi, Science 331 (2011) 568–871.
[2] K. Varoon, X.Y. Zhang, B. Elyassi, D.D. Brewer, M. Gettel, S. Kumar, J.A. Lee, S. Maheshwari, A. Mittal, C.Y. Sung, M. Cococcioni, L.F. Francis, A.V. McCormick, K.A. Mkhoyan, M. Tsapatsis, Science 333 (2011) 72–75.
[3] S.L. Zhang, Q.F. Liu, Y.J. Yang, H. Zhang, J.J. Liu, S.S. Zeng, A.M. LaChance, A.
T. Barrett, L.Y. Sun, Chem. Commun. 57 (2021) 789–792.
[4] V. Dudko, K. Ottermann, S. Rosenfeldt, G. Papastavrou, J. Breu, Langmuir 37 (2021) 461–468.
[5] P.J. Sideris, U.G. Nielsen, Z.H. Gan, C.P. Grey, Science 321 (2008) 113–117.
[6] Z.B. Cao, B. Li, L.Y. Sun, L. Li, Z.P. Xu, Z. Gu, Small Methods 4 (2019) 1900343.
[7] S. Livi, V. Bugatti, L. Estevez, J. Duchet-Rumeau, E.P. Giannelis, J. Colloid Interface Sci. 388 (2012) 123–129.
[8] J.F. Yu, Q. Wang, D. O’Hare, L.Y. Sun, Chem. Soc. Rev. 46 (2017) 5950–5974.
[9] Q. Wang, D. O’Hare, Chem. Commun. 49 (2013) 6301–6303.
[10] Y.Y. Wang, C. Xie, Z.Y. Zhang, D.D. Liu, R. Chen, S.Y. Wang, Adv. Funct. Mater. 28 (2018) 1703363.
[11] Q.L. Wu, A. Olafsen, O.B. Vistad, J. Roots, P. Norby, J. Mater. Chem. 15 (2005) 4695–4700.
[12] S. O’Leary, D. O’Hare, G. Seeley, Chem. Commun. (2002) 1506–1507.
[13] T. Hibino, Chem. Mater. 16 (2004) 5482–5488.
[14] C.A. Antonyraj, P. Koilraj, S. Kannan, Chem. Commun. 46 (2010) 1902–1904.
[15] Y.P. Zhang, H.P. Li, N. Du, R.J. Zhang, W.G. Hou, Colloid Surf. A-Physicochem.
Eng. Asp. 501 (2016) 49–54.
[16] F. Song, X.L. Hu, Nat. Commun. 5 (2014) 4477.
[17] T.K.N. Nguyen, N. Dumait, F. Grasset, S. Cordier, D. Berthebaud, Y. Matsui, N. Ohashi, T. Uchikoshi, ACS Appl. Mater. Interfaces 12 (2020) 40495–40509.
[18] Z.J. Yuan, S.M. Bak, P.S. Li, Y. Jia, L.R. Zheng, Y. Zhou, L. Bai, E.Y. Hu, X.Q. Yang, Z. Cai, Y.M. Sun, X.M. Sun, ACS Energy Lett. 4 (2019) 1412–1418.
[19] L. Li, R.Z. Ma, Y. Ebina, N. Iyi, T. Sasaki, Chem. Mater. 17 (2005) 4386–4391.
[20] J.T. Rajamathi, N. Ravishankar, M. Rajamathi, Solid State Sci. 7 (2005) 195–199.
[21] F. Leroux, M. Adachi-Pagano, M. Intissar, S. Chauviere, C. Forano, J.P. Besse, J. Mater. Chem. 11 (2001) 105–112.
[22] S. Murath, Z. Somosi, I.Y. Toth, E. Tombacz, P. Sipos, I. Palinko, J. Mol. Struct.
1140 (2017) 77–82.
[23] W.Y. Yu, N. Du, Y.T. Gu, J.G. Yan, W.G. Hou, Langmuir 36 (2020) 6557–6568.
[24] B. Derjaguin, L.D. Landau, Acta Phys. Chim. 14 (1941) 633–662.
[25] F.J.M. Ruiz-Cabello, G. Trefalt, Z. Csendes, P. Sinha, T. Oncsik, I. Szilagyi, P. Maroni, M. Borkovec, J. Phys. Chem. B 117 (2013) 11853–11862.
[26] P.A. Hassan, S. Rana, G. Verma, Langmuir 31 (2015) 3–12.
[27] M. Pavlovic, P. Rouster, T. Oncsik, I. Szilagyi, ChemPlusChem 82 (2017) 121–131.
[28] M. Kobayashi, D. Ishibashi, Colloid Polym. Sci. 289 (2011) 831–836.
[29] N.P. Das, B. Müller, A. T´ oth, D. Horv´ ´ath, G. Schuszter, Phys. Chem. Chem. Phys. 20 (2018) 19768–19775.
[30] N.P. Das, R. Zahor´on, L. Janov´ak, A. De´ ´ak, A. T´ ´oth, D. Horvath, G. Schuszter, Cryst. ´ Growth Des. 20 (2020) 7392–7398.
[31] L. Li, Z. Gu, W.Y. Gu, Z.P. Xu, RSC Adv. 6 (2016) 95518–95526.
[32] C.P. Chen, A. Wangriya, J.C. Buffet, D. O’Hare, Dalton Trans. 44 (2015) 16392–16398.
Fig. 4. Zeta potential (top right corner) and stability ratio (W) of dLDHs. The latter one is determined in DLS (red square, right axis) and turbidity (blue triangle, left axis) measurements. The solid line in the zeta potential graph shows the potential values predicted by the Gouy–Chapman equation, while they are only eye guides in the stability ratio plots. (For interpretation of the references to colour in this figure legend, the reader is referred to the web version of this article.)
[33] G. Trefalt, I. Szilagyi, M. Borkovec, J. Colloid Interface Sci. 406 (2013) 111–120.
[34] M. Pavlovic, R. Huber, M. Adok-Sipiczki, C. Nardin, I. Szilagyi, Soft Matter 12 (2016) 4024–4033.
[35] Y. Diao, M. Han, J.A. Lopez-Berganza, L. Valentino, B. Marinas, R.M. Espinosa- Marzal, Langmuir 33 (2017) 8982–8992.