1
Granulometric characterization of paleosols in loess series by automated static image 1
analysis 2
3
György Varga1,*, János Kovács2,3, Zoltán Szalai1,4, Csaba Cserháti5, Gábor Újvári6 4
5
1Geographical Institute, Research Centre for Astronomy and Earth Sciences, Hungarian 6
Academy of Sciences, Budaörsi út 45, H-1112 Budapest, Hungary 7
2Department of Geology & Meteorology, University of Pécs, Ifjúság u. 6, H-7624 Pécs, 8
Hungary 9
3Environmental Analytical & Geoanalytical Research Group, Szentágothai Research 10
Centre, University of Pécs, Ifjúság u. 20, H-7624 Pécs, Hungary 11
4Department of Environmental and Landscape Geography (Institute of Geography and Earth 12
Sciences, Faculty of Science), Eötvös University, Pázmány Péter sétány 1/c, H-1117 Budapest, 13
Hungary 14
5Department of Solid State Physics, University of Debrecen, Bem tér 18/b, H-4026 Debrecen, 15
Hungary 16
6Institute for Geological and Geochemical Research, Research Centre for Astronomy and Earth 17
Sciences, Hungarian Academy of Sciences, H-1112 Budapest, Budaörsi u. 45., Hungary 18
19
*corresponding author; e-mail: varga.gyorgy@csfk.mta.hu 20
21 22 23
Abstract 24
25
2
An automated image analysis method is proposed here to study the size and shape of siliciclastic 26
sedimentary particles of paleosols of Central European loess sequences. Several direct and 27
indirect measurement techniques are available for grain size measurements of sedimentary 28
mineral particles. Indirect techniques involve the use of some kind of physical laws, however, 29
all requirements for calculations are in many cases not known. Even so, the direct manual 30
microscopic observation and measurement of large, representative number of grains is time- 31
consuming and sometimes rather subjective. Therefore, automated image analyses techniques 32
provide a new and perspective way to analyse grain size and shape sedimentary particles.
33
Here we test these indirect and direct techniques and provide new granulometric data of 34
paleosols. Our results demonstrate that grain size data of the mineral dust samples are strongly 35
dependent on shape parameters of particles, and shape heterogeneity was different of the 36
different size classes. Due to the irregular grain shape parameters, uncertainties have arisen also 37
for the sizes.
38
In this paper we present a possible correction procedure to reduce the differences among the 39
results of the laser diffraction and image analysis methods. By applying new correction factors, 40
results of the two approaches could be get closer but the most definite factor, the unknown 41
thickness of particles remained a problem to solve. The other presented method to assess the 42
uncertain 3rd dimension of particles by their intensity-size relationships makes us able to reduce 43
further the deviations of the two sizing methods.
44 45
Keywords: image analyses, particle shape, grain size, paleosols 46
47
Introduction 48
49
3
Determination of granulometric parameters has been a major focus of sedimentary studies and 50
is of growing interest in the Earth sciences (Vandenberghe et al., 2013, 2018; Újvári et al., 51
2016). There is a variety of instrumental techniques for the measurement of particle size. These 52
include sieve and pipette methods through laser scattering to image analysis of pictures taken 53
by optical or scanning electron microscopes. These various analytical methods are based on 54
different approaches to measuring particle size. In sieving, the second largest dimension is 55
measured as particles orientate themselves to optimally pass through the mesh, and grain size 56
distributions are calculated from the mass of particles within different size classes (Ludwick 57
and Henderson, 1968). Techniques based on the settling velocity of suspended particles assume 58
that larger/heavier particles settle more rapidly from suspension than smaller/lighter ones.
59
Particle size information of sedimentary deposits is usually determined by laser diffraction 60
devices. This is a robust method yielding much more accurate and reliable information on grain 61
size of windblown sediments than sieving or the gravimetrical methods (Konert and 62
Vandenberghe, 1997; Di Stefano et al., 2010; Fisher et al., 2017; Makó et al., 2017). However, 63
grain size data obtained with these measurements simply result from indirect estimations of 64
sphere equivalent diameters, as calculated from the acquired laser light scattering data using 65
mathematical transformations of different optical models (Fraunhofer and Mie theories).
66
Grain size characterization of irregular shaped three-dimensional sedimentary particles is a 67
complex problem. The size of such particles is approximated by using equivalent diameters, so 68
that the real irregular particle is replaced with an imaginary sphere or circle having similar 69
volume, surface or area (Fisher et al., 2017) . This means that sphere equivalent (SE) or circle 70
equivalent (CE) diameters are used instead of other size parameters. However, size description 71
of a non-spherical particle using simple indices (SE or CE diameter) consequently leads to 72
oversimplifications.
73
4
Not only size, but shape parameters of particles hold vital information on sedimentary transport 74
and deposition mechanisms and post-depositional, environment-related alterations (Mazzullo 75
et al., 1992; Pye, 1994). As the terms particle morphology, form and shape have been used in a 76
variety of ways in published papers (Benn and Ballantyne, 1993), here, particle shape includes 77
relative dimensions of particles, overall smoothness of particle outline and roughness.
78
Traditional image analysis techniques have been applied widely, however previously published 79
studies have been carried out on populations with much smaller number of particles compared 80
to automated analyses (e.g. Dellino and La Volpe, 1996; Bagheri et al., 2015; Liu, et al., 2015).
81
Measurement of particle shape is time-consuming (Tafesse et al., 2013). Automated static 82
image analysis is still uncommon and underexploited for particle size and shape distribution 83
analysis of sediments. The use of automated digital image analysis solves the issues generated 84
by low number of measured particles as it is more precise, less time-consuming and easier to 85
use compared with traditional methods (Baptista et al., 2012; Rodríguez et al., 2013; Campaña 86
et al., 2016). The average particle number of automated imaging amounts to ca. 104-106 87
particles, which allows us to gain statistically robust and objective insights into the 88
morphological characteristics of particles. Various size and shape parameters, as well as optical 89
intensity values of each particle, are routinely measured and number-size distributions can 90
easily be converted to volumetric distributions, thus the direct comparison with results obtained 91
by laser diffraction can be done. To date, only a few studies have been published on automated 92
image analyses of particle size and particle shape parameters of sedimentary deposits (Rubin, 93
2004; Graham et al., 2005; Warrick et al., 2009; Buscombe et al., 2010), and therefore much 94
uncertainty exists about the relationship between the different methods. Shang et al. (in press) 95
presented grain size and shape results obtained by dynamic image analysis of Chinese loess and 96
red clay samples.
97
5
In this study paleosols embedded in Central European loess sequences were investigated in 98
detail as they are the product of a complex depositional environment: granulometric 99
characteristics of paleosols are dependent on (1) the grain size properties of the underlying 100
windblown loess material from which the soil was formed; (2) post-depositional alteration 101
governed by the weathering intensity characteristic for the given interstadial/interglacial period;
102
and (3) possible syn-sedimentary dust material additions (and/or removal). However, it must be 103
emphasized that this study is not aimed at obtaining genetically meaningful sedimentary 104
interpretations of the samples, but instead (1) compares the grain size results obtained by widely 105
used laser diffraction technique and by a new, high-precision granulometric characterization 106
approach, namely automated static image analysis; (2) discusses the major differences and 107
underlying causes; and (3) identifies problematic issues of grain size and shape determinations 108
of the automated static image analysis technique.
109
Details of physicochemical environment of entrainments, transport, accumulation and post- 110
depositional alterations of sedimentary particles can partly be reconstructed using proxies of 111
grain size and various grain shape parameters (e.g. particle circularity, convexity, relative 112
lengths of orthogonal axes) of sediments (Weltje and Prins, 2007; Bokhorst, et al., 2011; van 113
Hatteren et al., in press; Schulte et al., in press; Schulte and Lehmkuhl, in press; Varga et al., in 114
press). This is especially true for well sorted aeolian dust deposits with a fairly narrow grain 115
size range in the silt fraction as a consequence of the selective nature of sediment transport by 116
wind (Pye, 1987). As terrestrial wind-blown deposits are among the most important archives of 117
past environmental changes, appropriate explanation and interpretation of proxy data is another 118
key issue (Varga et al., in press). Various aspects of aeolian sedimentation (wind strength, 119
source distance and transport modes, etc.) can be estimated from accurate grain size data. Huge 120
amounts of laser diffraction grain size data have accumulated over the past decades, to make 121
6
the comparison of new and more detailed image analysis-based granulometric information with 122
previous researches a comprehensive discussion of methodological differences is needed.
123 124
Materials and Methods 125
126
Geological setting and samples 127
128
Loess deposits cover more than half of the area of the Carpathian Basin in Central Europe 129
(Oches and McCoy, 1995; Marković et al., 2011, 2015; Újvári et al., 2014). Previous studies 130
revealed the complex paleoenvironmental development and depositional history of the last ca.
131
1 million years based on multi-proxy analyses of these excellent archives (Horváth and Bradák, 132
2014; Újvári et al., 2014; Marković et al., 2015). Changing climatic conditions of Pleistocene 133
glacial-interglacial periods were imprinted in windblown dust deposition and post-sedimentary 134
alterations of accumulated sequences. Increased dust flux of dry and cold glacials provided 135
material for the formation of typical loess deposits. The loess formation periods were 136
interrupted by soil development during moist and mild interglacials. While the geochemical 137
composition of loess deposits are fairly homogeneous, climatic and environmental conditions, 138
duration and intensity of soil forming intervals were more diverse than during glacials, leading 139
to a geochemically and sedimentary mixed pedostratigraphy of the region (Varga, 2015).
140
Pedogenesis during interglacials were even more complex, as we have to consider syngenetic 141
fine-grained dust addition from external source regions (e.g., from the Sahara) to the local 142
material during accretionary soil formation (Varga et al., 2016).
143
The persistent decreases in weathering intensity during interglacial intervals from the Early 144
Pleistocene to Holocene were preserved and manifested in different types of paleosols. The 145
7
Late and younger Middle Pleistocene loess deposits are intercalated by steppe, forest-steppe 146
and brown forest soils, while the older paleosols are reddish brown, rubified soils.
147
A generalized loess-paleosol sequence was set-up primarily based on the Paks loess section on 148
the right bank of River Danube in Hungary (N46° 38' 25" E18° 52' 36"), however, paleosol 149
units of MIS-5 were missing in this well-studied site (Újvári et al., 2014), reference samples for 150
the last interglacial period were collected from the Tamási section (Southwest Hungary, 151
Transdanubian Hills; N46° 37' 6" E18° 16' 32"). Nine representative samples were chosen for 152
detailed analyses from the sampled key pedostratigrahic units representing MIS-21 up to MIS- 153
5 interglacial periods (Fig 1). The MIS-13 and MIS-15 soils were excluded from sampling and 154
subsequent analyses because of their controversial stratigraphic position and truncated 155
appearance (Oches and McCoy, 1995; Horváth and Bradák, 2014; Újvári et al., 2014; Varga, 156
2015).
157 158
Samples pre-treatment and grain size measurements 159
160
All samples were chemically pre-treated before granulometric measurements by adapting the 161
widely used procedure described by Konert and Vandenberghe (1997). Three grams of 162
sediment were treated with 10 ml H2O2 (30%) and 10 ml HCl (10%) to oxidize organic matter 163
and dissolve carbonates before laser diffraction measurements. Subsequently, 10 ml of 3.6%
164
Na4P2O7·10H2O was also added to the samples, which were ultrasonicated during the analyses 165
in order to ensure particle disaggregation. There are two main reasons for carbonate removal:
166
(1) in loess sediments secondary calcite formation creates coatings among the particles 167
inhibiting the dispersion of individual grains; (2) separation of detrital and authigenic, post- 168
depositional carbonates is impossible.
169 170
8 Automated static image analysis procedure 171
172
Granulometric data and Raman spectra were obtained from automatic static image analysis of 173
Malvern Morphologi G3-ID (Malvern Instruments Ltd., UK), which is an advanced particle 174
characterization apparatus. This device allows thousands of particle shapes to be quantified in 175
a few hours and it has recently been used for quality control in the pharmaceutical and mining 176
industry (Kwan et al., 1999; Ulusoy and Kursun, 2011; Schneider and Marcini, 2013; Gamble 177
et al., 2014). Nevertheless, only a few studies have exploited image-based methods in 178
sedimentology so far, apart from preliminary studies designed to demonstrate its potential 179
(Altuhafi et al., 2012; Polakowski et al., 2014; Duval et al., 2015; Sochan et al., 2015; Campaña 180
et al., 2016; Nielsen et al., 2016; Polo-Díaz et al., 2016; Becker et al., in press).
181
In this study, ~7 mm3 of sedimentary particles were dispersed onto a flat glass slide with an 182
instantaneous (10 ms) pulse of 4 bar compressed air and 60 s settling time. Particle imaging 183
was conducted using the 20× magnification lens (960× magnification, 40 pixel per µm2 184
resolution) of the Morphologi G3-ID device and z-stacking was enabled (two layers above and 185
below the focal plane, equivalent to 27.5 μm in total).
186
Size and shape parameters of ~250,000 individual particles were automatically recorded by the 187
software of the Mavern Morphologi G3-ID device for each sample from the captured high- 188
resolution grayscale images. The most important granulometric parameter of the image analysis 189
based grain size measurements is the circle-equivalent (CE) diameter of the non-spherical, 190
irregular-shaped particles. This parameter is calculated as the diameter of a circle with the same 191
area as the projected two-dimensional particle image. The number-based grain size distribution 192
is calculated in MATLAB (version R2016a) by classification of every particle into 193
logarithmically-spaced size classes. Default size-bin allocation of Malvern Mastersizer was 194
chosen to these calculations to make the comparison of image analyses and laser diffraction 195
9
results more accurate and representative; particle size data are classified into 101 196
logarithmically spaced size-bins in the range between 0.01 and 3000 µm (the central value of 197
the ith size-bin = 0.0081e0.128i, where i=1:101). For transforming number-based distributions 198
into volume-based distributions CE diameter is used for the calculation of particles volume 199
(sphere-equivalent [SE] volume) as a weighting factor. The volume of a given size bin is 200
specified by weighting with the total SE volume of particles classed into this size range.
201
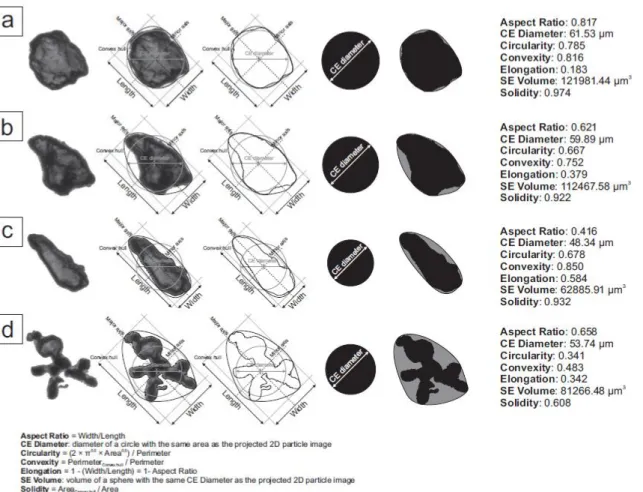
Length and width are estimated from major and minor axes of the particles (Malvern 202
Instruments Ltd., 2015). The major axis is calculated as a line through the centre of mass of the 203
two-dimensional projected image at an orientation corresponding to the minimum rotational 204
energy of the shape. The major axis parameter is the angle of the major axis from a horizontal 205
line, while the minor axis passes through at a right angle to the major axis. All perimeter points 206
of the object are projected onto the major axis (minor axis), and the longest distance between 207
the points is the length (width) of the particle as shown in Fig 2. Other simple grain size 208
parameters as particle area or perimeter can easily be determined using the acquired images.
209
Grain shape parameters provide additionally information apart from size. Aspect ratio is the 210
ratio of width and length, while elongation is 1-aspect ratio. The circularity parameter of a 211
particle describes the proportional relationship between the circumference of a circle equal to 212
the object’s projected area and perimeter. Convexity and solidity are determined using the 213
convex hull (theoretical rubber band wrapped around the particle – indicated as gray area on 214
Fig 2) of the two-dimensional images. Convexity is the ratio of perimeter of the convex hull to 215
the particle perimeter, while solidity is the ratio of the particle and convex hull areas; these are 216
parameters of the particle edge roughness.
217
Simultaneously, the mean grayscale intensity and standard deviation of particles were also 218
measured as the bottom light (diascopic) illumination transmits through the particles. White 219
light intensity of each pixel of particles is recorded on an 8-bit (28) scale from 0 to 255, where 220
10
intensity value of zero is white, 255 is black. The automatically recorded dimensionless values 221
serve as a proxy of optical properties. Mean intensity values are dependent on chemical 222
composition, mineralogy and particle thickness, while standard deviations of intensities are 223
controlled by the heterogeneity of particle constitution and surface morphology.
224
Chemical analysis was performed using the built-in Raman spectrometer of the Malvern 225
Morphologi G3-ID. Spectra were acquired from several hundreds of targeted individual 226
particles. These were compared with library spectra (BioRad-KnowItAll Informatics System 227
2017, Raman ID Expert) and correlation calculations were performed to determine the 228
mineralogy of the targeted sedimentary grains.
229
Image analysis-based measurements were organized into a number-based database. All of the 230
particles have their own identity number (ID) being the primary key in the data matrix. Each 231
row represents one particle and columns of the table are size and shape parameters. Large 232
numbers of measured particles ensure a statistically robust and objective insight into the 233
granulometric characteristics of the investigated samples.
234 235
Filtering out stacked particles and aggregates 236
237
Sometimes it can be noticed that particles are not individual grains (see Fig 2d), but are clumps 238
of particles by natural aggregation of single grains or by artificial stacking of particles during 239
dispersion onto the glass slide. Using the appropriate shape parameters, these compound objects 240
can be filtered out. Irregularly aggregated particles often cannot be excluded using only one 241
parameter. This is why previous studies also applied combinations of intensity and convexity 242
(Gamble et al., 2011); circularity and convexity (Leibreandt and Le Pennec, 2015), solidity and 243
convexity (Liu et al., 2015) to distinguish aggregated particles. As these previous papers were 244
dealing with microcrystalline cellulose and volcanic ash, morphologically significantly 245
11
different material than granular particles of paleosols of aeolian dust-derived loess series, in 246
this study, we applied a new combination of parameters to filter out stacked particles using 247
elongation (or its complementary, the aspect ratio) and circularity thresholds together. Captured 248
two-dimensional images of aggregated particles revealed that the perimeters of these rougher 249
objects are larger than that of individual grains with similar CE-diameter. This observation 250
formed the basis of application of convexity values in previous studies (Gamble et al., 2011;
251
Leibreandt and Le Pennec, 2015; Liu et al., 2015). However, perimeters of two-dimensional 252
projections of elongated particles can also be significantly higher than those of solid ones due 253
to circumferential pixels, so particles with low [<0.4] elongation (high [>0.4] aspect ratio) and 254
low circularity [<0.45] form a class representing stacked or aggregated grains.
255 256
Sufficient number of measured particles 257
258
Experiences with automated static image analysis by Malvern Morphologi G3-ID indicate that 259
scanning of ~7 mm3 of sedimentary samples on circular, 60 mm diameter areas of glass slides 260
provide shape and size parameter information on ~1-1.5 million particles. Since measurements 261
are time-consuming (average 6-hour measurement time per sample), the generated data-file 262
sizes are large and impractical, and for cost- and energy-efficiency reasons it seems important 263
to determine the particle number sufficient for a statistically representative granulometric 264
characterization. The large number of acquired grain images and obtained parameter data 265
allowed us to perform a subsampling experiment. Clusters with different numbers of randomly 266
selected particles were sub-sampled from a total of 1 million measured grains. Every sub- 267
sample clusters include the results of 100-step iterations of random particle selections.
268 269
Underestimation of the finest fractions by image analysis: a theoretical approach 270
12 271
The measured CE diameter in image analysis is calculated from the two-dimensional images of 272
particles. It is generally assumed that the instantaneous pulse of compressed air disperses the 273
sedimentary particles onto the glass slide with a consistent orientation with their largest area 274
facing to camera. However, this is only one outcome out of infinite possible projections of a 275
three-dimensional object. During measurements made by dynamic image analysis techniques 276
these kinds of particle orientation problems do not distort the results since freely falling particles 277
can rotate freely in all directions (Shang et al., in press).
278
To demonstrate and quantify this distortion, we modelled the deformation of two-dimensional 279
projected areas of randomly rotated, simple, theoretical three-dimensional geometric solids (Fig 280
3a). Shape parameters of the solids were quantified based on the edge-ratios, where x is the 281
longest edge and x>y>z. Platyness (z/y) and aspect ratios (y/x) were chosen from 0.1 to 1 (0.1, 282
0.5 and 1 combinations are presented in Fig 3b and Table 1), while the volume of the solids 283
was kept constant at 1 µm3. 284
The XY-plane projected areas are dependent on two major factors: (1) rotation angles (αx; αy);
285
and (2) shape parameters (edge-ratios) of the objects. To determine the effect of rotation angles 286
on projected areas, the αx and αy angles were modified from 0° to 179° and the projected areas 287
were calculated for every rotation angle-pairs. The mean value of the rotation-dependent XY- 288
plane projected areas is regarded as the orientation-averaged projected area representing 289
randomly oriented object (gray surface on Fig 3c).
290
The introduced CErot ratio is the quotient of the largest face area-based CE diameter (it is 291
assumed during the image analysis that this arbitrary orientation is set) and orientation-averaged 292
projected area-based CE diameter (the projected area of a randomly oriented particle). Larger 293
than 1 CErot ratio values denote that the image analysis-based measurement overestimates 294
particle size, while ratios <1 imply underestimation. These CErot ratios were calculated for every 295
13
possible aspect ratio-platyness combinations (Fig 4a). The displayed surface shows the level of 296
overestimation as a function of shape parameters (orientation-averaged projected area). The 297
higher the anisotropy of particles is, the higher the chance of overestimation of image analysis- 298
based grain size measurement is.
299
Volume-based distribution curves were derived from the number-based database by weighting 300
the individual particles with their sphere-equivalent volume, this assumption of spherical shape 301
leads to further distortion of the results. Another correcting factor, the so-called CE/SE ratio 302
was also introduced to reduce this inaccuracy of exchange transformation from number- to 303
volume-based distribution functions, where SE diameters are equal for all modelled objects (as 304
the volume of all these solids were defined as 1 µm3). Similarly to CErot ratios, CE/SE ratios 305
were specified for every possible aspect ratio-platyness combinations (Fig 4b), so mathematical 306
relationships among the shape and rotation determined factors and aspect ratio-platyness values 307
were assessed.
308
Aspect ratio of every single particle is known, which allowed us to get a more accurate 2- 309
dimensional representation of 3-dimensional particles, only the particle thickness need to be 310
estimated and the CErot and CE/SE correction factors can be determined for every investigated 311
particles.
312 313
Assessment of the 3rd dimension of particles: intensity based thickness assessment 314
315
As a direct consequence of the previously discussed uncertainties, the major drawback of static 316
automated image analysis is the unknown thickness of particles. To get an approximate 317
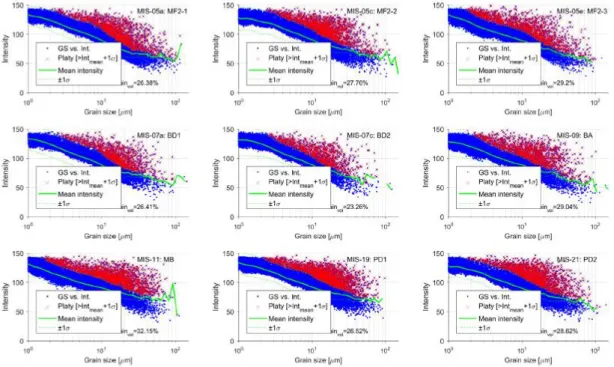
estimation of the third-dimension, mean intensity values of the captured grayscale images were 318
analysed in a completely novel way. Light transmission of sedimentary particles is influenced 319
by thickness beyond mineral composition and colour. For this intensity based thickness 320
14
estimation method, average intensity values for all (n=101) grain size classes were determined 321
and particles with an intensity being larger than the sum of their class intensity mean and 322
standard deviation [Intparticle-IDi > mean(IntGSbin-jth) + σ(IntGSbin-jth), where Intparticle-IDi is the 323
intensity of ith particles from the jth size class, mean(IntGSbin-jth) and σ(IntGSbin-jth) are the 324
average and standard deviation of the size class j] were classified as thinner (or flatter) than 325
average (‘platy’) particles (Fig. 5). Later this classification of platy and more spherical particles 326
was used during the mathematical adjustment with different assumptions for the 3rd dimension 327
anisotropy (z/y: normal distribution for more spherical grains; z/y<0.1 for platy) 328
329
Laser diffraction 330
331
Additional grain size measurements were done using a Malvern Mastersizer 3000 laser 332
diffraction device with Hydro LV unit to compare the new image analysis measurements with 333
a widely used, traditional technique. There is a huge amount of published laser diffraction grain 334
size data, however, only some of the research papers mention the drawbacks of these technique.
335
In the case of middle and coarse silt-sized particles, majority of light is scattered by diffraction 336
(the diffracted light has high intensity and low angle), while smaller particles refract and absorb 337
more efficiently resulting a low intensity and wide angle scattered light. The acquired signal is 338
transformed by the laser device software into particle size distribution data by using the 339
Fraunhofer or the Mie scattering theory. Fraunhofer approximation is a simplified approach and 340
the knowledge of refractive index and absorption coefficient is not required, since it is assumed 341
that the measured particles are relatively large (over 25-30 µm – about 40 times larger than the 342
wavelength of the laser light) and opaque. More accurate particles size data can be gained by 343
applying the Mie theory, however, as it is a solution for Maxwell's electromagnetic field 344
equations the knowledge of optical properties (refractive index and absorption coefficient 345
15
[imaginary part of the complex refractive index]) of the sample and the dispersant is needed.
346
Due to these reasons, Mie optical model provide more accurate data on the amount of smaller 347
particles (clay and fine silt). As the knowledge of mineralogy-related optical properties is a 348
mandatory for scattered light data to particle size Mie-transformations, bulk mineralogical 349
composition of sediments was estimated from XRD data.
350
Previous XRD measurements of aeolian dust deposits in the Carpathian Basin indicated that 351
quartz (~30-60%), 10Å phases (illite±muscovite±biotite: 20-30% in loess and 10-20% in 352
paleosol), carbonates and 14Å phases (smectite±vermiculite±chlorite) were the dominant 353
(Nemecz et al., 2000; Újvári et al., 2014). Bulk mineral composition data was used to assess 354
the optimal optical settings of laser diffraction measurements to calculate grain size 355
distributions by using the mineralogy-dependent complex refractive index: 1.54-0.1i for the 356
sedimentary samples and 1.33 Ri for the dispersant water (Özer et al., 2010).However, due to 357
the polymineral composition and dependence of absorption coefficient on particle shape and 358
surface roughness, some additional calculations were made with the combination of various 359
refractive indices (Ri: 1.45-1.6) and absorption coefficients (Ac: 0.01-1).
360 361
Scanning electron microscopy 362
363
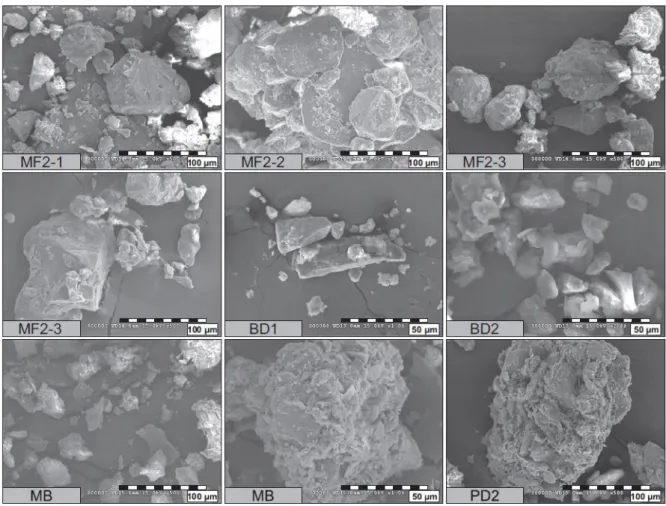
Hitachi S-4300 CFE Scanning Electron Microscope (SEM) micrographs were taken to 364
document and illustrate the shape and size variability of grains. SEM uses a focused beam of 365
electrons to create magnified images being both high contrast and extremely sharp, and 366
therefore suitable for particle surface morphology characterization. Previous studies reported 367
that size and shape of individual particles can be accurately assessed by image analysis software 368
and it is considered as a direct and absolute measure of particle size (Francus, 1998; Fandrich 369
et al., 2007). In this paper, several tens of mineral particles per sample were pictured (with 370
16
magnification from 400× to 2000×) by SEM to confirm the notable irregular shape and 371
anisotropy of 3rd dimension (thickness) of some particles.
372 373
Results 374
375
Image analysis 376
377
The acquired images of an average of 250,000 mineral particles per samples allowed us to 378
calculate robust number- and volume-weighted size and shape distribution curves. Here, the 379
grain size and intensity distributions are presented as both number and volume-based 380
distributions, while other shape parameters are reported only as volume-weighted due to the of 381
low-resolution of acquired images in the submicron fraction (<40 pixel) affecting the exact 382
determination of particle perimeter (Fig 6 and Table 2).
383
Size and shape parameters of samples as well as their intensity values exhibit pretty similar 384
general characteristics for the bulk, full grain size spectrums. The number size distributions 385
have a general bimodal nature with a pronounced submicron peak and an additional one 386
between 8 and 10 µm (Fig 6a). By contrast, the volume based CE diameter distributions are 387
characterized with unimodal curves (closely log-normal distributions) with coarse silt-sized 388
modal diameter values (40-60 µm) (Fig 6b).
389
As a logical consequence of number-based approach, most of the particles fall into the 390
submicron fractions with high grayscale intensity values (due to their opacity) as it is reflected 391
by the remarkable peak of the number-based intensity curve around the adjusted grayscale 392
threshold of 144, what was selected to distinguish background from the mineral particles (Fig 393
6c). Applying the volume-transformations by weighting the particles with their SE volume, the 394
modal values were found in the darker range of grayscale intensity of 50 to 80 (Fig 6d).
395
17
General patterns of circularity and convexity distributions are resembling, both of these curves 396
have a slight positive skewness (circularity: 1.2-2.3; convexity: 1.4-2.4) and modal values 397
between 0.6 and 0.7 with tails extending towards more circular and convex shape directions 398
(Fig 6e,f). Solidity of the mineral grains exhibits a rather homogeneous character with a clear 399
positive skewness (3.1-4.5) and fairly high (>0.95) modus (Fig 6g). Aspect ratios, being the 400
ratios of width and length values, range dominantly between 0.7 and 0.9 (Fig 6h).
401
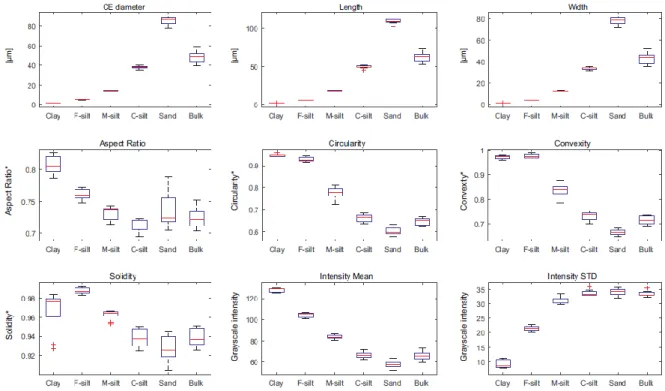
Granulometric parameters of selected size fractions were also analysed. Size and shape 402
properties of clay (<2.00 µm), fine (2.00-6.25 µm), medium (6.25-20.00 µm) and coarse silt 403
(20.00-62.50 µm) as well as of sand (larger than 62.5 µm) size particle classes were separately 404
determined. A general granulometric heterogeneity was identified towards larger size fractions, 405
so larger particles have a more irregular shape character than the finer ones. This heterogeneity 406
is especially well expressed for circularity and convexity with mean values decreasing from 407
0.95-0.97 to 0.64-0.71 from the clay to sand fractions. Similar, but not so obvious trends could 408
be observed for the aspect ratio and solidity parameters. However, the aspect ratio values were 409
fairly low even for the clay-sized grains (~0.78-0.8), translating to a 20-25% difference between 410
particle length and width (Fig 7; Table 3).
411
Structural fingerprint analyses by Raman spectrometry aided mineral identifications. Due to the 412
relatively low number of interpretable spectra, special focus was given to the main components 413
of the samples studied (30-120 µm quartz and feldspar grains). Size and shape parameters of 414
these particle-clusters displayed similar main characteristics. All of the previously introduced 415
parameters were found to be almost identical, only the mean intensities of quartz grains were 416
biased towards lighter values compared to feldspars (Table 4).
417
Irregularity and heterogeneous shapes of sedimentary particles could undoubtedly be observed 418
on the obtained SEM micrographs of bulk samples (Fig 8.). Acquired images also revealed 419
several fracture faces, V-shaped percussion marks, linear steps, and conchoidal crushing 420
18
features on the grain surfaces. [According to Pye and Sperling (1983), Liu et al. (1985), Pye 421
(1995), Lu et al. (2001) and Wright et al. (2011) this kind of morphological properties of silt- 422
sized mineral grains are only characteristics of aeolian dust particles. Such microtextures 423
together with the macroscopic characteristics of the silt classes indicate that these particles were 424
primarily transported and deposited by wind, post-depositional alterations formed soils from 425
this parent material.] The presence of fine-grained platy particles with significant 3rd 426
dimensional anisotropy due to their thinness was also confirmed. However, the quantification 427
of this anisotropy proved to be impossible using these images. Nevertheless, it is clear that 428
thickness/width ratios are by orders of magnitude smaller than width/length ratios of some 429
particles.
430 431
Laser diffraction 432
433
Laser diffraction grain size measurements resulted in silt dominated, positively skewed 434
(asymmetry towards the coarse fractions), unimodal distribution curves with minor, yet 435
remarkable contribution of clay and fine-sand particles. The fine-grained tail into the direction 436
of clay and fine silt fractions, beside the prominent maximum of medium- and coarse-silt 437
components, is typical for aeolian dust deposits and paleosols intercalated in loess sequences.
438
By using different complex refractive index values for grain size distribution measurements, 439
the coarse silt-sized primary modes were not modified, however significant changes could be 440
identified in the volumetric amount of clay and fine silt fractions (Fig 9).
441 442
Discussion 443
444
Sufficient number of measured particles 445
19 446
It was found that, depending on the parameter itself, different particle numbers provide different 447
representations of a sediment sample (Fig 10). For volume-based CE diameter distributions, the 448
analyses of more than 50,000 particles are required to reach R2=0.9 between the total sample 449
and the subpopulation (Fig 10a). However, since there is a cubic relationship between particle 450
diameter and volume, even a small number of large (coarse silt and sand) particles is able to 451
significantly modify the coarse grained tail of the grain size distribution. This apparent 452
modification of the distribution curve cannot be easily quantified due to the logarithmic 453
allocation of grain size bins. To get a more robust representation of grain size of polydisperse 454
samples (particle sizes covering several orders of magnitude, e.g., submicron to some few 455
hundred microns of aeolian dust deposits), several millions of scanned mineral particles would 456
be necessary. At the same time, intensity or some shape parameters can be assessed fairly well 457
using the results of only a few thousand particles (Fig 10b,c).
458 459
Underestimation of the finest fractions by image analysis: a theoretical approach 460
461
Image analysis grain size results indicated underestimation of clay and fine silt fractions 462
compared to laser diffraction measurements, while the modal values of the coarse silt (or fine 463
sand) fraction were found to be higher than those obtained by laser particle sizing.
464
By using CErot ratio and CE/SE corrections, the image analysis curves can be translated by a 465
vector parallel to the x-axis by 10-15% assuming a normal distribution of thickness values.
466
Based on the SEM images and general character of clay-minerals, this latter assumption of 467
normally distributed thickness values brings an obvious source of error into this correction 468
process. By extending the modelling process towards thinner particles (with z/y ratios 0.01- 469
0.09), the CErot ratio could result in more than a 50% correction on platy particle sizes.
470
20 471
Combined application of modelled correction factors and intensity based thickness assessment 472
473
Grain size and total volume of platy (more anisotropic) grains can be regarded as significantly 474
overestimated as demonstrated by the previously deduced CErot (rotation averaged) ratio and 475
CE/SE correction factor. The flatter than average particles were classified originally into larger 476
grain size bins which therefore have an overestimated volume. Comparison of volumetric 477
amount of bulk samples and particles classified based on intensities as ‘platy’ and ‘spherical’
478
are shown in Fig 11. The introduced correction factors, even with the assumption of a normal 479
distribution of particle thicknesses, are capable of making the CE diameters better converged, 480
but unable to explain the larger size values themselves. The volumetric amount of more platy 481
particles (especially clay minerals) is the most uncertain factor in these calculations, as a 482
consequence of their significantly higher 3rd dimension anisotropy compared to the quartz and 483
feldspar grains.
484
By applying the CErot ratio and CE/SE correction factor adjustment for the platy and spherical 485
particles with different assumptions for the 3rd dimension anisotropy (z/y: normal distribution 486
for spherical grains; <0.1 for platy), the results of laser diffraction and image analysis 487
measurements are in better agreement, i.e., their correlation coefficients are higher compared 488
to the original, mathematically “untreated” results.
489 490
Conclusions 491
492
Granulometric investigations of Pleistocene interglacial paleosols intercalated into loess 493
sequences in the Carpathian Basin revealed the major discrepancies in results obtained by the 494
two different measurement techniques applied. The data acquired by widely used, indirect laser 495
21
diffraction and direct observations by automated image analysis provided complementary, but 496
different information on grain size. While the particle size distributions provided by laser 497
diffraction measurements are dependent on the complex refractive index of a given particle 498
(which can only be approximated in case of polymineral samples) assuming a spherical shape, 499
the image analysis techniques are based simply on the direct, optically-acquired images of 500
grains.
501
Comparisons of measured grain sizes indicated that the fine populations are consistently and 502
significantly underestimated by the image analysis technique compared to laser scattering 503
results. Modelling data demonstrate that the anisotropic character of irregular particles, 504
especially the thickness of platy minerals, are responsible for the observed disagreements. The 505
acquired two-dimensional images of dispersed particles sitting with their largest area on the 506
glass slide were classified into grain size bins being too large based on their circle-equivalent 507
diameter. In addition, their volumetric-weighting scores (sphere-equivalent volume derived 508
from the CE diameter) were also found to be too high in volume-based conversions.
509
Consequently, this led to overestimation of particle sizes and volumetric amounts of wrongly 510
classified platy grains due to the cubic relationship. Application of the rotation averaged and 511
SE/CE ratios as correction factors successfully reduces the discrepancies between results 512
obtained by the two approaches. Nevertheless, the most definite factor, the unknown thickness 513
of particles still remains an unresolved problem. The other presented innovative way of 514
estimating the uncertain 3rd dimension of particles using their intensity-size relationships allows 515
us to further minimize deviations between the two particle sizing methods.
516
However, since particle sizes of paleosols covering several orders of magnitude, even a small 517
number of coarse grains can modify significantly the grain size distribution curves in the larger 518
fractions distorting the whole measurement spectrum, and so the full agreement between laser 519
diffraction and image analysis results cannot be reached.
520
22
There are discrepancies of these above discussed methods, but these can be handled by deeper 521
understanding of physical background of them. Optical dependence of laser diffraction 522
measurements should be investigated in the future, while the thickness-related uncertainties of 523
image analysis must also be studied by further studies. All in all, there are uncertainties 524
connected to both approaches, however, these two methods can be important complements of 525
each other, providing a useful tool to decipher valuable sedimentary information from 526
granulometric data of various deposits.
527 528
Acknowledgement 529
530
Support of the National Research, Development and Innovation Office NKFIH K120620 (for 531
G. Varga) and K120213 (for J. Kovács) are gratefully acknowledged. It was additionally 532
supported (for G. Varga) by the Bolyai János Research Scholarship of the Hungarian Academy 533
of Sciences.
534 535
References 536
537
Altuhafi, F., O'Sullivan, C., Cavarretta, I., 2013. Analysis of an image-based method to quantify 538
the size and shape of sand particles. Journal of Geotechnical and Geoenvironmental 539
Engineering 139, 1290-1307.
540
Bagheri, G.H., Bonadonna, C., Manzella, I., Vonlanthen, P., 2015. On the characterization of 541
size and shape of irregular particles. Powder Technology, 141-153.
542
Baptista, P., Cunha, T.R., Gama, C., Bernardes, C., 2012. A new and practical method to obtain 543
grain size measurements in sandy shores based on digital image acquisition and processing.
544
Sedimentary Geology 282, 294-306.
545
23
Becker, L.W.M., Hjelstuen, B.O., Støren, E.W.N., Sejrup, H.P., in press. Automated counting 546
of sand-sized particles in marine records. Sedimentology.
547
Benn, D.I., Ballantyne, C.K., 1993. The description and representation of particle shape. Earth 548
Surface Processes and Landforms 18, 665-672.
549
Buscombe, D., Rubin, D.M., Warrick, J.A., 2010. A universal approximation of grain size from 550
images of noncohesive sediment. Journal of Geophysical Research: Earth Surface 115, F02015.
551
Campaña, I., Benito-Calvo, A., Pérez-González, A., Bermúdez de Castro, J.M., Carbonell, E., 552
2016. Assessing automated image analysis of sand grain shape to identify sedimentary facies, 553
Gran Dolina archaeological site (Burgos, Spain). Sedimentary Geology 346, 72-83.
554
Dellino, P., La Volpe, L., 1996. Image processing analysis in reconstructing fragmentation and 555
transportation mechanisms of pyroclastic deposits. The case of Monte Pilato-Rocche Rosse 556
eruptions, Lipari (Aeolian islands, Italy). Journal of Volcanology and Geothermal Research 71, 557
13-29.
558
Di Stefano C, Ferro V, Mirabile S., 2010. Comparison between grain-size analyses using laser 559
diffraction and sedimentation methods. Biosystems Engineering 106, 205-215.
560
Duval, M., Campana, I., Guilarte, V., Miguens, L., Iglesias, J., Sierra, S.G., 2015. Assessing 561
the uncertainty on particle size and shape: Implications for ESR and OSL dating of quartz and 562
feldspar grains. Radiation Measurements 81, 116-122.
563
Fandrich, R., Gu, Y., Burrows, D., Moeller, K., 2007. Modern SEM-based mineral liberation 564
analysis. International Journal of Mineral Processing 84, 310-320.
565
Fisher, P., Aumann, C., Chia, K., O'Halloran, N., Chandra, S., 2017. Adequacy of laser 566
diffraction for soil particle size analysis. PLoS ONE 12, 0176510 567
Francus, P., 1998. An image-analysis technique to measure grain-size variation in thin sections 568
of soft clastic sediments. Sedimentary Geology 121, 289-298.
569
24
Gamble, J.F., Chiu, W.S., Tobyn, M., 2011. Investigation into the impact of sub-populations of 570
agglomerates on the particle size distribution and flow properties of conventional 571
microcrystalline cellulose grades. Pharmaceutical Development and Technology 16, 542-548.
572
Gamble, J.F., Ferreira, A.P., Tobyn, M., DiMemmo, L., Martin, K., Mathias, N., Schild, R., 573
Vig, B., Baumann, J.M., Parks, S., Ashton, M., 2014. Application of imaging based tools for 574
the characterisation of hollow spray dried amorphous dispersion particles. International Journal 575
of Pharmaceutics 465, 210-217.
576
Graham, D.J., Rice, S.P., Reid, I., 2005. A transferable method for the automated grain sizing 577
of river gravels. Water Resources Research 41, 1-12.
578
Konert, M., Vandenberghe, J., 1997. Comparison of laser grain size analysis with pipette and 579
sieve analysis: A solution for the underestimation of the clay fraction. Sedimentology 44, 523- 580
535.
581
Kwan, A.K.H., Mora, C.F., Chan, H.C., 1999. Particle shape analysis of coarse aggregate using 582
digital image processing. Cement and Concrete Research 29, 1403-1410.
583
Leibrandt, S., Le Pennec, J.L., 2015. Towards fast and routine analyses of volcanic ash 584
morphometry for eruption surveillance applications. Journal of Volcanology and Geothermal 585
Research 297, 11-27.
586
Lisiecki, L., Raymo, M.E., 2005. A Pliocene–Pleistocene stack of 57 globally distributed 587
benthic δ18O records. Paleoceanography 20, PA1003. DOI: 10.1029/2004PA001071 588
Liu, E.J., Cashman, K.V., Rust, A.C., 2015. Optimising shape analysis to quantify volcanic ash 589
morphology. GeoResJ 8, 14-30.
590
Lu, H., Vandenberghe, J., 2001. Aeolian origin and palaeoclimatic implications of the 'Red 591
Clay' (north China) as evidenced by grain-size distribution. Journal of Quaternary Science 16, 592
89-97.
593
25
Ludwick, J.C., Henderson, P.L. 1968. Particle shape and inference of size from sieving.
594
Sedimentology 11, 197-235.
595
Makó, A., Tóth, G., Weynants, M., Rajkai, K., Hermann, T., Tóth, B., 2017. Pedotransfer 596
functions for converting laser diffraction particle-size data to conventional values. European 597
Journal of Soil Science 68, 769-782.
598
Malvern Instruments Ltd., 2015. Morphologi G3 User Manual. Malvern, United Kingdom, 268 599
600 p.
Mazzullo, J. M., Alexander, A., Tieh, T., Menglin, D., 1992. The effects of wind transport on 601
the shapes of quartz silt grains. Journal of Sedimentary Petrology 62, 961-971.
602
Nemecz, E., Pécsi, M., Hartyáni, Z., Horváth, T., 2000. The origin of the silt size quartz grains 603
and minerals in loess. Quaternary International 67-71, 199-208.
604
Nielsen, P.R., Dahl, S.O., Jansen, H.L., Støren, E.N., 2016. Holocene aeolian sedimentation 605
and episodic mass-wasting events recorded in lacustrine sediments on Langøya in Vesterålen, 606
northern Norway. Quaternary Science Reviews 148, 146-162.
607
Oches, E.A., McCoy, W.D., 1995. Aminostratigraphic evaluation of conflicting age estimates 608
for the “young loess” of Hungary. Quaternary Research 44, 160-170.
609
Özer, M., Orhan, M., Işik, N.S., 2010. Effect of particle optical properties on size distribution 610
of soils obtained by laser diffraction. Environmental and Engineering Geoscience. 16,163-73.
611
Polakowski, C., Sochan, A., Bieganowski, A., Ryzak, M., Földényi, R., Tóth, J., 2014.
612
Influence of the sand particle shape on particle size distribution measured by laser diffraction 613
method. International Agrophysics 28, 195-200.
614
Polo-Díaz, A., Benito-Calvo, A., Martínez-Moreno, J., Mora Torcal, R., 2016. Formation 615
processes and stratigraphic integrity of the Middle-to-Upper Palaeolithic sequence at Cova 616
Gran de Santa Linya (Southeastern Prepyrenees of Lleida, Iberian Peninsula). Quaternary 617
International 417, 16-38.
618
26
Pye, K.H., Sperling, C.H.B., 1983. Experimental investigation of silt formation by static 619
breakage processes: the effect of temperature, moisture and salt on quartz dune sand and 620
granitic regolith. Sedimentology 30, 49-62.
621
Pye, K., 1987. Aeolian Dust and Dust Deposits. Academic Press, London 334 p.
622
Pye, K., 1994. Shape sorting during wind transport of quartz silt grains - discussion. Journal of 623
Sedimentary Research A 64, 704-705.
624
Pye, K., 1995. The nature, origin and accumulation of loess. Quaternary Science Reviews 14, 625
653-667.
626
Rodríguez, J.M., Edeskär, T., Knutsson, S., 2013. Particle shape quantities and measurement 627
techniques-A review. Electronic Journal of Geotechnical Engineering 18 A, 169-198.
628
Rubin, D.M., 2004. A simple autocorrelation algorithm for determining grain size from digital 629
images of sediment. Journal of Sedimentary Research 74, 160-165.
630
Schneider, A., Marcini, A., 2013. Morphologi G3-ID - A new instrument for problems in 631
cement research. Cement International 11, 69-77.
632
Schulte, P., Lehmkuhl, F., in press. The difference of two laser diffraction patterns as an 633
indicator for post-depositional grain size reduction in loess-paleosol sequences.
634
Palaeogeography, Palaeoclimatology, Palaeoecology 635
Schulte, P., Sprafke, T, Rodrigues, L., Fitzsimmons, K.E., in press. Are fixed grain size ratios 636
useful proxies for loess sedimentation dynamics? Experiences from Remizovka, Kazakhstan.
637
Aeolian Research 638
Shang, Y., Kaakinen, A., Beets, C.J., Prins, M.A., in press. Aeolian silt transport processes as 639
fingerprinted by dynamic image analysis of the grain size and shape characteristics of Chinese 640
loess and Red Clay deposits. Sedimentary Geology.
641
27
Sochan, A., Zieliński, P., Bieganowski, A., 2015. Selection of shape parameters that 642
differentiate sand grains, based on the automatic analysis of two-dimensional images.
643
Sedimentary Geology 327, 14-20.
644
Tafesse, S., Robison Fernlund, J.M., Sun, W., Bergholm, F., 2013. Evaluation of image analysis 645
methods used for quantification of particle angularity. Sedimentology 60, 1100-1110.
646
Újvári, G., Varga, A., Raucsik, B., Kovács, J., 2014. The Paks loess-paleosol sequence: A 647
record of chemical weathering and provenance for the last 800ka in the mid-Carpathian Basin.
648
Quaternary International 319, 22-37.
649
Újvári, G., Kok, J.F., Varga, G., Kovács, J., 2016. The physics of wind-blown loess:
650
Implications for grain size proxy interpretations in Quaternary paleoclimate studies. Earth- 651
Science Reviews 154, 247-278.
652
Ulusoy, U., Kursun, I., 2011. Comparison of different 2D image analysis measurement 653
techniques for the shape of talc particles produced by different media milling. Minerals 654
Engineering 24, 91-97.
655
van Hateren, J.A., Prins, M.A., van Balen, R.T., in press. On the genetically meaningful 656
decomposition of grain-size distributions: A comparison of different end-member modelling 657
algorithms. Sedimentary Geology 658
Vandenberghe, J., 2013. Grain size of fine-grained windblown sediment: A powerful proxy for 659
process identification. Earth-Science Reviews 121, 18-30.
660
Varga, G., 2015. Changing nature of pleistocene interglacials–is it recorded by paleosoils in 661
hungary (Central Europe)? Hungarian Geographical Bulletin 64, 313-322.
662
Varga, G, Cserháti, Cs., Kovács, J., Szalai, Z., 2016. Saharan dust deposition in the Carpathian 663
Basin and its possible effects on interglacial soil formation. Aeolian Research 22, 1-12.
664
28
Varga, Gy., Újvári, G., Kovács, J., in press. Interpretation of sedimentary (sub)populations 665
extracted from grain size distributions of Central European loess-paleosol series. Quaternary 666
International 667
Warrick, J.A., Rubin, D.M., Ruggiero, P., Harney, J.N., Draut, A.E., Buscombe, D., 2009.
668
Cobble cam: Grain-size measurements of sand to boulder from digital photographs and 669
autocorrelation analyses. Earth Surface Processes and Landforms 34, 1811-1821.
670
Wright, J.S., 2001. Desert loess versus glacial loess: Quartz silt formation, source areas and 671
sediment pathways in the formation of loess deposits. Geomorphology 36, 231-256.
672 673 674 675