ORIGINAL PAPER
Quantitative coronary plaque analysis predicts high-risk plaque morphology on coronary computed tomography angiography:
results from the ROMICAT II trial
Ting Liu1,2 · Pál Maurovich-Horvat2,3 · Thomas Mayrhofer2,4 · Stefan B. Puchner2,5 · Michael T. Lu2 · Khristine Ghemigian2 · Pieter H. Kitslaar6,7 · Alexander Broersen6 · Amit Pursnani2 · Udo Hoffmann2 · Maros Ferencik2,8
Received: 4 July 2017 / Accepted: 7 August 2017
© Springer Science+Business Media B.V. 2017
napkin-ring sign or spotty calcium were detected. Univari- able and multivariable logistic regression analyses were per- formed to assess the association between quantitative and qualitative high-risk plaque assessment. Among 888 seg- ments with coronary plaque, high-risk plaque was present in 391 (44.0%) segments by qualitative analysis. In quantitative analysis, segments with high-risk plaque had higher total plaque volume, low CT attenuation plaque volume, plaque burden and remodeling index. Quantitatively assessed low CT attenuation plaque volume (odds ratio 1.12 per 1 mm3, 95% CI 1.04–1.21), positive remodeling (odds ratio 1.25 per 0.1, 95% CI 1.10–1.41) and plaque burden (odds ratio 1.53 per 0.1, 95% CI 1.08–2.16) were associated with high-risk plaque. Quantitative coronary plaque characteristics (low CT attenuation plaque volume, positive remodeling and plaque burden) measured by semi-automated software correlated with qualitative assessment of high-risk plaque features.
Keywords Coronary CT angiography · High-risk coronary plaque · Coronary atherosclerosis · Quantitative assessment
Abstract Semi-automated software can provide quanti- tative assessment of atherosclerotic plaques on coronary CT angiography (CTA). The relationship between estab- lished qualitative high-risk plaque features and quantitative plaque measurements has not been studied. We analyzed the association between quantitative plaque measurements and qualitative high-risk plaque features on coronary CTA.
We included 260 patients with plaque who underwent coro- nary CTA in the Rule Out Myocardial Infarction/Ischemia Using Computer Assisted Tomography (ROMICAT) II trial. Quantitative plaque assessment and qualitative plaque characterization were performed on a per coronary segment basis. Quantitative coronary plaque measurements included plaque volume, plaque burden, remodeling index, and diam- eter stenosis. In qualitative analysis, high-risk plaque was present if positive remodeling, low CT attenuation plaque,
Dr Liu and Dr Maurovich-Horvat have contributed equally to this work.
The authors take responsibility for all aspects of the reliability and freedom from bias of the data presented and their discussed interpretation.
* Ting Liu
cmuliuting@sina.cn
1 Department of Radiology, First Affiliated Hospital of China Medical University, 110001 Shenyang, China
2 Cardiac MR PET CT Program, Division of Cardiology and Department of Radiology, Harvard Medical School, Massachusetts General Hospital, Boston, MA, USA
3 MTA-SE Cardiovascular Imaging Research Group, Heart and Vascular Center, Semmelweis University, Budapest, Hungary
4 School of Business Studies, Stralsund University of Applied Sciences, Stralsund, Germany
5 Department of Biomedical Imaging and Image-Guided Therapy, Medical University Vienna, Vienna, Austria
6 Department of Radiology, Division of Image Processing, Leiden University Medical Center, Leiden, The Netherlands
7 Medis Medical Imaging Systems B.V, Leiden, The Netherlands
8 Knight Cardiovascular Institute, Oregon Health and Science University, Portland, OR, USA
Introduction
Patients with coronary artery disease (CAD) may not expe- rience any symptoms before developing acute coronary syndrome (ACS) or sudden cardiac death. In majority of cases ACS develops at the site of previously non-stenotic plaque with high-risk features that ruptures with subsequent thrombosis rather than at the site with a stable plaque and luminal narrowing [1–3]. Therefore, the early identifica- tion of patients with high-risk plaques is of utmost impor- tance to allow for early medical therapy. The ultimate goal is to reduce the mortality and morbidity of CAD through improved cardiovascular risk stratification [4, 5].
The histological features of the culprit plaques in ACS include large necrotic core, higher macrophage count, posi- tive remodeling, speckled calcium and thin fibrous cap [3, 6]. Similar morphological features (positive remodeling, larger plaque area, spotty calcification and large necrotic core) were observed with intravascular imaging in culprit lesions of patients with ACS [7].
Coronary CT angiography (CTA) is a non-invasive modality that allows the simultaneous visualization of the coronary artery wall and lumen. Furthermore, coronary CTA can detect high-risk plaque features associated with the presence of acute coronary syndrome and with the future cardiovascular events in qualitative analysis (e.g. positive remodeling, low CT attenuation plaque spotty calcification, napkin-ring sign and spotty calcium) [8, 9]. More recently, advances in image quality and quantitative software tools for plaque quantification allowed establishing plaque volume and burden as predictors of major cardiovascular events [10, 11]. The quantitative plaque assessment is now sufficiently reproducible [12] and the utility of automated quantitative plaque analysis tools are currently under investigation [13, 14]. However, the relationship between established qualita- tive high-risk plaque features and quantitative plaque metrics has not been studied.
Therefore, the aim of study was to perform quantitative assessment of coronary plaque on coronary CTA using an automated software tool in the setting of multicenter clinical trial. Furthermore, we sought to investigate the association of quantitative plaque metrics with well-established qualita- tive high-risk plaque features.
Materials and methods Patient population
This is a secondary analysis of the prospective multi-center Rule Out Myocardial Infarction/Ischemia Using Computer Assisted Tomography (ROMICAT) II trial (ClinicalTri- als.gov ID: NCT01084239). Our study cohort consisted of
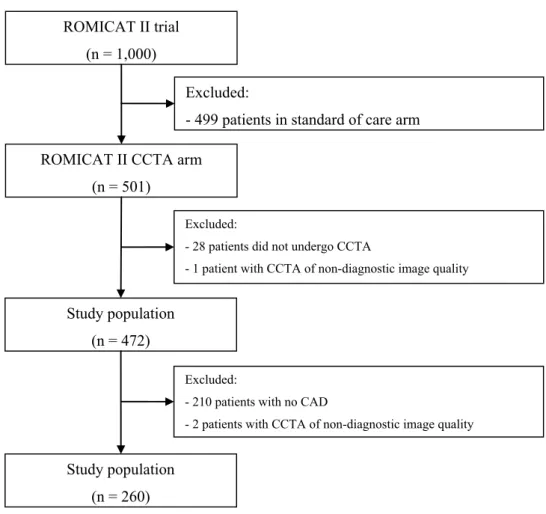
subjects who were randomized to the coronary CTA arm of the trial (Fig. 1). A detailed description of the patient selec- tion was previously published [15]. In summary, between April 2010 and January 2012, 501 patients with low to inter- mediate risk who presented to the emergency departments (ED) of nine hospitals in the United States with a clinical suspicion for acute coronary syndrome (ACS) were enrolled and randomized to either coronary CTA or standard of care.
All study participants provided written consent for participa- tion in ROMICAT II. This study has been approved by the local institutional review board.
Coronary CTA imaging protocol
Coronary CTA (retrospectively ECG-gated or prospectively ECG-triggered scan) was acquired using 64-slice multidetec- tor-row CT (MDCT) or more advanced scanner models [16].
The study sites used the scanners from three vendors (Sie- mens, General Electric and Toshiba) and different scanner generations (64-slice, 128-slice, 256-slice, and dual source scanners). Images were transferred to a central core labora- tory for analysis.
Qualitative coronary CTA analysis
The coronary CTA analysis was performed per coronary segment using the model of the Society of Cardiovascular Computed Tomography [17, 18]. Coronary CTA datasets were equally divided among three readers in a random fash- ion (MF, SBP, TL), who performed qualitative plaque char- acterization. All readers had at least 5 years of experience and a level III training in coronary CTA.
The degree of diameter stenosis was graded by visual estimation as either significant stenosis (≥50%), or no sig- nificant stenosis (<50%) in each coronary segment. If coro- nary plaque was present, qualitative plaque characterization was performed to note the presence of four high-risk plaque features: positive remodeling (remodeling index > 1.1), low CT attenuation (presence of non-calcified plaque with CT attenuation <30 HU), napkin-ring sign (presence of a central area of low CT attenuation that is in contact with the lumen and a ring-like higher attenuation plaque tissue surround- ing this central area) and spotty calcium (size of calcium:
<3 mm diameter, length < 1.5 of vessel diameter, width < 2/3 of vessel diameter) [8].
Quantitative coronary CTA analyses
Quantitative coronary CTA analysis was performed in scans with coronary plaque using a validated software tool (QAn- gio CT Research Edition version 2.0, Medis medical imag- ing systems b.v, Leiden, the Netherlands) [19, 20]. Four readers (MF, SBP, MTL, PMH), each with at least 5 years
of experience and level III training in coronary CTA per- formed the quantitative plaque measurements. Each of the four readers individually performed the quantitative plaque measurements in equally divided and randomly assigned coronary CTA studies. Further, all four readers analyzed 20 randomly selected coronary CTA datasets to determine interobserver agreement.
The segmentation of the luminal and outer coronary artery wall boundaries was performed automatically with manual adjustment (Fig. 2). Quantitative plaque measure- ment was only conducted in coronary segments with cor- onary plaques. The readers selected proximal and distal reference sites at normal or nearly normal vessel locations adjacent to the plaque. The final results of the quantitative measurements were reported per coronary segment using the model of the Society of Cardiovascular Computed Tomog- raphy [18]. If multiple plaques were found in one coro- nary segment, quantitative measurements from all plaques were summed for such segment. Lumen diameter stenosis, total plaque volume, volumes of plaque with CT attenua- tion with <30 and <60 HU, plaque burden and remodeling index were obtained using the automated software tool. The coronary plaque burden was calculated as the percentage of plaque area from the cross-sectional vessel area at the site of
minimal luminal area. The remodeling index was calculated as the outer vessel wall area at the site of the minimal lumi- nal area divided by the vessel area defined by the vessel wall reference at that location. The vessel wall reference provides the estimate of the normal tapering of the coronary artery between the proximal and distal reference segment. We defined positive remodeling as the remodeling index >1.1.
The diameter stenosis was calculated as the minimal luminal diameter divided by the mean of the luminal diameters of the proximal and distal reference sites.
Statistical analysis
All statistical analyses were performed using Stata 13.1 (StataCorp LP, College Station, Texas). Continuous data are presented as mean ± standard deviation or median with interquartile range. Categorical variables are presented as absolute and relative frequencies. Intraclass correlation coef- ficient (ICC) was calculated by the use of a two-way random- effects model and was used to evaluate interobserver agree- ment among four readers. Comparisons between groups were performed using univariable multilevel mixed-effects logistic regression models that account for the group struc- ture (i.e. multiple segments per patient) and thus possible
Fig. 1 Inclusion and exclusion
criteria ROMICAT II trial
(n = 1,000)
ROMICAT II CCTA arm (n = 501)
Study population (n = 472)
Excluded:
- 499 patients in standard of care arm
Excluded:
- 28 patients did not undergo CCTA
- 1 patient with CCTA of non-diagnostic image quality
Study population (n = 260)
Excluded:
- 210 patients with no CAD
- 2 patients with CCTA of non-diagnostic image quality
autocorrelation effects in the data. We used the same regres- sion method performing univariable (i.e. unadjusted odds ratios) and multivariable analyses (i.e. adjusted odds ratios) to determine the association between qualitative and quan- titative high-risk plaque characteristics. Two-sided p value of <0.05 was considered significant.
Results
Study population
From 501 patients randomized to the coronary CTA arm, 473 patients successfully underwent coronary CTA. Rea- sons for not undergoing a coronary CTA included: patient declined coronary CTA (n = 9), safety concerns (n = 5), una- vailability of coronary CTA (n = 5), or technical difficulties (n = 9). One patient was excluded from further analysis due to non-diagnostic image quality in all coronary segments.
Total of 472 patients were included in the qualitative plaque analysis, and 470 patients in the quantitative plaque assess- ment (two patients were excluded due to insufficient image quality for quantitative assessment) (Fig. 1). Patients with coronary artery plaque (n = 260) were included for further
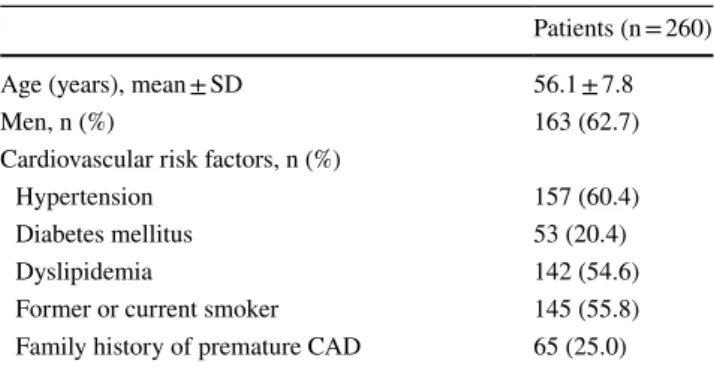
quantitative plaque analysis (mean age 56.1 ± 7.8 years, 62.7% men), Table 1. Quantitiative plaque asssessment was feasible in all patients with coronary plaque. At the segment level, we excluded only 2.8% (108 out of 3804) of coronary segments with insufficient image quality for quantitative analysis.
Qualitative plaque characteristics
Coronary artery disease defined as the presence of any coronary plaque was detected in 260 patients. Of these
Fig. 2 Curved multi-planar reconstruction of the LAD (a). A non- calcified, positively remodeled plaque with a low CT attenuation is visible in the proximal segment of the LAD indicated by white arrows. The segmentation of the luminal and outer vessel boundaries (yellow and orange lines) was performed automatically with man- ual adjustment (b). The graph illustrates the distribution of various plaque CT attenuation values, Y axis plaque cross-sectional area, X
axis distance from the left coronary ostium (c). Cross-sectional image of the plaque at the position indicated by white dashed lines (panel d), the panel e shows the same cross-section with color overlay based on CT numbers, red: low-attenuation non-calcified plaque (≤30 HU), light and dark green: high-attenuation non-calcified plaque (30–
120 HU). (LAD left anterior descending artery, LCX left circumflex coronary artery)
Table 1 Clinical characteristics of study patients
Patients (n = 260)
Age (years), mean ± SD 56.1 ± 7.8
Men, n (%) 163 (62.7)
Cardiovascular risk factors, n (%)
Hypertension 157 (60.4)
Diabetes mellitus 53 (20.4)
Dyslipidemia 142 (54.6)
Former or current smoker 145 (55.8)
Family history of premature CAD 65 (25.0)
patients, 45 (17.3%) had obstructive CAD, defined as
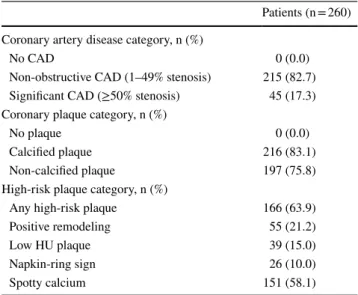
≥50% stenosis, and 215 (82.7%) had non-obstructive CAD, with a stenosis of 1–49%. Calcified plaques were present in 216 (83.1%) and non-calcified plaques in 197 (75.8%) patients. At least one high-risk plaque feature was present in 166 (63.8%) patients. The most common high- risk plaque feature was spotty calcium, which was present in 151 (58.1%) patients. Positive remodeling was present in 55 (21.2%), low HU plaque was present in 39 (15.0%), and napkin-ring sign was present in 26 (10.0%) patients, Table 2. In total, coronary plaque was found in 888 coro- nary segments. Among them, 82 segments had positive remodeling, 53 segments had low CT attenuation plaque, 35 segments had napkin-ring sign and 347 segments had spotty calcification.
Quantitative plaque measurements
We quantitatively analyzed coronary plaques in 888 coro- nary segments (number of segments with multiple plaques n = 66/3804). The median lumen diameter stenosis of these segments was 0.11 (IQR 0.05–0.23). The median total plaque volume was 36.0 mm3 (IQR 17.8–75.2). The median plaque burden was 0.45 (IQR 0.38–0.53). The median low CT attenuation plaque volume was 0.17 mm3 (IQR 0.00–1.07) for <30 HU and 0.90 mm3 (IQR 0.14–3.57) for <60 HU. The median remodeling index was 1.02 (IQR 0.92–1.15).
Interobserver variability of quantitative coronary plaque analysis
We observed good to very good interobserver agreement among four readers for the quantitative measurements of volume of plaque with <30 HU (ICC 0.80, 95% CI 0.74–0.86), volume of plaque with <60 HU (ICC 0.87, 95% CI 0.82–0.91), positive remodeling (ICC 0.69, 95% CI 0.60–0.77), and plaque length (ICC 0.98, 95% CI 0.98–0.99).
Association of quantitative plaque measurements with high-risk plaque features
Out of the 888 coronary segments containing any plaque 391 segments showed at least one high-risk plaque feature, whereas 497 segments contained no high-risk plaque feature.
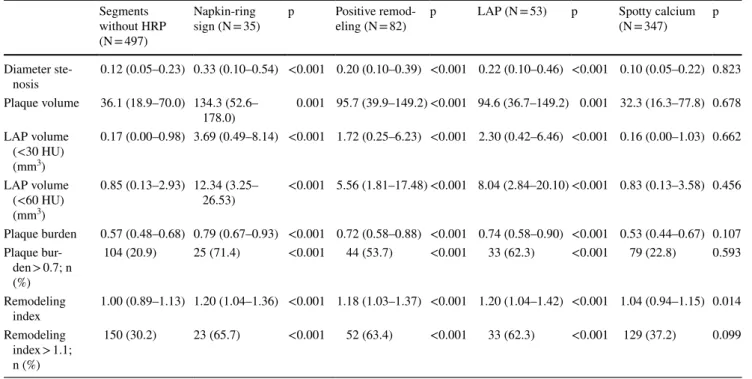
Coronary segments with high-risk plaque features of posi- tive remodeling, low CT attenuation plaque and napkin-ring sign demonstrated higher diameter stenosis, larger low CT attenuation plaque volume, larger maximum plaque burden and increased remodeling index as compared to segments without any high-risk plaque feature (Table 3). Notably, there was no difference in diameter stenosis (median 0.10 vs. 0.12, p = 0.823), total plaque volume (median 32 mm3 vs. 36 mm3, p = 0.678) and plaque burden (median 0.53 vs.
0.57, p = 0.107) in segments with spotty calcium vs. without any high-risk plaque feature.
In univariable analyses, we used the quantitative plaque metrics as independent variables and the presence of any high-risk plaque feature (positive remodeling, low CT atten- uation plaque and napkin-ring sign—we excluded spotty cal- cium as there was no significant association of quantitative plaque characteristics and the presence of spotty calcium) as dependent variable. We found that total plaque volume, low CT attenuation plaque (<30 and <60 HU) volume, plaque burden and remodeling index were strongly associated with the presence of any high-risk plaque feature (Table 4). In multivariable analysis low CT attenuation (<30 HU) plaque volume (odds ratio = 1.12, 95% CI 1.04–1.21, p = 0.03), plaque burden (odds ratio = 1.53, 95% CI 1.08–2.16, p = 0.017) and remodeling index (odds ratio = 1.25, 95% CI 1.10–1.41, p < 0.001) continued to demonstrate an associa- tion with the presence of any high-risk plaque feature. Simi- lar results were found when using low CT attenuation plaque volume of <60 HU.
Discussion
We demonstrated an association between quantitative coro- nary plaque measurements and the presence of high-risk cor- onary plaque features (positive remodeling, low CT attenua- tion plaque and napkin-ring sign) identified by experienced
Table 2 Coronary computed tomography angiography characteris- tics of patients with coronary atherosclerotic plaque (qualitative data)
CAD coronary artery disease, HU Hounsfield unit
Patients (n = 260) Coronary artery disease category, n (%)
No CAD 0 (0.0)
Non-obstructive CAD (1–49% stenosis) 215 (82.7) Significant CAD (≥50% stenosis) 45 (17.3) Coronary plaque category, n (%)
No plaque 0 (0.0)
Calcified plaque 216 (83.1)
Non-calcified plaque 197 (75.8)
High-risk plaque category, n (%)
Any high-risk plaque 166 (63.9)
Positive remodeling 55 (21.2)
Low HU plaque 39 (15.0)
Napkin-ring sign 26 (10.0)
Spotty calcium 151 (58.1)
readers in patients who presented in the ED with suspected ACS. The analysis was feasible in the majority of coronary CTA scans that were acquired in the setting of multicenter clinical trial and various CT scanner use.
The histologic features of coronary plaques found in cul- prit lesions of sudden cardiac death victims included large overall plaque size and large necrotic core, higher mac- rophage count, positive remodeling, speckled calcium, and thin fibrous cap [3]. Similar morphologic features (plaque rupture, thrombus, positive remodeling, larger plaque area, spotty calcium, and large necrotic core) were observed with intravascular imaging techniques when examining culprit
lesions of ACS [7, 21]. High-risk plaque features can be also detected in ACS patients by non-invasive coronary CTA imaging. Coronary plaque features such as positive remode- ling, low CT attenuation plaque, napkin-ring sign, and spotty calcium were more often seen in culprit lesions of ACS as compared to lesions causing stable angina pectoris [10, 22, 23]. Furthermore, the presence of high-risk plaque features assessed either by qualitative or quantitative assessment was associated with increased risk of future major cardiovascular events [9, 24, 25].
The association between coronary plaque character- istics assessed by coronary CTA and histologic plaque
Table 3 Association between quantitative coronary plaque measurements and individual high-risk plaque features (analyses performed per cor- onary segment, p values for the comparison to segments with no high-risk plaque)
HRP high-risk plaque, LAP low CT attenuation plaque, HU Hounsfield unit Segments
without HRP (N = 497)
Napkin-ring
sign (N = 35) p Positive remod-
eling (N = 82) p LAP (N = 53) p Spotty calcium
(N = 347) p
Diameter ste-
nosis 0.12 (0.05–0.23) 0.33 (0.10–0.54) <0.001 0.20 (0.10–0.39) <0.001 0.22 (0.10–0.46) <0.001 0.10 (0.05–0.22) 0.823 Plaque volume 36.1 (18.9–70.0) 134.3 (52.6–
178.0) 0.001 95.7 (39.9–149.2) <0.001 94.6 (36.7–149.2) 0.001 32.3 (16.3–77.8) 0.678 LAP volume
(<30 HU) (mm3)
0.17 (0.00–0.98) 3.69 (0.49–8.14) <0.001 1.72 (0.25–6.23) <0.001 2.30 (0.42–6.46) <0.001 0.16 (0.00–1.03) 0.662
LAP volume (<60 HU) (mm3)
0.85 (0.13–2.93) 12.34 (3.25–
26.53) <0.001 5.56 (1.81–17.48) <0.001 8.04 (2.84–20.10) <0.001 0.83 (0.13–3.58) 0.456 Plaque burden 0.57 (0.48–0.68) 0.79 (0.67–0.93) <0.001 0.72 (0.58–0.88) <0.001 0.74 (0.58–0.90) <0.001 0.53 (0.44–0.67) 0.107 Plaque bur-
den > 0.7; n (%)
104 (20.9) 25 (71.4) <0.001 44 (53.7) <0.001 33 (62.3) <0.001 79 (22.8) 0.593
Remodeling
index 1.00 (0.89–1.13) 1.20 (1.04–1.36) <0.001 1.18 (1.03–1.37) <0.001 1.20 (1.04–1.42) <0.001 1.04 (0.94–1.15) 0.014 Remodeling
index > 1.1;
n (%)
150 (30.2) 23 (65.7) <0.001 52 (63.4) <0.001 33 (62.3) <0.001 129 (37.2) 0.099
Table 4 Unadjusted and adjusted associations between quantitative coronary CTA measurements and the presence of any high-risk plaque fea- ture (positive remodeling, low CT attenuation plaque and napkin-ring sign)
LAP low CT attenuation plaque, HU Hounsfield unit, OR odds ratio, CI confidence interval
*Per 0.10 increase
† Per 1 mm3 increase
Independent variables Unadjusted OR (95% CI) p value Model 1 Model 2
Adjusted OR (95% CI) p value Adjusted OR (95% CI) p value Total plaque volume† 1.01 (1.01–1.01) <0.001 1.00 (1.00–1.01) 0.148 1.00 (1.00–1.01) 0.626 LAP volume (<30 HU)† 1.21 (1.13–1.29) <0.001 1.12 (1.04–1.21) 0.003
LAP volume (<60 HU)† 1.11 (1.08–1.15) <0.001 1.08 (1.03–1.12) <0.001
Plaque burden* 1.83 (1.51–2.21) <0.001 1.53 (1.08–2.16) 0.017 1.53 (1.08–2.16) 0.016
Remodeling index* 1.38 (1.23–1.55) <0.001 1.25 (1.10–1.41) <0.001 1.23 (1.08–1.39) 0.001 Diameter stenosis* 1.41 (1.23–1.61) <0.001 0.96 (0.74–1.25) 0.770 0.94 (0.73–1.23) 0.667
composition was assessed by multiple ex vivo investiga- tions [26, 27]. Early studies using 16-multidetector row CT demonstrated that coronary CTA provides an accurate and reproducible method for the quantitative assessment of total plaque and calcified plaque areas. Subsequently, an ex vivo investigation using state-of-the-art scanner and reconstruc- tion technique showed that qualitative assessment of the attenuation pattern of non-calcified plaques in coronary CTA significantly improves the diagnostic accuracy for the detec- tion of high risk plaques as defined by histology. The authors showed that in experimental conditions the napkin-ring sign had an excellent specificity to identify advanced lesions (98.9%, 95% CI 97.6–100%) [26]. Seifarth et al. investigated the histological correlates of the napkin-ring sign and con- cluded that the detection of this specific plaque attenuation pattern in coronary CTA was independently linked to the size of the necrotic/lipid core, the size of the plaque and the vessel area as measured in histology [27].
Coronary CTA is a unique non-invasive imaging modality with the ability to assess all main coronary arteries and total coronary plaque burden. The accuracy of coronary CTA plaque quantification was successfully validated against grey scale intravascular ultrasound (IVUS) and virtual histology- IVUS (VH-IVUS). Boogers et al. demonstrated that auto- mated quantification of coronary plaque in coronary CTA correlated well with IVUS-derived measurements of lumen area stenosis and plaque burden [28]. Studies using VH- IVUS as a reference standard demonstrated that coronary CTA allows for an accurate and reproducible quantification of coronary plaque burden and plaque volume [29, 30]. In addition, these studies showed that non-calcified plaque components with high CT numbers (>30 HU) correlated with fibrous plaque tissue whereas plaques with low CT numbers (<30 HU) correlated with necrotic core and fibro- fatty plaque components as assessed by VH-IVUS [30]. In line with these observations Marwan et al. demonstrated that lipid-rich plaques have a higher percentage of pixels with low HU values compared with plaques of predominantly fibrous components by using intraplaque pixel CT number histogram analysis [31]. Moreover, in vivo studies utilizing optical coherence tomography as the reference standard to identify thin-cap fibroatheromas demonstrated that high- risk plaques have lower CT numbers as compared to stable lesions (35–45 vs. 62–79 HU; P < 0.001) [32].
Previous studies have assessed associations between both quantitative and qualitative high-risk plaque features as detected by coronary CTA in comparison with intra- vascular ultrasound (IVUS), optical coherence tomogra- phy (OCT) and histology. The direct comparison between qualitative and quantitative coronary CTA assessment of high risk plaque has not been studied. Our study provides support for the feasibility of automated plaque assessment in the evaluation of patients with CAD. We demonstrated
that quantitative measures of coronary plaque (low CT attenuation plaque volume, positive remodeling and plaque burden) are associated with high-risk plaque as determined by a simple quantitative plaque assessment. These results were achieved in the setting of a multicenter, multiven- dor trial with contemporary clinical practice equipment and image quality. Only a small fraction of coronary CTA scans had an image quality precluding qualitative and quantitative plaque analysis. This observation provides evidence that both types of analyses are feasible in the current clinical practice. However, quantitative analysis requires specialized software and additional time for anal- ysis. We previously showed in the identical population that the evaluation of high-risk plaque from both qualitative and quantitative assessment is predictive of ACS indepen- dently of stenosis and clinical risk [8, 33].
Quantitative plaque assessment has a possible value in a few areas of the clinical practice. The implementation of quantitative plaque assessment may improve interobserver variability as has been demonstrated in previous studies.
The use of automated software for quantitative plaque evaluation may improve the accessibility of high-risk plaque assessment for readers with less extensive train- ing and experience. The use of automated software will eventually decrease the time needed for analysis and will allow for more efficient implementation of the high-risk plaque assessment in the clinical practice. Our findings suggest that automated plaque quantification might be a robust proxy to qualitative plaque assessment performed by experienced readers.
High-risk plaques detected in qualitative analysis are predictors of both acute and future cardiovascular events [10, 25]. Similarly, quantitative plaque measurements can also serve as a marker of increased risk of future cardiovas- cular events [19]. A recently published study showed that total plaque volume and total non-calcified plaque volume as assessed with the semiautomatic plaque quantification tool on coronary CTA had an incremental value to predict future ACS events over traditional cardiovascular risk fac- tors and CT features of vulnerable plaques (calcium score, stenosis severity and number of segments with NCP) [19]. In a prospective study, Kristensen et al. demonstrated that the volume of non-obstructive NCP as measured with automated plaque assessment tools is a strong and independent predic- tor of cardiovascular events in patients with non ST segment elevation myocardial infarction who underwent coronary CTA prior to invasive coronary angiography and percuta- neous coronary intervention [26]. Notably, neither calcium score, nor calcified plaque volume were associated with an increased risk of major cardiovascular events [26]. Thus, the quantitative plaque assessment provides valuable tool both to identify patient with ACS and provide personalized prediction of cardiovascular risk.
Limitations
We restricted our analysis to four most established high- risk plaque features (positive remodeling, low CT attenu- ation plaque, napkin-ring sign, and spotty calcium). There is a clear overlap between some of the quantitative features and qualitative features (e.g. positive remodeling, low CT attenuation and napkin-ring sign). Our definition of high risk plaque in quantitative measurements is arbitrary and depends highly on our patient population. Larger clinical trials may be needed to investigate the clinical utility of such quantitative measurements and determine appropriate thresholds associated with increased risk. Our observations were made in the population of patients with suspected ACS and thus the generalizability to populations with stable chest pain may be limited.
Conclusions
Quantitative coronary plaque characteristics (low CT attenu- ation plaque volume, positive remodeling and plaque bur- den) measured by automated software correlate with quali- tative assessment of high-risk plaque features. The use of automated software may improve feasibility of high-risk risk plaque detection in research applications (ACS detection, plaque progression, prognostication of future major cardio- vascular events) and clinical practice.
Funding This work was supported by Grants from the National Heart, Lung, and Blood Institute (U01HL092040 and U01HL092022).
Dr. Ferencik received support from the American Heart Association (13FTF16450001). Dr. Hoffmann received research Grant support from NIH (U01HL092040, U01HL092022), Siemens Medical Solutions and Heart Flow Inc. and consultant/advisory board support from Heart Flow Inc. Pieter Kitslaar is an employee of Medis medical imaging systems B.V.
Compliance with ethical standards
Conflict of interest Dr. Hoffman receives grant support from Sie- mens Medical Solutions and Heart Flow Inc. and consultant/advisory board support from Heart Flow Inc. Pieter Kitslaar is an employee of Medis medical imaging systems B.V. Other authors declares that he/
she has no conflict of interest.
Ethical approval All procedures performed in studies involving human participants were in accordance with the ethical standards of the institutional and national research committee and with the 1964 Helsinki declaration and its later amendments or comparable ethical standards.
References
1. Davies MJ (1997) The composition of coronary-artery plaques. N Engl J Med 336(18):1312–1314
2. Burke AP, Farb A, Malcom GT, Liang YH, Smialek J, Virm- ani R (1997) Coronary risk factors and plaque morphology in men with coronary disease who died suddenly. N Engl J Med 336(18):1276–1282
3. Virmani R, Burke AP, Farb A, Kolodgie FD (2006) Pathology of the vulnerable plaque. J Am Coll Cardiol 47(8 Suppl):C13–18 4. Narula J, Strauss HW (2007) The popcorn plaques. Nat Med
13(5):532–534
5. Maurovich-Horvat P, Ferencik M, Voros S, Merkely B, Hoffmann U (2014) Comprehensive plaque assessment by coronary CT angi- ography. Nature reviews Cardiology 11(7):390–402
6. Varnava AM, Mills PG, Davies MJ (2002) Relationship between coronary artery remodeling and plaque vulnerability. Circulation 105(8):939–943
7. Pundziute G, Schuijf JD, Jukema JW et al (2008) Evaluation of plaque characteristics in acute coronary syndromes: non-invasive assessment with multi-slice computed tomography and invasive evaluation with intravascular ultrasound radiofrequency data analysis. Eur Heart J 29(19):2373–2381
8. Puchner SB, Liu T, Mayrhofer T et al (2014) High-risk plaque detected on coronary CT angiography predicts acute coronary syndromes independent of significant stenosis in acute chest pain: results from the ROMICAT-II trial. J Am Coll Cardiol 64(7):684–692
9. Motoyama S, Sarai M, Harigaya H et al (2009) Computed tomo- graphic angiography characteristics of atherosclerotic plaques subsequently resulting in acute coronary syndrome. J Am Coll Cardiol 54(1):49–57
10. Ferencik M, Schlett CL, Ghoshhajra BB et al (2012) A computed tomography-based coronary lesion score to predict acute coronary syndrome among patients with acute chest pain and significant coronary stenosis on coronary computed tomographic angiogram.
Am J Cardiol 110(2):183–189
11. Schepis T, Marwan M, Pflederer T et al (2010) Quantification of non-calcified coronary atherosclerotic plaques with dual-source computed tomography: comparison with intravascular ultrasound.
Heart 96(8):610–615
12. Voros S, Rinehart S, Qian Z et al (2011) Coronary atherosclerosis imaging by coronary CT angiography: current status, correlation with intravascular interrogation and meta-analysis. JACC Cardio- vasc Imaging 4(5):537–548
13. Lehman SJ, Schlett CL, Bamberg F et al (2009) Assessment of coronary plaque progression in coronary computed tomography angiography using a semiquantitative score. JACC Cardiovasc Imaging 2(11):1262–1270
14. Raff GL, Abidov A, Achenbach S et al (2009) SCCT guidelines for the interpretation and reporting of coronary computed tomo- graphic angiography. J Cardiovasc Comput Tomogr 3(2):122–136 15. Hoffmann U, Truong QA, Schoenfeld DA et al (2012) Coronary CT angiography versus standard evaluation in acute chest pain. N Engl J Med 367(4):299–308
16. Austen WG, Edwards JE, Frye RL et al (1975) A reporting system on patients evaluated for coronary artery disease. Report of the ad hoc committee for grading of coronary artery disease, council on cardiovascular surgery, American Heart Association. Circulation 51(4 Suppl):5–40
17. Leipsic J, Abbara S, Achenbach S et al (2014) SCCT guidelines for the interpretation and reporting of coronary CT angiography:
a report of the Society of Cardiovascular Computed Tomog- raphy Guidelines Committee. J Cardiovasc Comput Tomogr 8(5):342–358
18. de Graaf MA, Broersen A, Kitslaar PH et al (2013) Automatic quantification and characterization of coronary atherosclerosis with computed tomography coronary angiography: cross-corre- lation with intravascular ultrasound virtual histology. Int J Car- diovasc Imaging 29(5):1177–1190
19. Versteylen MO, Kietselaer BL, Dagnelie PC et al (2013) Addi- tive value of semiautomated quantification of coronary artery disease using cardiac computed tomographic angiography to predict future acute coronary syndrome. J Am Coll Cardiol 61(22):2296–2305
20. Burke AP, Weber DK, Kolodgie FD, Farb A, Taylor AJ, Virmani R (2001) Pathophysiology of calcium deposition in coronary arteries. Herz 26(4):239–244
21. Fujii K, Carlier SG, Mintz GS et al (2005) Association of plaque characterization by intravascular ultrasound virtual histology and arterial remodeling. Am J Cardiol 96(11):1476–1483
22. Hoffmann U, Moselewski F, Nieman K et al (2006) Noninvasive assessment of plaque morphology and composition in culprit and stable lesions in acute coronary syndrome and stable lesions in stable angina by multidetector computed tomography. J Am Coll Cardiol 47(8):1655–1662
23. Motoyama S, Kondo T, Sarai M et al (2007) Multislice computed tomographic characteristics of coronary lesions in acute coronary syndromes. J Am Coll Cardiol 50(4):319–326
24. Dedic A, Kurata A, Lubbers M et al (2014) Prognostic implica- tions of non-culprit plaques in acute coronary syndrome: non- invasive assessment with coronary CT angiography. Eur Heart J Cardiovas Imaging 15(11):1231–1237
25. Kristensen TS, Kofoed KF, Kuhl JT, Nielsen WB, Nielsen MB, Kelbaek H (2011) Prognostic implications of nonobstructive coro- nary plaques in patients with non-ST-segment elevation myocar- dial infarction: a multidetector computed tomography study. J Am Coll Cardiol 58(5):502–509
26. Maurovich-Horvat P, Schlett CL, Alkadhi H et al (2012) The napkin-ring sign indicates advanced atherosclerotic lesions in coronary CT angiography. JACC Cardiovasc Imaging 5(12):1243–1252
27. Seifarth H, Schlett CL, Nakano M et al (2012) Histopathological correlates of the napkin-ring sign plaque in coronary CT angiog- raphy. Atherosclerosis 224(1):90–96
28. Boogers MJ, Broersen A, van Velzen JE et al (2012) Automated quantification of coronary plaque with computed tomography:
comparison with intravascular ultrasound using a dedicated reg- istration algorithm for fusion-based quantification. Eur Heart J 33(8):1007–1016
29. Brodoefel H, Burgstahler C, Sabir A et al (2009) Coronary plaque quantification by voxel analysis: dual-source MDCT angiogra- phy versus intravascular sonography. AJR Am J Roentgenol 192(3):W84–W89
30. Voros S, Rinehart S, Qian Z et al (2011) Prospective validation of standardized, 3-dimensional, quantitative coronary computed tomographic plaque measurements using radiofrequency back- scatter intravascular ultrasound as reference standard in inter- mediate coronary arterial lesions: results from the ATLANTA (assessment of tissue characteristics, lesion morphology, and hemodynamics by angiography with fractional flow reserve, intravascular ultrasound and virtual histology, and noninvasive computed tomography in atherosclerotic plaques) I study. JACC Cardiovasc Interv 4(2):198–208
31. Marwan M, Taher MA, El Meniawy K et al (2011) In vivo CT detection of lipid-rich coronary artery atherosclerotic plaques using quantitative histogram analysis: a head to head comparison with IVUS. Atherosclerosis 215(1):110–115
32. Kashiwagi M, Tanaka A, Kitabata H et al (2009) Feasibility of noninvasive assessment of thin-cap fibroatheroma by multi- detector computed tomography. JACC Cardiovasc Imaging 2(12):1412–1419
33. Ferencik M, Mayrhofer T, Puchner SB et al (2015) Computed tomography-based high-risk coronary plaque score to predict acute coronary syndrome among patients with acute chest pain–
Results from the ROMICAT II trial. J Cardiovasc Comput Tomogr 9(6):538–545