The role of novel iterative image reconstruction algorithms in coronary CT imaging
Doctoral Thesis
Bálint Szilveszter M.D.
Semmelweis University
Doctoral School of Basic Medicine
Supervisor: Pál Maurovich-Horvat, M.D., Ph.D.
Official reviewers: Tamás Györke, M.D., Ph.D.
Gergely Ágoston, M.D., Ph.D.
Head of the Final Examination Committee:
Viktor Bérczi, M.D., D.Sc.
Members of the Final Examination Committee:
Attila Doros, M.D., Ph.D.
László Sallai, M.D., Ph.D.
Budapest
2017
Table of Contents
Table of contents ... 2
Abbreviations ... 4
1. INTRODUCTION ... 6
1.1 Noninvasive coronary imaging using CT angiography ... 8
1.2 Challenges of CT imaging: Radiation exposure and image quality ... 12
1.3 Coronary calcium score based risk assessment ... 14
1.4 Prognostic value of coronary CT angiography ... 17
1.5 Qualitative and quantitative plaque assessment ... 23
1.6 Novel iterative reconstruction algorithms in coronary imaging ... 26
2. OBJECTIVES………29
2.1 Defining the impact of iterative reconstruction on calcium score and risk assessment ... 29
2.2 Defining the influence of iterative reconstruction on image quality ... 29
2.3 Defining the changes in plaque quantification using iterative reconstruction ... 29
3. METHODS………30
3.1. Study design and study population for CAC based risk assessment... 30
3.1.1 Coronary CT data acquisition and image analysis ... 31
3.1.2 Risk reclassification in the test patient cohort ... 32
3.2. Study design and population for image quality and plaque analysis ... 33
3.2.1 Scan protocol ... 34
3.2.2 Qualitative and quantitative image quality analysis ... 35
3.3 Semi-automated plaque assessment ... 38
3.4 Statistical analyses ... 40
4. RESULTS……….41
4.1 Calcium score based risk reclassification by novel iterative reconstruction algorithms ... 41
4.2 Comparison of image quality parameters using different reconstructions ... 47
4.3 Model based iterative reconstruction reduces calcified plaque volume ... 55
5. DISCUSSION………..57
5.1 The use of iterative reconstruction for CAC assessment ... 57
5.2 Iterative reconstruction for improving image quality ... 60
5.3 Impact of the reconstruction method on plaque analysis ... 62
5.4 Limitations ... 63
5.5 Future Perspectives ... 64
6. CONCLUSIONS ... 66
7. SUMMARY ... 67
8. ÖSSZEFOGLALÁS ... 68
9. BIBLIOGRAPHY ... 69
10. BIBLIOGRAPHY OF THE CANDIDATE'S PUBLICATIONS ... 85
10.1 Publications closely related to the present thesis ... 85
10.2 Publication not related to the present thesis ... 85
ACKNOWLEDGEMENTS ... 89
Abbreviations
ACS Acute Coronary Syndrome AHA American Heart Association ALARA As Low As Reasonably Achievable BMI Body Mass Index
bpm beat per minute
CAC Coronary Artery Calcium CAD Coronary Artery Disease CI Confidence Interval CNR Contrast-to-noise ratio
CT Computed Tomography
CTA Computed Tomography Angiography CVD Cardiovascular Disease
ECG Electrocardiography FBP Filtered Back Projection
HIR Hybrid-type Iterative Reconstruction
HR Heart Rate
HU Hounsfield Unit
ICA Invasive Coronary Angiography ICC Intraclass Correlation Coefficient IMR Iterative Model Reconstruction IR Iterative Reconstruction
IRB Institutional Review Board
kV kilovolt
LAD Left Anterior Descending Artery LCX Left Circumflex Artery
LM Left Main Coronary Artery mAs milliampere-second
mm Hg millimeter of mercury MPR Multiplanar Reformation NCP Non-calcified Plaque NRS Napkin-ring sign
PL Posterolateral Branch RCA Right Coronary Artery ROI Region of Interest
SCCT Society of Cardiovascular Computed Tomography SNR Signal-to-noise Ratio
TCFA Thin Cap Fibroatheroma
VH-IVUS Virtual-Histology Intravascular Ultrasound
1. INTRODUCTION
Cardiovascular disease (CVD) is the leading cause of morbidity and mortality globally (1-3). CVD is responsible for over 4 million deaths in Europe, accounting for 47 % of all deaths (4). Coronary artery disease (CAD) is a dynamic process of atherosclerosis that could lead to acute or chronic luminal obstruction of the coronaries (5). Prevalence of CAD is expected to increase by 10 % in the upcoming years and health care costs are expected to escalate correspondingly (6,7). Therefore, the growing incidence and prevalence of CAD necessitate the implementation of effective prevention strategies based on noninvasive diagnostic tools in order to improve these devastating statistics and reduce the economic burden on healthcare systems. Unfortunately, the currently applied noninvasive diagnostic modalities have limited diagnostic accuracy to detect obstructive CAD (8).
In recent decades coronary computed tomography (CT) angiography (CTA) has emerged as a highly reliable and non-invasive modality for the detection of coronary artery disease.
Prior landmark studies have extensively validated the diagnostic accuracy of coronary CTA versus the gold standard invasive coronary angiography (ICA). Investigations have consistently demonstrated the excellent negative predictive value of CTA (9,10).
Accordingly, the main indication for coronary CTA is to rule out CAD in patients with low-to intermediate pre-test probability (9,11). Current CT scanners with high temporal and spatial resolution are able to detect significantly more coronary lesions than ICA and are also able to depict adjacent cardiac and non-cardiac structures with great certainty.
Importantly, coronary CTA is currently the only non-invasive imaging modality that can describe the extent, distribution and severity of non-obstructive CAD which has significant prognostic implications for patients with stable or acute chest pain (12,13).
Furthermore, CTA is a promising modality for functional evaluation of coronary lesions using cutting-edge technologies such as CT-derived fractional flow reserve simulation and dynamic CT perfusion imaging.
Due to technological advancements, coronary CTA imaging allows for robust qualitative and quantitative assessment of atherosclerotic plaques. Moreover, CTA is a potential tool to monitor morphological intraplaque changes over time using serial imaging. There are different methods to evaluate the extent and severity of CAD. Coronary artery calcium
(CAC) scores measured by CT is a widely utilized, simple, reliable and useful tool for describing coronary plaque burden and is also considered as a screening method for asymptomatic patients. Notably, recent studies suggest that CAC scoring has the ability to also re-stratify patient’s risk and improve statin eligibility. Nonzero calcium score is associated with higher probability for obstructive CAD and increased risk for adverse cardiac events. Consequently, guidelines also incorporated CAC scoring to be considered if conventional risk assessment is uncertain (Class IIb recommendation in the European Society of Cardiology guidelines). CAC scores are measured using non-contrast CT images, however, subsequent contrast enhanced CTA of the coronaries also allows further differentiation of non-calcified or partially calcified plaques in the coronary system based on plaque composition. Moreover, qualitative and quantitative high-risk plaque features were introduced in clinical practice to identify prone-to-rupture coronary plaques.
The number of diagnostic cardiac tests has increased substantially in recent years and this has led to concerns attributable to increased radiation exposure. We have to ensure diagnostic image quality for all patients with lowest dose exposure reasonable achievable according to the “as low as reasonably achievable” (ALARA) principle. There are several dose saving techniques and protocols that were introduced in daily practice to minimize CTA related dose exposure. CAC scoring was established on traditional Filtered Back Projection (FBP) images which are currently considered outdated for contrast enhanced images as novel reconstruction algorithms with robust image noise reduction became available. The increasing use of various iterative reconstruction (IR) techniques by all vendors holds the potential to significantly reduce radiation exposure and simultaneously improve image quality of coronary CT scans. Hybrid-type and model based iterative reconstruction algorithms account for system geometry and noise statistics to eliminate noise from CT images. Despite the widespread use, the influence of novel IR algorithms on coronary calcium scoring, plaque composition and subsequent individual risk assessment remains unclear. The current thesis aims to ascertain the role of novel IR algorithms on CT based plaque assessment and risk prediction.
1.1 Noninvasive coronary imaging using CT angiography
Since the introduction of coronary CTA, there has been an enormous progress in scanner technology and potential clinical applications that led to an improved clinical utility of CTA (14,15). Coronary CTA in patients with suspected CAD also guidesfurther patient management and decision making according to the recently introduced Coronary Artery Disease - Reporting and Data System guidelines (16).
Coronary CT protocol typically consists of a non-enhanced prospectively electrocardiogram (ECG) gated examination for calcium scoring followed by a subsequent contrast enhanced scan for the evaluation of the coronaries and cardiac structures. The non-enhanced scan ensures proper planning of the CTA including the length and position of the scan and the field of view. Calcification of the coronary arteries is a surrogate of coronary plaque burden and an important predictor of cardiovascular morbidity and mortality (17). CAC scoring has gained widespread acceptance due to its ability to re-stratify risk (18). Current software applications are able to calculate calcium scores, mass, volume or even intensity. The scoring method was described by Agatston and is calculated from the calcified lesion area weighted by a density factor based on the voxel with the highest density (19). Non-contrast images with 3 mm slice thickness are reconstructed with filtered back projection to quantify coronary calcium. Despite the fact that calcium scoring does not account for non-calcified plaques it is an excellent tool to predict future outcomes: 0-10 CAC score is considered low risk for adverse events or obstructive CAD, between 10-100 means approximately 2.5 times higher risk, between 100-400 3.5 times higher risk, between 400-1000 6 times higher risk and above 1000 12 times higher risk for cardiovascular mortality within 5 years (20,21).
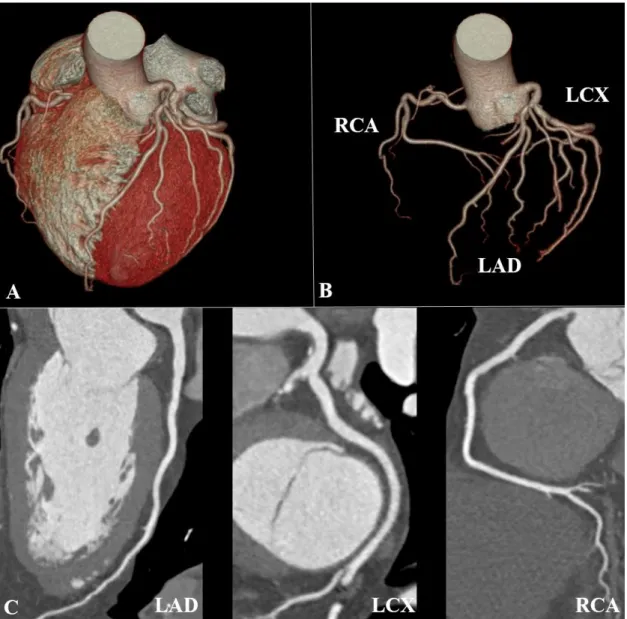
In a subsequent step with the administration of iodinated contrast material robust qualitative and quantitative characterization coronary plaques is feasible (22). High resolution CT scanners are able to depict the vessel wall and the atherosclerotic plaques (Figure 1). Also, functional assessment of the heart is highly reproducible using CTA images. CT angiography is widely used to describe the calcification of valves, or to provide spatial information for the electro-anatomical mapping during radiofrequency ablation procedures. In this regards, readers are also able to exclude left atrial appendage thrombus or changes in atrial structures. Importantly, coronary CTA images provide
additional information on extracardiac findings of adjacent organs including the lungs, diaphragm, mediastinum or the liver and spleen.
Figure 1. Curved multiplanar and 3D volume-rendered images of the coronary arteries and the heart (own material)
A: 3D volumetric reconstruction of the heart and coronaries B: 3D coronary tree C:
Multiplanar curved reconstruction image of the 3 main epicardial coronaries
LAD: left anterior descending artery; LCX: left circumflex artery; RCA: right coronary artery
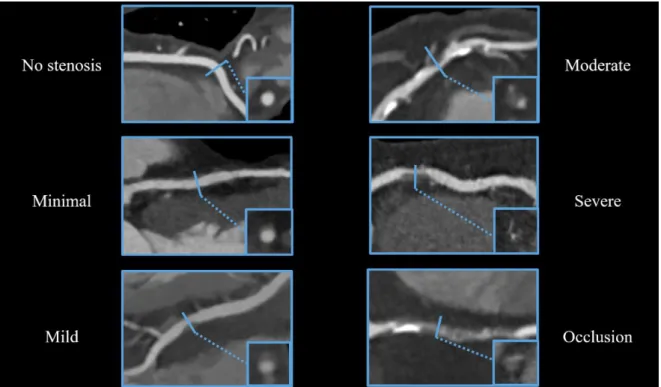
Guidelines for the reading and reporting of coronary findings are described in the Society of Cardiovascular Computed Tomography (SCCT) guidelines (23,24). Coronary lesions are evaluated on a segmental basis using the modified American Heart Association (AHA) 18-segment classification scheme. When analyzing CTA images, segment based assessment of the degree of luminal stenosis is crucial. The degree of stenosis can be evaluated using a 5-point scale as follows: minimal 1-24% stenosis, mild 25-49%
stenosis, moderate 50-69% stenosis, severe 70-99% stenosis and occlusion 100%
stenosis. Representative examples for stenosis categories are shown on Figure 2.
Figure 2. Representative images for stenosis classification using CTA images (own material).
Based on coronary CTA images we can distinguish between no stenosis (0%), minimal 1-24% stenosis, mild 25-49% stenosis, moderate 50-69% stenosis, severe 70-99%
stenosis and occlusion 100%. Cross-sectional images are depicted in the boxes for each category.
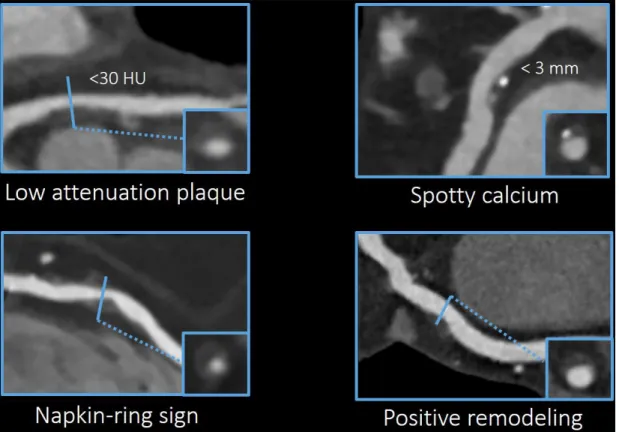
On qualitative plaque assessment, we can distinguish between calcified, non-calcified or partially calcified plaques based on the extent of calcification in a given plaque (Figure 3). Also, current guidelines strongly encourage the assessment of high-risk plaque features such as positive remodeling, spotty calcium, napkin-ring sign (NRS) or low attenuation plaque (16). High-risk plaques seem to possess a higher risk for rupture and thus, could lead to sudden luminal thrombosis and acute myocardial infarction (25).
Optimal patient management is dependent on the prognostic information provided by CTA. Comprehensive assessment of the extent, location, characteristics and severity of CAD using CTA images has prognostic relevance for patients with chest pain (13).
Figure 3. Qualitative plaque analysis on conventional CT reading (own material).
Based on the calcium content of a given plaque we can distinguish between non-calcified, partially calcified or calcified plaques. Traditionally, coronary plaques are classified as noncalcified, partly calcified (with less than 50 % calcium) and calcified (with more than 50 % calcium) plaques on CT images.
1.2 Challenges of CT imaging: Radiation exposure and image quality
Radiation exposure represents a major concern in coronary CTA due to potential risk of malignancy induction (26,27). The fragile balance between diagnostic image quality and applied radiation dose is an ongoing challenge in CT imaging. Image quality is influenced by several factors including patient characteristics, scanner technology, imaging parameters (i.e. tube current, tube voltage, slice thickness) and reconstruction algorithms.
Proper assessment of patient characteristics and patient preparation is therefore of utmost importance to select suitable protocol with current scanner technology (28,29). Also, frequency control with beta-blockade is necessary to reduce heart rate (HR) and heart rate variability (30). Regular and low heart rate ensures proper image quality of CTA examinations.
The multicenter Prospective Multicenter Study On Radiation Dose Estimates Of Cardiac CT Angiography in Daily Practice (PROTECTION) I study sought to evaluate the radiation dose attributed to coronary CTA ten years ago (31,32). Overall, coronary CTA was associated with a median effective dose of 12 millisievert (mSv) and investigators found a remarkable variance in applied radiation exposure levels. Accordingly, several additional milestone PROTECTION studies were carried out to evaluate the influence of dose saving strategies embedded in clinical routine and to reduce variance across CTA providers (33-35). Since then, advancements in CT scanner technology and applications have led to new opportunities of reducing dose without reducing image quality (36). CT scanners with ≥64 slice detector panels are capable to depict constantly moving coronary arteries, nowadays most centers have even more advanced scanners with dual source technology or wider detector panels to achieve excellent image quality with improved spatial resolution. Scanners are able to perform helical or axial mode synchronizing the image acquisition to the detected ECG signal (37). Retrospective ECG gating acquires images throughout the whole cardiac cycle which allows for the reconstruction of any desired cardiac phase for image analysis. Early attempts in dose savings included tube current modulation to reduce radiation exposure during retrospective gated CTA. The PROTECTION II study revealed that tube potential reduction (100 kV versus 120 kV) provides diagnostic image quality with significantly reduced exposure and thus should be
applied in non-obese patients (35). In prospective ECG triggered axial mode image acquisition is restricted to a preselected phase of the cardiac cycle typically in end- diastole, while table movement ensures total coverage of the heart in multiple steps. A comparison of retrospective and prospective ECG gated scanning mode revealed substantial reduction in radiation dose for patients with low heart rate. Later, high-pitch image acquisition mode with dual source scanners were introduced using fast table movement to cover the entire volume of the heart within one cycle. These advancements enabled submillisievert image acquisition for selected patients with low body mass index (BMI) and heart rate. In addition to scanner technology, image reconstruction techniques were improved by reintroducing the computationally intensive but powerful IR algorithms into clinical practice (38). During the past few years various iterative image reconstruction techniques have been introduced by all vendors in order to reduce radiation exposure of cardiac CT while maintaining or even improving signal to noise ratio (SNR).
The impact of IR techniques on image quality and its potential to reduce radiation exposure of patients has been investigated in recent studies (39,40). Model based type of image reconstructions represents the latest advancement among image reconstruction techniques and thus limited data exists regarding the influence of this novel technique on plaque characterization and quantification. Despite recent advancements with robust noise reduction and advanced CT scanner technology, development of individualized dose saving strategies are necessary to meet the ALARA principle.
1.3 Coronary calcium score based risk assessment
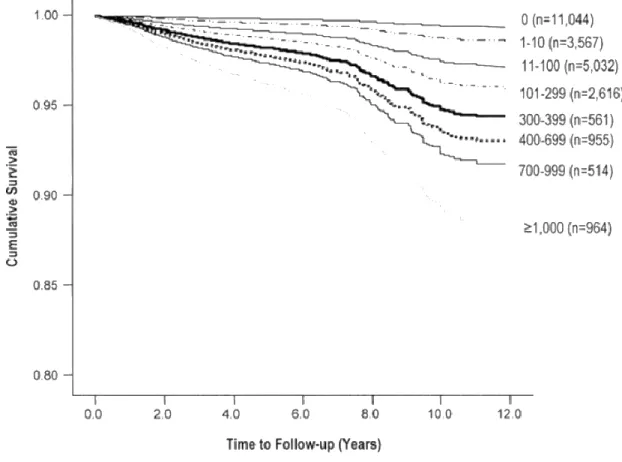
Calcification is a common marker of atherosclerosis. CAC scoring on non-contrast CT images is an established tool for quantifying calcified atherosclerotic plaque burden. CAC assessment is therefore used for atherosclerosis screening among asymptomatic individuals with low-to-intermediate cardiovascular risk (41-44). The quantity of calcified plaques as assessed by non-contrast enhanced ECG-gated CT is an important predictor of cardiovascular morbidity and mortality. Moreover, there is a growing body of evidence that CAC scoring provides incremental value in risk prediction for adverse events of asymptomatic patients over to the conventional risk scores (45,46). Budoff et al. evaluated the prognostic utility of CAC in 25523 asymptomatic consecutive individuals (21). Long term mortality stratified by CAC score is depicted on Figure 4 using observational data.
Figure 4. Prognostic value of coronary calcification by Budoff et al (21). CAC is strong independent perdictor of all cause mortality and incremental to traditional risk factors.
Zero calcium score is associated with minimal cardiovascular risk, and provides a 5 year warranty period free of major adverse cardiovascular events (47). Higher CAC scores were detected in patients with type 2 diabetes reflecting higher prevalence of CAD in this patient population. Raggi et al. demonstrated that zero calcium score in patients with diabetes is associated with similar survival rates as patients without diabetes and detectable calcium (48). CAC is also associated with non-alcoholic fatty liver disease and epicardial fat tissue volume, which has been shown to promote coronary atherosclerosis and development of high risk plaques (49-52). Furthermore, the measurement of plaque calcium density was linked to cardiovascular events in the Multi-Ethnic Study of Atherosclerosis (MESA) (53).
Notably, CAC is influenced by several factors related to image acquisition protocols (tube current, tube voltage, slice thickness), reconstruction techniques and patient characteristics (54,55). Willemink et al. demonstrated limited inter-platform reproducibility of CAC in an ex vivo study (56). CT scanners of the four major vendors measured substantially different calcium score values. Also a simulation study revealed 6.5 % risk reclassification rate among patients with intermediate cardiovascular risk. Yet, prognostic studies were based on CT images with FBP reconstruction, whereas in current clinical practice novel IR methods may underestimate cardiovascular risk estimation and have to be interpreted with caution.
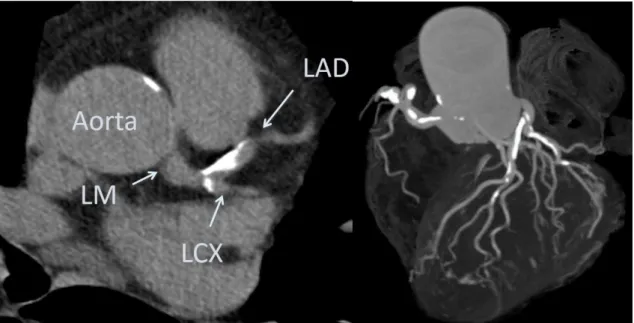
Figure 5. CAC scoring using non-contrast CT images (own material).
The left panel shows a non-contrast enhanced image for calcium scoring with diffuse calcification on the left main coronary artery, left anterior descending artery and left cirxumflex artery. After manual identification of calcified plaques software provides a vessel based CAC score. On the right panel 3D volumetric reconstruction image shows the distribution of diffuse calcification along the coronary tree.
LAD: left anterior descending artery; LCX: left circumflex artery; LM: left main artery
1.4 Prognostic value of coronary CT angiography
In recent decades, several risk scores were proposed to estimate individual risk for CVD and adverse events (57). However, prior studies have shown that traditional risk assessment scores, such as the widely used Framingham Risk Score, are inaccurate for individual risk prediction, as they tend to under- or overestimate patient’s cardiovascular risk (58). The combination of imaging biomarkers with well established clinical parameters might improve personalized cardiovascular risk prediction. Individual plaque features, the extent and severity of atherosclerotic plaque burden were therefore introduced in risk prediction models (59,60). It has been suggested that total atherosclerotic plaque burden is even a stronger predictor of coronary events than total ischemic burden (61).
Histopathological investigations revealed that most acute coronary events originate from sudden atherosclerotic plaque rupture, while plaque erosions and calcified nodules represent the underlying morphology in the remaining cases (62-64). Plaque rupture is triggered by the acute disruption of the fibrotic cap that separates the necrotic plaque core from the blood stream (65). The necrotic plaque is highly thrombogenic and in the presence of pro-thrombotic factors in the blood stream it can lead to sudden thrombus formation with subsequent luminal obstruction. Intraluminal thrombus formation hinders adequate blood supply of the myocardium leading to acute myocardial infarction. Acute myocardial infarction represents the first clinical manifestation of CAD in majority of cases. Therefore, the early identification of high-risk asymptomatic patients is highly desirable although challenging with current techniques (66-68). The vulnerable plaque is a probability concept and it originates from the quest for finding important links between risk for coronary thrombosis and underlying plaque morphology (69,70). The morphological differences between the stable and unstable plaques might represent novel imaging targets for coronary CTA to identify these lesions (71). Compelling evidence suggests that certain adverse plaque characteristics visualized by coronary CTA are associated with acute coronary events (22,72). Thin cap fibroatheromas (TCFA) are considered as the precursor lesion of ruptured plaques based on intracoronary imaging studies and histological examinations. Pathological investigations revealed that the necrotic core of the vulnerable plaque has mean length of 8 mm and area of greater than
1.0 mm2 in more than 80 % of the cases (65). Importantly, the large plaque dimensions of TCFA are above the spatial resolution of modern CT scanners, which provide unique opportunity for high-risk plaque detection. Based on prior studies, vulnerable plaques are most frequently located in the proximal and middle segments of the coronaries (22).
The thin fibrous cap represents a vulnerable interface between blood flow and lipid rich plaque content. In ruptured plaques the mean cap thickness of 23 ± 19 µm was reported and the vast majority of caps (95%) had a thickness below <65 µm (73). The visualization of fibrous cap on CT images is not feasible with current scanner technology due to the limited spatial resolution. However, beyond thin fibrous cap the identification of large necrotic core is one of the best discriminator between vulnerable and stable coronary lesions (74). Positive or outward remodeling represents another important vulnerability marker. The remodeling index is calculated as the vessel cross-sectional area at the site of maximal stenosis divided by the average of proximal and distal reference segments’
cross-sectional areas (75). A remodeling index of ≥1.1 has been suggested as the threshold of positive remodeling in coronary CTA (22).In prior studies, the presence of positive remodeling and low-attenuation plaques on coronary CTA was associated with higher risk for developing acute coronary syndrome (ACS) (72). Low attenuation plaques were more frequent in patients presenting with ACS than with stable angina pectoris (79 vs 9 %; p<0.0001) (76).
The qualitative assessment of attenuation patterns in non-calcified plaques provides a new, more practical approach for plaque characterization independent of Hounsfield Unit (HU) value measurement. The napkin-ring sign (NRS) can be defined by the joint presence of distinct morphological features in non-calcified or partially calcified plaques:
the plaque center of low CT attenuation apparently in contact with the lumen, and a ring- like annular pattern surrounding the core structure with higher attenuation values (77).
NRS plaques have significantly larger necrotic core area than non NRS lesions (median of 1.10 vs 0.46 mm2, respectively, p = 0.05) (78). NRS is a specific imaging biomarker for the detection of TCFA, and the identification of advanced lesions was significantly improved by the implementation plaque attenuation pattern classification as compared to conventional classification scheme (77). According to a recently published study, the napkin ring sign is an independent predictor of acute coronary syndrome (79).
Lipid rich, unstable plaques frequently contain calcium deposits of various sizes. Small (under 3 mm of diameter) calcific nodules, which are surrounded by non-calcified plaque tissue are termed as spotty calcifications (72,76). Motoyama et al. found, that spotty calcification had significantly higher prevalence in ACS as compared to lesions in stable angina patients [69]. Histological investigations demonstrated that microscopic calcification appears frequently in unstable plaques, however, it cannot be visualized with current CT technology due the limited spatial resolution. High-risk plaque features on CT are shown on Figure 6.
Figure 6. High-risk plaque features in coronary imaging (own material).
CTA images show the high-risk plaque features that were linked to adverse events.
Vulnerable plaque features are more frequently found in ACS patients as compared to stable ones. HU: Hounsfield Units
The total coronary plaque burden can be described semi-quantitatively by the number of segments containing any coronary atherosclerotic plaque (segment involvement score) (80). Both obstructive (Hazard Ratio 2.60, 95 % CI 1.94–3.49, p < 0.0001) and non- obstructive CAD (Hazard Ratio 1.60, 95 % CI 1.18–2.16, p = 0.002) was associated with increased mortality rates, while patients without CAD had very favorable survival according to a risk adjusted analysis of Min et al. (81). Segment involvement by any non- obstructive plaque had independent prognostic value for clinical outcomes: highest risk was associated with non-obstructive CAD in the three main vessels (Hazard Ratio 4.75, 95 % CI 2.10–10.75, p = 0.0002) or involving ≥5 segments (Hazard Ratio 5.12, 95 % CI 2.16–12.10, p = 0.0002) during a 3-year follow up (82). A sub-analysis of the Clinical Outcomes Utilizing Revascularization and Aggressive Drug Evaluation (COURAGE) study has revealed that plaque burden based on ICA was a stronger predictor than ischemic burden for adverse cardiac events. Surprisingly, the extent of anatomic burden predicted adverse events (Odds Ratio 1.05, 95 % CI 1.02–1.09; p < 0.001), whereas the increase in ischemic burden (Odds Ratio 1.01, 95 % CI 0.98–1.04, p = 0.54) did not influenced clinical outcomes (61).
Coronary plaque burden assessment might also guide secondary preventive therapies.
Statin eligibility based on CTA findings could provide a more adequate preventive therapy. In a recently published study Bittencourt et al. compared the cardiovascular risk in patient cohorts with different plaque burden categories as assessed by coronary CTA.
Based on the number of coronary segments containing plaque, patients were classified as having extensive (≥4 segments) and non-extensive (<4 segments) CAD (83). The patients with non-obstructive but extensive CAD have similar adverse event rates (Hazard Ratio 3.1, 95 % CI 1.5–6.4) as patients with non-extensive obstructive CAD (Hazard Ratio 3.0;
95 % CI 1.3–6.9) during the nearly 4-year follow-up period. A different approach to coronary plaque burden assessment focusing on the role of non-obstructive plaques is desired as shown by the results of the multicenter CONFIRM study (84). The multicenter registry evaluated a total of 15187 patients without known CAD who underwent coronary CTA and demonstrated that non-obstructive CAD is an important predictor of mortality.
Also, CT adapted Leaman score was introduced to quantify atherosclerotic burden based on coronary CTA images. The Leaman score incorporates lesion localization, degree of stenosis and plaque types and proved to be an independent, long-term prognostic tool of
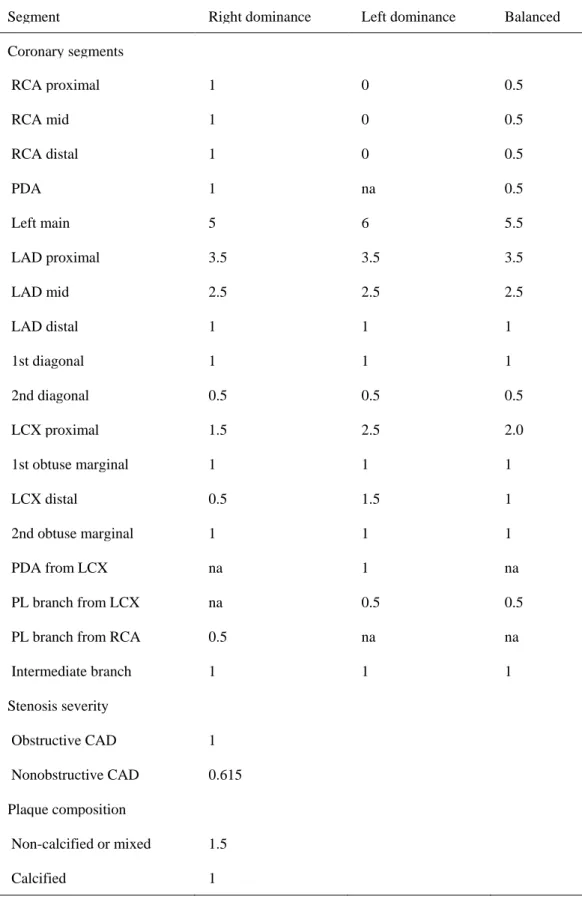
hard cardiac endpoints. Weighting factors for the calculation of CT adapted Leaman score are shown in Table 1 (85). Interestingly, patients with nonobstructive CAD and high Leaman score had similar outcomes as patients with obstructive CAD (86). The results of the PROMISE (Prospective Multicenter Imaging Study for Evaluation of Chest Pain) trial have shown that the assessment of non-obstructive CAD by CT is superior to functional testing and also provides important prognostic value in patients with stable chest pain (87).
Table 1. CT adapted Leaman score based on de Araujo Gonclaves et al. with weighting factors (85). Obstructive CAD was denifed as ≥50 % stenosis. PL: posterolateral
branch, na: non-applicable,
Segment Right dominance Left dominance Balanced
Coronary segments
RCA proximal 1 0 0.5
RCA mid 1 0 0.5
RCA distal 1 0 0.5
PDA 1 na 0.5
Left main 5 6 5.5
LAD proximal 3.5 3.5 3.5
LAD mid 2.5 2.5 2.5
LAD distal 1 1 1
1st diagonal 1 1 1
2nd diagonal 0.5 0.5 0.5
LCX proximal 1.5 2.5 2.0
1st obtuse marginal 1 1 1
LCX distal 0.5 1.5 1
2nd obtuse marginal 1 1 1
PDA from LCX na 1 na
PL branch from LCX na 0.5 0.5
PL branch from RCA 0.5 na na
Intermediate branch 1 1 1
Stenosis severity
Obstructive CAD 1
Nonobstructive CAD 0.615
Plaque composition
Non-calcified or mixed 1.5
Calcified 1
1.5 Qualitative and quantitative plaque assessment
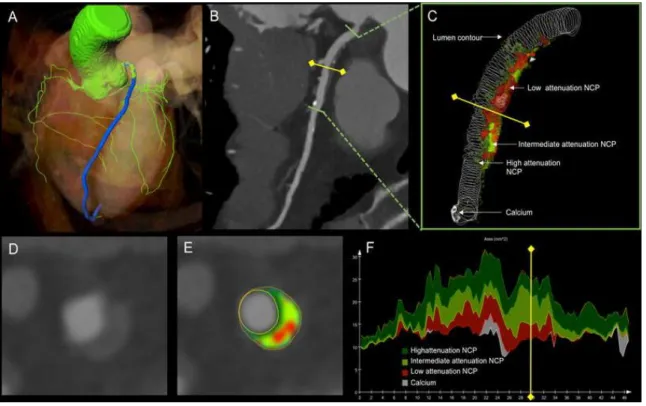
Coronary CTA is an excellent noninvasive tool for the evaluation of coronary arteries that has been utilized widely in recent years. Coronary CTA allows a robust and non-invasive assessment of coronary plaques with regards to the quantification of plaque volumes and attenuation based characterisation of plaque components. Volumetric plaque assessment is based on lumen and vessel wall contouring and components are analysed using fixed or adaptive threshold settings for HU attenuation values (25). Fixed threshold setting utilizes preselected HU ranges as defined by the reader, whereas adaptive threshold setting is automatically defined by software applications based on e.g. the intraluminal contrast attenuation (88). Quantified total plaque volume has been proposed as a promising tool for risk prediction (89,90). Based on the CT numbers we can further differentiate noncalcified plaque components that are corresponding to necrotic core, fibro-fatty or fibrous plaque components using semi-automated software tools (Figure 7). It has been demonstrated that higher attenuation plaques correspond to predominantly fibrous plaques on Virtual-Histology Intravascular Ultrasound (VH-IVUS). On the other hand, plaques with <30 HU density showed a good correlation with VH-IVUS lipid rich plaques. However, the differentiation between lipid rich and fibrous lesions represents a major challenge for non-invasive imaging (91,92).
Semi-automated software tools were used in prior studies to investigate changes in plaque morphology and progression or regression of lesion severity. Lehman et al. sought to investigate alterations in plaque volume and composition over time among patients with acute chest pain (93). Utilizing reproducible semi-quantitative assessment they demonstrated a significant plaque burden and non-calcified plaque progression, which was associated with the clinical risk factors. Papadopoulou et al. analyzed the changes in coronary plaque burden, lumen dimensions, and arterial remodeling using serial imaging (94). Their results indicate that despite medical treatment atheroma size in non-culprit lesions increased by a simultaneous increase in the vessel size (positive remodeling).
Quantitative plaque assessment requires extensive reading experience therefore, it is vulnerable to potential measurement errors. High intra- and inter-reader reproducibility was described for plaque and vessel dimensions, however, lower agreement was observed in compositional parameters (95). Versteylen et al. also found high intra- and inter-
observer correlations in total plaque volume (90). Semi-automated plaque quantification requires time consuming manual correction of the vessel and lumen contours. Recently, commercial software algorithms have been developed to overcome this challenge and achieve accurate plaque quantification with reduced analysis time.
Figure 7. Semi-automated plaque assessment on CTA images (91).
A: representative case of semi-automated coronary plaque quantification and characterization showing a high-risk plaque on coronary CTA images reconstructed by iterative model reconstruction technique. a Coronary tree segmentation with centerlines (green). The LAD is indicated in blue. B: Curved multi-planar reconstruction of the left anterior descending coronary artery showing a high-risk plaque on the proximal segment.
Green lines represent the boundaries of the analyzed segment, while the yellow line with squares at both ends illustrates the cross-sectional position of D and E panels. C:
Volumetric assessment shows the contour of the lumen and the various plaque components based on CT attenuation with adaptive threshold settings. Low attenuation NCP components are shown in red, intermediate and high attenuation NCP components are shown in light and dark green, respectively. Calcium is indicated in white. D: Cross- sectional image showing a non-calcified, positively remodeled plaque with napkin-ring
sign. E: Plaque cross-section with colour overlay. F: Areas of different plaque components of the analyzed segment, y axis represents the area in mm2, x axis the distance from the proximal end of the lesion (91). NCP: non-calcified plaque
The characterization of plaque components based on CT density values is feasible, although the differentiation between lipid-rich and fibrous components remains challenging. It has been suggested that the use of semi-automated analysis of plaque composition improves the differentiation of lipid-rich and fibrous plaques (96). Prior investigations described significant differences between relative volumes of lipid and fibrous plaques based on quantitative analysis. Plaque quantification based on CTA images demonstrated excellent correlation with VH-IVUS regarding vessel, lumen and plaque volumes as well as coronary stenosis (97). Furthermore, Rief et al. assessed the diagnostic performance of computer-aided CAD detection in coronary CTA using conventional coronary angiography as reference standard (98). The diagnostic performance of the computer-aided CAD detection was comparable with a less experienced reader, however it was substantially lower as compared to more experienced readers. Importantly, excellent image quality is a prerequisite for accurate plaque measurements using automated or semi-automated plaque quantification softwares.
Due to the latest advancements in image reconstruction and computing hardware, iterative reconstruction techniques were introduced by all vendors in the clinical setting to reduce image noise and radiation exposure (99). Concerns have been raised, that the impact of IR not only affects image quality but might influence plaque characterization.
Studies suggest however, that hybrid-type IR significantly improves image quality as compared to traditional FBP algorithm without significantly altering coronary plaque analysis (100,101). Moreover, the utilization of model based IR algorithm improves the feasibility of automated plaque assessment with coronary CTA, because it requires less vessel-wall boundary corrections compared to other reconstruction techniques based on an ex vivo study (102).
1.6 Novel iterative reconstruction algorithms in coronary imaging
Interpetation of CAD on coronary CTA images is mainly influenced by image quality.
Common artifacts of CTA images are image noise with poor signal-to-noise ratio (SNR), so called blooming artifacts due to stents or calcification and motion artifacts (103). Most coronary CTA studies have been reconstructed with noise prone filtered back projection (FBP). FBP is a fast and robust technique that has been widely utilized in CT imaging.
Ever growing number of cardiac diagnostic tests necessitates effective reduction of radiation exposure (36,104). With hardware evolution various computationally intense iterative image reconstruction techniques have been introduced by all vendors in order to reduce radiation exposure of cardiac CT while maintaining or even improving SNR (Figure 8) (105).
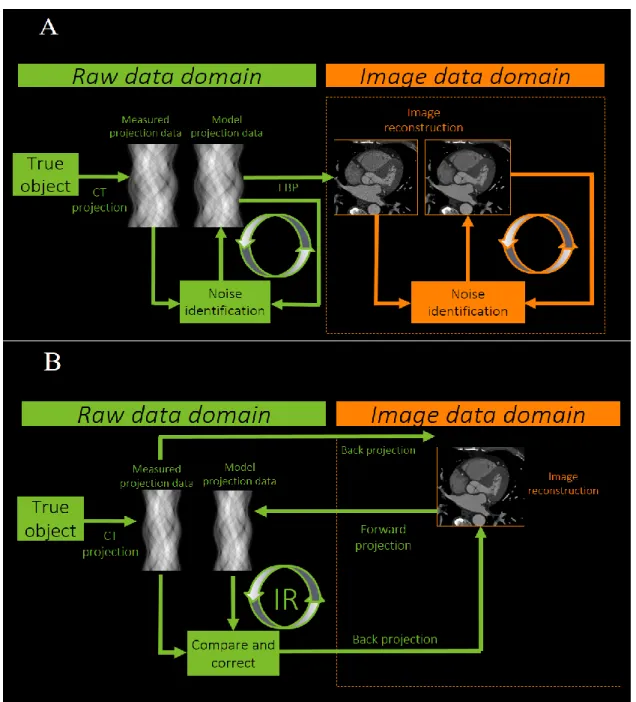
Using traditional FBP reconstruction CT images are generated from the raw data under certain assumptions about scanner geometry. Full IR provides complex modelling of noise distribution and scanner geometry and the process consists of forward and backward reconstruction steps using the images and the projection data to improve image quality.
Different number of iteration steps can be applied and whenever projection data is reconstructed back to images corrections are made. These corrections aim to optimize images and reduce image noise by taking CT system characteristics into consideration using artefact and noise reducing models. IR techniques iterate in either image and raw data domain or both. Hybrid iterative reconstruction (HIR, Philips Healthcare, Best, The Netherlands) utilizes statistic-model based denoising both in raw and image domains, providing up to 55% noise reduction for cardiac image acquisition at standard tube settings (106,107). Moreover, two recent studies demonstrated that HIR had no significant effect on plaque morphology assessment (108-112).
Figure 8. Technical principles for iterative reconstruction algorithms (modified after Willemink MJ et al. Eur Rad (2013) (113,114).
Traditional FBP is a widely applied analytic reconstruction algorithm that assumes that the acquired projection data are free of noise. Iterations can be performed in either the raw data or image data domain, or both. Hybrid-type (Panel A) IR applies noise reduction algorithms implemented in conjunction with a back projection reconstruction process.
Novel model based IR (Panel B) also accounts for system geometry (focal spot size, shape of X-ray beam, interactions of emitted photons with tissue and detector) and iterate images in the raw data domain.
The impact of IR techniques on image quality and its potential to reduce radiation exposure of patients has been investigated in several recent studies (115).
Model based type of image reconstructions represents the latest advancement among image reconstruction techniques that showed improved image quality and holds the potential for further dose reduction (116). Three-dimensional raw data based reconstruction techniques were introduced with forward modeling of recognizing system geometry (focal spot size, shape of X-ray beam, interactions of emitted photons with tissue and detector) additionally to statistical modeling (115). Preliminary data showed the potential of model based IR techniques to achieve more robust noise reduction and/or improved image quality of coronary CTA (Figure 9).
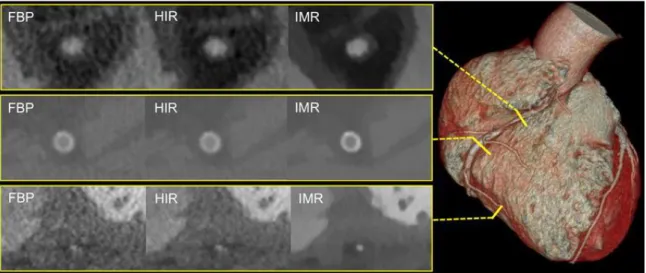
Figure 9. Image quality comparison between traditional FBP reconstruction and novel IR techniques (91).
The figure illustrates the image quality of coronary CTA reconstructed with FBP, HIR and IMR. The volume rendered image illustrates the locations of coronary artery cross- sections depicted in the yellow panels. The upper panel shows the proximal segment of the RCA. IMR provides superior image quality as compared to FBP and HIR, allowing a better delineation of the coronary lesion. The middle panel represents a stent cross-section in the mid-RCA. Due to the reduced noise level it is easier to evaluate the stent by using IR techniques. The lower panel represents a cross-section from the posterior descending coronary artery. Again, the abundant noise in FBP hinders the evaluation of the coronary artery with small diameter (91).
2. OBJECTIVES
2.1 Defining the impact of iterative reconstruction on calcium score and risk assessment
Despite the widespread use of novel reconstruction techniques the model based IR techniques have not yet been validated for coronary calcification measurements in clinical setting. We sought to assess the impact of iterative model reconstruction on coronary artery calcium quantification as compared to the standard FBP algorithm and HIR. In addition, we aimed to simulate the impact of IR on CAC score based risk stratification of an asymptomatic patient population.
2.2 Defining the influence of iterative reconstruction on image quality
Excellent image quality is the prerequsite of accurate plaque assessment and thus patient management. Advancements in image reconstruction techniques hold the potential to provide better visualisation of coronary arteries by improving image quality. We aimed to further elucidate the impact of novel IR techniques (HIR and IMR) as compared to FBP on subjective and objective image quality for coronary artery analysis.Comprehensive quantitative image quality analysis included signal- and contrast-to-noise calculations for proximal and distal coronary segments, whereas qualitative analysis aimed to evaluate the effects of IR on vessel sharpness and image noise on visual assessment.
2.3 Defining the changes in plaque quantification using iterative reconstruction
There is a growing body of evidence regarding the prognostic value of quantified coronary plaque volume for adverse events. We aimed to assess the impact of IMR on calcified plaque quantification as compared to FBP and HIR in coronary CTA. We hypothesize that novel model based IR could influence measured plaque volumes that ultimately influence individual risk assessment.
3. METHODS
3.1 Study design and study population for CAC based risk assessment
In a single center study, we performed CAC scoring in two distinct patient cohorts to evaluate the effects of novel IR methods. We enrolled and evaluated 63 symptomatic patients referred to clinically indicated cardiac CT examination due to suspected coronary artery disease. On the basis of CAC score differences observed in the study population we subsequently simulated the effect of IR on the risk stratification in an asymptomatic test population of 504 individuals. The test population is part of a National Health Examination survey, which is a population-based cardiovascular screening program (117). The population of a suburban town with 8000 adult inhabitants (age ≥ 20 years) were invited to this voluntary screening campaign between 2012 and 2014. The protocol included a comprehensive health interview survey, and examination survey with cardiac ultrasound, carotid intima-media-thickness, ECG and CAC scoring. Patients with known coronary artery disease and patients with irregular heart rate were excluded from this study. Baseline characteristics of the two patient cohorts are summarized in Table 2.The institutional ethics review board has approved our study and participants provided written informed consent.3.1.1 Coronary CT data acquisition and image analysis
All patients were scanned using a 256-slice CT-scanner (Brilliance iCT, Philips Healthcare, Best, The Netherlands). Oral beta-blockers were administered, if the heart rate exceeded 65 bpm. Non-contrast ECG-gated scans were acquired with prospective triggering at 78% of the RR-interval for CAC scanning using the following acquisition parameters: 128 mm × 0.625 mm collimation, 270 ms tube rotation time, 120 kV tube voltage, 30 mAs tube current.
We reconstructed axial images with 3 mm slice thickness using standard FBP, HIR (iDose4, Philips Healthcare, Cleveland, OH, USA) and IMR (IMR, Philips Healthcare, Cleveland, OH, USA) algorhitms. The vendor provides 1–7 levels for HIR and 1–3 levels for IMR noise reduction, we applied a medium level for both HIR (Level 4) and IMR (Level 2) technique. All images were reconstructed usind a single workstation (Extended Brilliance Workspace, Philips Healthcare, Best, The Netherlands), resulting in 3 datasets for each patient. Dose length product (DLP) of every examination was calculated and registered in an online database along with anamnestic and clinical parameters. To estimate effective radiation dose, the DLP was converted into millisieverts by multiplying it by a body region-specific scaling factor (k-factor = 0.014) [16]. Image noise was defined as the standard deviation of the CT attenuation values in a region of interest (ROI) placed in the aortic root. Identical 2 cm2 large ROIs were placed in the level of the left main coronary artery.
We performed CAC scoring on the axial images using a commercially available software application (Heartbeat-CS, Philips Healthcare, Best, The Netherlands) according the Agatston-method (19). The software identified the coronary artery plaques with an area of ≥1mm2 and a density of greater than 130 Hounsfield Units (HU). Subsequently coronary plaques were selected manually by the first observer (with 5 years of experience in cardiac CT) which allowed the semiautomatic software to calculate CAC scores. The software also automatically calculates area and volume for coronary lesions. All three reconstructions (FBP 3 mm, HIR 3 mm, IMR 3 mm) for all patients were assessed in a random fashion. In addition datasets of 20 randomly selected patients were assessed two times by a second observer (with 6 years of experience in cardiac CT) for calculating inter- and intra-observer variability. Patients were classified into the following risk
categories based on the CAC score values: 0 normal/no risk, 1–10 low, 11–99 low- intermediate, 100–399 intermediate, 400 < high risk (48).
3.1.2 Risk reclassification in the test patient cohort
In order to assess the effect of the different reconstruction techniques on risk stratification we implemented the reclassification rates derived from the study population to the larger test population. First, we calculated the differences in total CAC score values between the different reconstruction methods. Second, relative differences were calculated by dividing the average difference of two reconstructions by the average of the minuend’s total CAC score. Using the relative differences calculated on the study population, we multiplied the total CAC of the original 3mm FBP scores by the relative differences to get simulated HIR and IMR results on a patient basis. With using the simulated HIR and IMR calcium score values we determined how many patients shifted from one risk group to another. Reclassification ratio was calculated by dividing the number of people who shifted from a given risk group by the total test population.
3.2
Study design and population for image quality and plaque analysis
In a single center study,we enrolled 52 consecutive individuals who underwent routine clinical coronary CTA examination due to suspected CAD. Patients who had calcified and/or partially calcified plaque were included in the further analysis to study the effects of IR on plaque characteristics. As we used automated plaque quantification, partially calcified lesions were not further distinguished to predominantly non-calcified or predominantly calcified plaque types. Patients with previous bypass surgery or coronary stent implantation were excluded from the analysis. To minimize the impact of motion artifact on image quality, patients with arrhythmia and/or with a heart rate of ≥65 beat per minute were also excluded. Informed consent was waived by the institutional review board due to the retrospective design of the study. No additional data acquisition was performed in addition to routine care CTA examinations.
3.2.1 Scan protocol
All examinations were performed with a 256-slice scanner (Brilliance iCT 256, Philips Healthcare, Best, The Netherlands) with prospective ECG-triggering. Images were acquired in cranio-caudal direction during a single breath-hold in inspiration using the following imaging parameters: 128×0.625 mm detector collimation, 270 ms gantry rotation time, 120 kV tube voltage and 300 mAs tube current, field-of-view of 18 cm with a matrix of 512×512. We acquired images during the most quiescent mid-diastolic period with 3% padding. Iomeprol contrast media with an iodine concentration of 400 mg/ml (Iomeron 400, Bracco Ltd, Milan, Italy) was injected into an antecubital vein via an 18- gauge catheter and dual-syringe system. A triphasic injection protocol with 90–95 ml contrast agent was applied at a flow rate of 5.0-5.5 ml/s. We used bolus tracking technique with an ROI placed in the left atrium for proper scan timing.
All coronary CTA images were reconstructed with FBP, HIR and IMR on a dedicated workstation. We reconstructed all images with 0.8 mm slice thickness, 0.4 mm increment and medium cardiac kernel and applied a medium level for HIR (level 4 of 1–7) and IMR (level 2 of 1–3).
3.2.2 Qualitative and quantitative image quality analysis
We used a four point Likert-scale to analyze and classify subjective image quality parameters on axial slices (Figure 10) (118). Overall image quality was defined as a summary of image sharpness, image noise and blooming artifacts, if present and categorized as follows: non-diagnostic (0); moderate, considerable artifacts with diagnostic image quality (1); good, minor artifacts (2) and excellent (3) image quality.
Subjective noise was further analyzed and rated according to the graininess on the coronary CTA image: severe image noise (0); above average (1); average (2); no image noise (3).
Figure 10. Qualitative image quality analysis for overall image quality and image noise using a 4-point Likert scale (own material).
On quantitative analysis, proximal and distal segments of the left anterior descending artery, circumflex artery and right coronary artery were evaluated. As we aimed to assess the differences between proximal and distal coronary segments, middle coronary segments and side branches were not included in our analysis. Circular regions of interest (3–4 mm2) were manually placed in the coronary arteries and pericoronary fat to obtain median CT number in Hounsfield units. ROIs were placed in a homogenous region of the proximal and distal segments of LAD, CX and RCA and the correspondent areas of the pericoronary fat. Artifacts, inhomogeneous regions and plaques were carefully avoided.
Median image noise was determined as the standard deviation (SD) of the CT attenuation placed a circular ROI (200 mm2) within the aortic root at the level of the LM coronary ostium. The copy and paste function of the workstation was used to measure exactly the same ROIs at all three reconstruction datasets. Figure 11 demonstrates the measurements for the aorta and the proximal LAD for all three reconstructions. Signal-to-noise ratio is defined as the CT attenuation value in a given segment divided by the image noise.
Contrast to noise (CNR) ratios were calculated for all segments, as CNR = (HUlumen – HUfat) / image noise; HUlumen and HUfat represents the median CT attenuation in the coronary artery lumen and the pericoronary adipose tissue (119).
Figure 11. Quantitative image quality assessment on images reconstructed with FBP, HIR and IMR (own material).
Comparison of image quality across different reconstruction algorithms. On the upper row green circles represent measurements of image noise as defined by the standard deviation of HU in the aorta. Substantially lower standard deviation values (image noise) were detected using HIR and IMR as compared to FBP. We measured HU values in the given coronary segment and pericoronary fat to calculate SNR and CNR values.
HU: Hounsfield unit, SD: standard deviation.
3.3 Semi-automated plaque assessment
We performed semi-automated plaque characterization and quantification on the same study population as described in chapter 3.2. Scan protocol is also identical to the previously reported section (3.2.1).
We transferred the datasets present with any calcified or partially calcified plaque to a dedicated offline workstation (QAngio, version 2.1; Medis Medical Imaging Systems, Leiden, The Netherlands) for further plaque characterization (Figure 12). For plaque quantification each dataset was loaded separately and after automated segmentation of the coronary tree the proximal and distal end points of each plaque were set manually.
We took screen shots of anatomical fiducial markers to ensure that we analyzed the same plaques across the different reconstruction datasets. Fully automated plaque quantification was performed without any manual corrections of boundaries to exclude the influence of observer bias. After automated delineation of the outer and inner vessel- wall boundaries we used the following fixed thresholds: calcified plaque volumes (>130 HU), non-calcified plaque volumes with high attenuation (90–129 HU), intermediate attenuation (30–89 HU) and low attenuation (<30 HU) (25).
Figure 12. Plaque quantification with FBP, HIR and IMR technique (88).
Components of a mainly calcified atherosclerotic plaque in the proximal left anterior descending artery (LAD, marked with the blue line on the volumetric 3D reconstruction) are quantified using automated software after coronary segmentation (Panel A).
Consequently, the proximal (P) and distal (D) endpoints of the predominantly calcified plaque were selected on the CT images (Panel B). After centerline extraction the software automatically detected lumen (yellow) and outer vessel wall (orange) contours. Panel C shows the plaque measurements for all three reconstructions (C/1: FBP; C/2: HIR; C/3:
IMR) and the colors are indicated for various plaque components (white: calcified, >130 HU; dark green: non-calcified with high attenuation, 90–129 HU; light green: non- calcified with intermediate attenuation, 30–89 HU; red: non-calcified with low attenuation (<30 HU) Plaque volumes were 156.0 mm3 for FBP, 148.7 mm3 for HIR and 133.2 mm3 for IMR. Calcium volumes were 80.1 mm3 for FBP, 77.7 mm3 for HIR and 74.2 mm3 for IMR, respectively.
FBP: filtered back projection; HIR: hybrid iterative reconstruction; IMR: iterative model reconstruction, HU: Hounsfield units.
3.4 Statistical analyses
Continuous variables were presented as mean ± standard deviation or as medians with interquartile range as appropriate depending on the distribution of the values, whereas categorical variables were expressed as percentage. The Kolmogorov-Smirnov test was applied to evaluate normality of continuous variables. The inter- and intra-reader agreement between calcium measurements was calculated using Lin’s concordance correlation coefficient. The following descriptive scale was used for values of the concordance correlation coefficient: <0.90 Poor, 0.90–0.95 Moderate, 0.95–0.99 Substantial, >0.99 Almost perfect. Our data was not normally distributed for CAC score, area and volume and therefore these parameters were compared by using the Friedman test using Bonferroni–Dunn test for post hoc multiple comparisons. Differences between the cohorts were evaluated with Mann–Whitney test for continuous parameters and Chi- square test for categorical parameters. Differences in risk stratification were also assessed using Chi-square test with Bonferroni correction.
The number of assessable segments for image quality analysis was compared using chi- square test. Plaque features and image quality parameters (both quantitative and qualitative) of the IMR, HIR, and FBP images were not normally distributed and were compared by using the Friedman test with Bonferroni-Dunn test for post-hoc comparisons. The Wilcoxon signed rank test was used to assess the difference between image quality parameters of the proximal and distal vessel segments. The inter-reader reproducibility between image quality measurements was calculated using Lin's concordance correlation coefficient. The reproducibility of visual assessment of two observers was measured with kappa statistics interpreted as follows: κ < 0.20 poor, 0.21–
0.40 fair, 0.41–0.60 moderate, 0.61–0.80 good, 0.81–1.00 very good. Statistical analysis was performed using SPSS (IBM Corp, version 22.0, Armonk, NY, USA). A p value of
≤0.05 was considered statistically significant.
4. RESULTS
4.1 Calcium score based risk reclassification by novel iterative reconstruction algorithms
To define the effects of IR on calcium score based risk predictions we analyzed a total of 63 patients and performed a simulation on the test population of 504 individuals.
Characteristics of the study and test population is summarized in Table 2.
The median values of CAC scores were 147.7 (IQR 9.6–582.9), 107.0 (IQR 5.9–526.6) and 115.1 (IQR 9.3–508.3) for FBP, HIR and IMR, respectively. The minimum CAC score value was 0, whereas the maximum total CAC value was 2347.3 on FBP. The relative differences compared to FBP were −7.2 % for HIR and −7.3 % for IMR. Post- hoc analysis showed a significant difference in calcium scores between images reconstructed with HIR and IMR as compared to FBP (p < 0.001). However, calcium scores of images reconstructed with HIR and IMR did not differ (p = 0.86). Image noise decreased significantly with the use of IR: 40.1 ± 12.9 with FBP, 26.5 ± 7.2 with HIR and 13.7 ± 3.4 with IMR (p < 0.001). Calcium area values were 86.4, 74.6 and 67.0 mm2, while calcium volume values were 129.9, 112.2 and 100.8 mm3 for FBP, HIR and IMR, respectively. Both area and volume values were significantly lower with HIR and IMR as compared to FBP (p < 0.001), however there was no significant difference between HIR and IMR reconstructions (p = 1.000).
Table 2. Patient characteristics of the study and test population.
BMI: body mass index; PAD: peripheral arterial disease; DLP: dose length product
Patient data Study population Test population p value
(N=63) (N=504)
Age (years) 60.1 ± 11.0 64.6 ± 10.3 0.002
BMI (kg/m2) 28.3 ± 4.5 28.7 ± 5.0 0.970
Male gender, n (%) 37 (58.7) 211 (41.9) 0.011
Cardiovascular risk factors, n (%)
Hypertension 45 (71.4) 295 (58.5) 0.009
Diabetes mellitus 12 (19.0) 82 (16.3) 0.334
Dyslipidemia 34 (54.0) 236 (46.9) 0.157
Smoking 28 (44.4) 197 (39.0) 0.212
PAD 6 (9.5) 36 (7.2) 0.319
Radiation dose
DLP (mGy×cm) 31.8 ± 6.4 93.0 ± 28.2 <0.001
Effective dose
(mSv) 0.45 ± 0.2 1.2 ± 0.5 <0.001
Figure 13. Coronary artery calcium score based risk categories of the study population (120). Minor changes were seen due to the utilization of HIR and IMR compared to FBP.
CACS: Coronary artery calcium score; FBP: Filtered back projection; HIR: Hybrid iterative reconstruction; IMR: Iterative model reconstruction
As compared to FBP, the utilization of HIR and iterative model reconstruction resulted in a modest reclassification rate among the low and intermediate groups of the study population; 6 of 63 patients were reclassified using HIR algorithm as compared to FBP:
2 high-risk patients were moved to the intermediate group, while two patients with intermediate risk to the low-intermediate group and two patients with low-intermediate risk to low the risk group (Figure 13). The use of IMR also lead to reclassification of six patients as compared to FBP: 2 high-risk patients were moved to the intermediate group, whereas 3 intermediate risk patients were moved to the low-intermediate and 1 patient with low-intermediate risk was moved to the low-risk group. There was no significant difference between the three reconstruction techniques in risk categories (p = 0.998).
The median CAC scores of the test population with FBP was 22.3 (IQR 0–199.2) (range of 0–4549.2). The relative differences found in the study population were used to simulate the effect of HIR and IMR in the larger test patient cohort. Based on our simulation the extrapolation of relative differences obtained by iterative algorithms yielded 2.4 % (12 patients) change in risk stratification in 504 individuals (Figure 14). Reclassification rate did not differ significantly among the 3 reconstructions (p = 0.998). All 12 patients were moved to lower risk groups based on their CAC values: 6 high-risk individuals were reclassified into intermediate group, and five patients were moved from the intermediate to low-intermediate category. Representative images are shown on Figure 15 to demonstrate the effects of IR on image noise and calcium score values.
The inter-observer reproducibility of calcium scoring was substantial in images reconstructed with FBP (concordance correlation coefficient 0.973–0.986) and almost perfect reproducibility was found using IR techniques (HIR and IMR 0.990–0.997). Intra- observer correlation values were assessed in 20 patients with almost perfect concordance correlation coefficient values in all reconstructions (0.996–1).
Figure 14. Risk reclassification based on CAC scores in the test population (120). Risk categories of the asymptomatic test population based on the CAC scores and the impact of HR and IMR. Based on our simulation, IR yielded a moderate reclassification rate of 2.4 % of 504 asymptomatic patients of a cardiovascular screening program. CACS:
Coronary artery calcium score; FBP: Filtered back projection; HIR: Hybrid iterative reconstruction; IMR: Iterative model reconstruction
Figure 15. A representative case reconstructed with FBP, HIR and IMR (120).
Axial cardiac CT images with 3 different reconstruction techniques (FBP, HIR, IMR) at the level of the middle segment of the LAD. In this case calcified plaques are visible in the proximal and middle LAD segments (arrows). Calcified plaques are identified by dedicated semiautomatic software, however excessive noise seen on FBP image hinders CAC measurements. Total CAC scores were: 2377.6 for FPB, 2202.6 for HIR and 2137.3 for IMR.
4.2 Comparison of image quality parameters using different reconstructions
This study consisted of 52 patients who underwent coronary CTA at our institute. The image quality analysis included 468 triplets of coronary artery segments reconstructed with IMR, HIR and FBP. We identified 41 isolated calcified or partially calcified plaques;
25 plaques were located in the LAD, 10 plaques in the RCA, 5 in the LCX and 1 in the left main coronary artery. Patient characteristics are summarized in Table 3.
Qualitative image analysis showed diagnostic image quality (rated as 1–3) in 453 segments (96.8%) with IMR, 437 (93.4%) with HIR and 407 (87.0%) with FBP (p <
0.01). Overall subjective image quality significantly improved with the application of HIR as compared to FBP, and further improved with IMR (p < 0.01 all) (Figure 16/A).
IMR yielded lower image noise by qualitative assessment as compared to HIR and FBP (p < 0.01 all). The majority of the coronary segments were rated as having no image noise (395/468, 84.4%), or average image noise (73/468, 15.6%) in the datasets reconstructed with IMR technique (Figure 16/B). The inter-reader reliability between the two readers was good for overall image quality (κ: 0.71), and image noise (κ: 0.73).
Table 3. Demographic characteristics and imaging parameters.
SD: standard deviation; IQR: interquartile range; BMI: body mass index; PAD: peripheral arterial disease; DLP: Dose Length Product
Parameters N = 52
Age (years), median [IQR] 66.0 [59.0-71.8]
BMI (kg/m2), median [IQR] 27.5 [25.0-30.8]
Female gender, n (%) 13 (25)
Cardiovascular risk factors, n (%)
Hypertension 41 (78.8)
Diabetes 9 (17.3)
Dyslipidemia 28 (53.8)
PAD 7 (13.5)
Stroke 5 (9.6)
Smoking 20 (38.5)
Prior use of beta blocker, n (%) 22 (42.3) CTA characteristics, median [IQR]
Contrast agent (ml) 95.0 [90.0-95.0]
DLP (mGy×cm) 308.0 [307.0-308.0]
Average heart rate (beats/min) 57.0 [52.0-60.0]
Figure 16. Visual assessment of image quality (88).
The use of IMR was associated with improved overall image quality (Panel A) and lower image noise (Panel B) as compared to HIR and FBP. FBP: Filtered back projection; HIR:
Hybrid iterative reconstruction; IMR: Iterative model reconstruction.