Novel clinical perspectives of cardiac computed tomography
Thesis
Doctor of the Hungarian Academy of Sciences
Dr. Pál Maurovich Horvat
Semmelweis University Heart and Vascular Center
Budapest 2018
Table of Content
Abbreviations ... 5
1 Introduction ... 7
2 Background ... 9
2.1 Cardiac CT: technical developments and challenges ... 9
2.2 Imaging coronary artery disease with computed tomography ... 12
2.2.1 Morphologic plaque characteristics ... 14
2.2.2 Functional plaque characteristics ... 28
2.3 Epicardial adipose tissue ... 33
2.4 Reporting coronary CTA findings ... 35
3 Aims ... 36
3.1 To improve cardiac CT image acquisition safety and quality ... 36
3.2 To improve coronary atherosclerotic plaque assessment ... 36
3.3 To study atherogenic adipose tissue compartments ... 36
3.4 To develop novel data collection system for cardiac CT ... 36
4 Methods ... 37
4.1 Cardiac CT image acquisition and safety ... 37
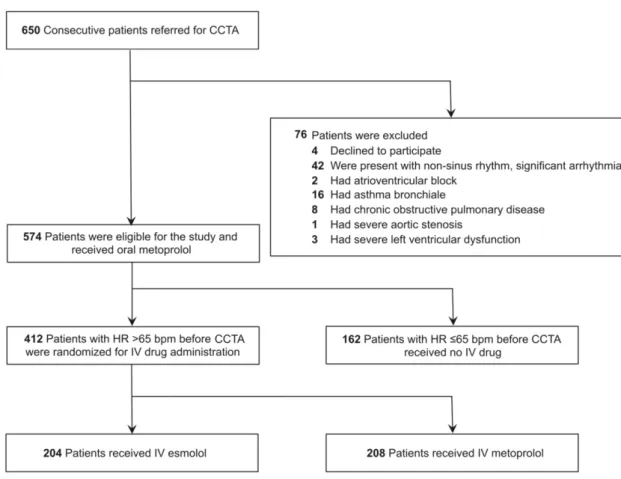
4.1.1 Heart rate control with ultra-short acting beta-blocker ... 37
4.1.2 Contrast injection protocol optimization ... 40
4.1.3 Effect of image reconstruction ... 42
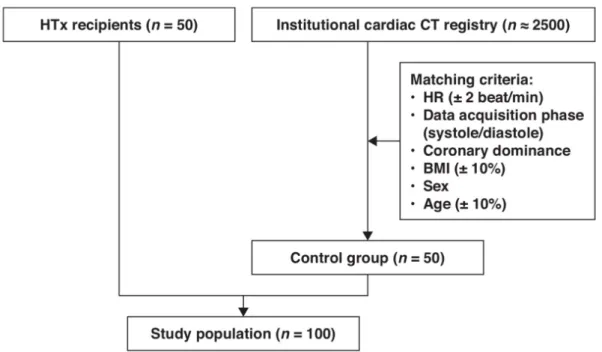
4.1.4 Image quality in heart transplanted patients ... 46
4.2 Atherosclerotic plaque imaging by cardiac CT ex vivo investigations ... 50
4.2.1 The identification of novel signature of high-risk plaques ... 50
4.2.2 Attenuation pattern-based plaque classification ... 51
4.2.3 Multimodality plaque imaging ... 56
4.2.4 Performance of CT versus invasive coronary angiography to detect plaques ... 58
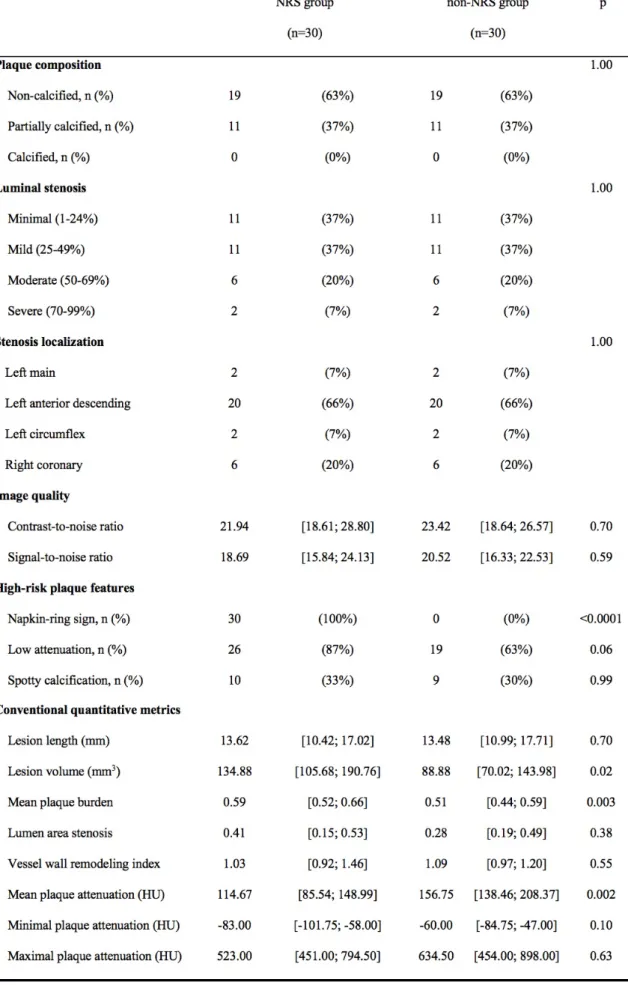
4.2.5 Coronary CTA based radiomics to identify napkin-ring plaques ... 60
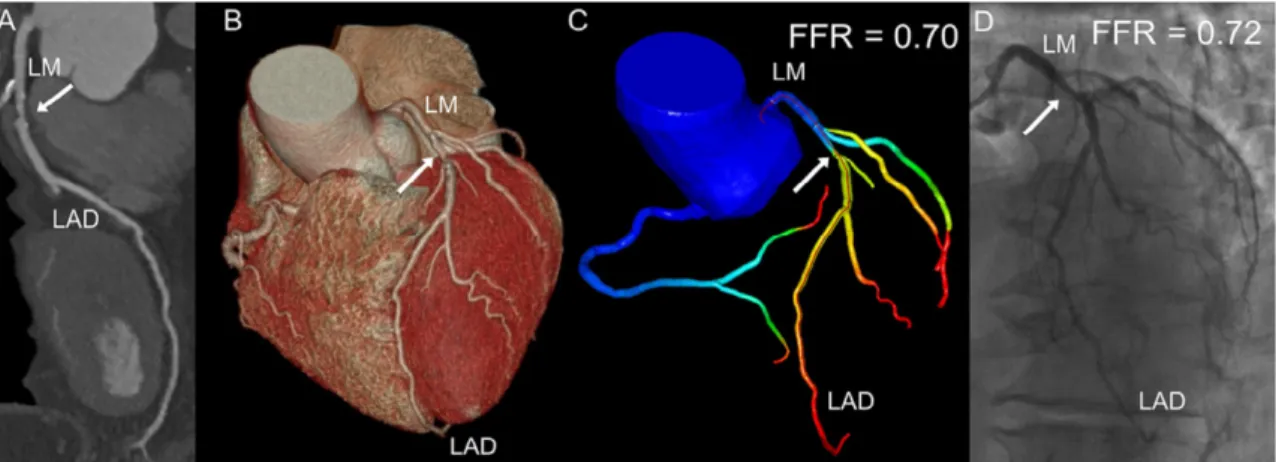
4.2.6 Cardiac CT based FFR simulation ... 65
4.3 Adipose tissue compartments and their heritability ... 67
4.3.1 Epicardial fat and coronary artery disease ... 68
4.3.2 Heritability of epicardial adipose tissue quantity ... 71
4.4 Structured clinical reporting and data collection ... 75
4.4.1 Performance of automated structured reporting ... 75
5 Results ... 78
5.1 Novel findings regarding CT image quality and image acquisition safety ... 78
5.1.1 The efficacy of ultra-short acting b-blocker in heart rate control ... 78
5.1.2 The effect of the novel four-phasic contrast material injection protocol ... 81
5.1.3 The impact of iterative reconstruction on calcified plaque burden ... 83
5.1.4 The image quality of coronary CT angiography in heart transplanted patients ... 85
5.2 The main findings of studies on atherosclerotic plaque assessment ... 89
5.2.1 The napkin-ring sign ... 89
5.2.2 Attenuation pattern-based plaque classification ... 91
5.2.3 Systemic comparison of CT, IVUS and OCT to identify high-risk plaques ... 95
5.2.4 Quantity of plaques by coronary CTA versus invasive coronarography ... 100
5.2.5 Coronary CTA radiomics to identify plaques with napkin-ring sign ... 102
5.2.6 Diagnostic performance of on-site FFR-CT ... 108
5.3 Findings regarding epicardial adipose tissue compartment ... 111
5.3.1 Intrathoracic fat, biomarkers and coronary Plaques ... 111
5.3.2 Heritability of epicardial adipose tissue quantity ... 114
5.4 Results on structured clinical reporting performance ... 117
5.4.1 Structured reporting ... 117
6 Discussion ... 120
6.1 Cardiac CT image quality ... 120
6.2 Imaging coronary atherosclerotic plaques ... 130
6.2.1 Ex vivo studies ... 130
6.2.2 In vivo studies ... 134
6.3 Adipose tissue and coronary artery disease ... 139
6.4 Structured reporting ... 142
7 Summary of novel scientific findings ... 145
8 References ... 148
9 List of publications of the applicant ... 182
9.1 International publications related to the present thesis ... 182
9.2 Publications in Hungarian language related to the present thesis ... 186
9.3 Editorials related to the present thesis ... 187
9.4 Book chapters not related to the present thesis ... 187
9.5 International and Hungarian publications not related to the present ... 189
9.6 Review articles ... 201
9.7 Editorials, case reports, short communications, position papers ... 204
9.8 Scientometric data ... 205
Acknowledgements ... 208
Abbreviations
ACC American College of Cardiology ACS Acute coronary syndrome
AHA American Heart Association AIT Adaptive intimal thickening
AUC Area under the receiver-operator characteristics curve BMI Body mass Index
BP Blood pressure
CAD Coronary artery disease
CAD-RADS Coronary artery disease - reporting and sata system CAV Cardiac allograft vasculopathy
CI Confidence interval
CFD Computational fluid dynamics
CM Contrast media
CNR Contrast to noise ratio CP Calcified plaque CT Computed tomography
CTA Computed tomography angiography CV Coefficient of variation
CX Circumflex coronary artery
DICOM Digital imaging and communications in medicine
DZ Dizygotic
EAT Epicardial adipose tissue ECG Electrocardiogram
EDS Effective luminal diameter stenosis EDTA Ethylenediaminetetraacetic acid EFA Early fibroatheroma
ELISA Enzyme-linked immunosorbent assays ESS Endothelial shear stress
FBP Filtered back projection
FDA Food and Drug Administration FFR Fractional flow reserve
Fib Fibrous plaque
GLCM Gray level co-occurrence matrix GLRLM Gray level run length matrix GWAS Genome-wide association studies H&E Hematoxylineosin
HIR Hybrid iterative reconstruction
HR Heart rate
HU Hounsfield units
hsCRP High-sensitivity c-reactive protein HTX Heart transplantation
ICA Invasive coronary angiography ICC Intraclass correlation coefficient IMR Iterative model reconstruction IQR Interquartile range
IRB Institutional review board
IV Intravenous
IVUS Intravascular ultrasound LAD left anterior descending artery LDL Low-density lipoprotein LFA Late fibroatheroma LM Left main coronary artery
MACE Major adverse cardiovascular event MCP-1 Monocyte chemoattractant protein 1 MDCT Multidetector-row computed tomography MESA Multiethnic Study of Atherosclerosis MI Myocardial infarction
MZ Monozygotic
NCP Non-calcified plaque
NCEP ATP National Cholesterol Education Program Expert Panel on Detection, Evaluation, and Treatment of High Blood Cholesterol in Adults
NICE National Institute for Health and Care Excellence NRS Napkin-ring sign
OR Odds ratio
OCT Optical coherence tomography OFDI Optical frequency domain imaging PAI-1 Plasminogen activator inhibitor-1 PAP Plaque attenuation pattern
PCP Partially calcified plaque PIT Pathological intimal thickening RCA Right coronary artery
RIA Radiomics Image Analysis ROC Receiver operating characteristics ROI Region of interest
SAP Stable angina pectoris
SCCT Society of Cardiovascular Computed Tomography SD Standard deviation
SE Semmelweis Egyetem
SIS Segment involvement score SISi Segment involvement score index SSS Segment stenosis score
SSSi Segment stenosis score index TCFA Thin-cap fibroatheroma TNFα Tumor necrosis factor α
TUKEB Tudományos és Kutatásetikai Bizottság VAT Visceral adipose tissue
VH-IVUS Virtual histology intravascular ultrasound
1 Introduction
Atherosclerosis of the coronary arteries is the leading cause of morbidity and mortality in industrialised nations.1 The most dreadful manifestation of coronary artery disease (CAD) is myocardial infarction (MI) or sudden cardiac death with the underlying mechanism of vulnerable plaque rupture and subsequent intracoronary thrombus formation. Acute MI and sudden cardiac death remain the first manifestations of CAD in the majority of the population.2 Most individuals do not, therefore, experience any symptoms or warning signs before the coronary event (acute coronary syndromes [ACS] or sudden cardiac death) occurs.
The number of people who die from cardiovascular diseases, mainly from coronary heart disease and stroke, will increase to reach 23.3 million by 2030 from an estimated 17.3 million deaths in 2008. Cardiovascular diseases are projected to remain the single leading cause of death by 2030 globally.3 Cardiovascular diseases are the largest single cause of death, accounting for about 3.8 million deaths each year, or 45% of all deaths across European Society of Cardiology member countries. Ischemic heart disease was the leading cause, responsible for 1.7 million deaths (20% of all deaths) with stroke responsible for 970 391 deaths (11% of all deaths). After cardiovascular diseases, cancer was the next most common cause of death accounting for 1.9 million cases or 23% of all deaths.4. The age-standardised death rates per 100 000 from ischemic heart disease is approximately 400 in Hungary, whereas the death rate is below 100 in France.4
Diseases of the heart and circulatory system have major human as well as economic costs, mainly due to the fact that cardiovascular disease are being responsible for the largest number of premature deaths before the age of 75 years. Importantly, cardiovascular disease causes a greater proportion of deaths among women (51%) than men (42%) overall. Almost half of these deaths were due to coronary heart disease alone. Coronary artery disease is estimated to cost the European economy €60 billion a year. Of the total cost of CAD in the European Union, around 33% is due to direct health care costs, 29% to productivity losses and 38% to the informal care of people with CAD.
Considerable efforts are ongoing to predict where acute coronary events will happen on an individual plaque level. Histological investigations have revealed three distinct features of plaques associated with acute coronary events: rupture; erosion; and calcified nodule.5 Two-thirds of luminal thrombi in acute events result from ruptured atherosclerotic lesions characterized by a necrotic core covered by a thin layer of fibrous cap.5 Plaques vulnerable to
rupture might have the same morphological characteristics as ruptured plaques, but with an intact thin fibrous cap.6 These lesions - termed thin-cap fibroatheroma (TCFA), with a cap thickness of <65 μm—are considered to be the precursor lesions of plaque rupture, and referred to as ‘vulnerable plaques’.5
Preventing acute coronary events by identifying patients at risk seems to be the only effective strategy to reduce the burden of cardiovascular disease and improve mortality and morbidity rates. The mechanisms leading to adverse events from atherosclerotic disease are clearly more complex than initially assumed, explaining our difficulties in accurately predicting myocardial infarction at an individual level. Traditional risk assessment strategies such as the Framingham risk score has been shown to predict 10-year risk of MI; however, the prediction at an individual level is quite poor. Furthermore, it is challenging for the clinicians and patients alike to conceptualise and act upon a 10-year risk estimate. Therefore, we must strive for personalized risk assessment that integrates specific imaging information on the atherosclerotic plaques and systemic factors that increase the risk for disease activity and vascular thrombosis.
Next generation CAD phenotyping using advanced imaging techniques could improve our understanding of the atherosclerotic disease process and enable efficient triaging of patients into treatment categories ranging from continued risk factor control to coronary arterial revascularization.7,8 Therefore, the main goals of my research work reflect these notions. In all research projects that I have been involved with or lead since my PhD degree have focused on four main topics: 1) improving the quality and safety of coronary CTA imaging, 2) improving the ability of coronary CTA to identify the high-risk plaque and high-risk patients, 3) assessing complex interactions between adipose tissue compartments and coronary artery disease and 4) improving the communication of coronary CTA results with referring physicians. The structure of my doctoral thesis follows this course of thoughts and reflects my research path.
2 Background
2.1 Cardiac CT: technical developments and challenges
After the first description of CT angiography (CTA) in 1992,9,10 further technological advances, such as: more powerful X-ray tubes, faster gantry rotation times, multiple parallel detector rings and decreased slice thickness were introduced,11,12 that allowed the visualization of the coronary arteries.13 Coronary CTA has emerged as a non-invasive alternative to invasive coronary angiography (ICA) for the diagnosis of obstructive CAD. With its excellent sensitivity and negative predictive value,14,15 coronary CTA is a robust diagnostic test to rule out severe coronary stenosis and it is widely used as a “gate-keeper” for ICA.16,17 Multidetector-row CT (MDCT) permits imaging of calcified coronary atherosclerotic plaque using native scan and the additional detection of noncalcified plaque and luminal narrowing by using contrast-enhanced image acquisition.18 The newest MDCT technology with gantry rotation times of 240-350 milliseconds, temporal resolution of 75-106 milliseconds, coverage in z-direction of 3.2-16 cm, and isotropic resolution of 0.4 mm now provides technical prerequisites for coronary atherosclerotic plaque imaging. Thus, research targeting the qualitative and quantitative assessment of coronary plaque, including assessment of plaque size, composition, and remodelling became feasible.
Coronary CTA permits the non-invasive evaluation of the coronary atherosclerotic plaque, not just the coronary lumen.19 Coronary CTA provides information regarding the coronary tree and atherosclerotic plaques beyond simple luminal narrowing and plaque type defined by calcium content.18,19 These novel applications will improve image guided prevention, medical therapy, and coronary interventions. The ability to interpret coronary CTA images beyond the coronary lumen and stenosis is of utmost importance as we develop personalized medical care to enable therapeutic interventions stratified on the basis of CAD characteristics.
Coronary CTA with its high sensitivity and high negative predictive value is an established diagnostic tool for the evaluation of coronary artery disease.20 Despite the great advances in scanner technology, the image quality remains highly dependent on heart rate (HR) and the regularity of cardiac rhythm.21,22 Current guidelines recommend that HR should be <65 beats/min and optimally <60 beats/min to achieve excellent image quality and low effective radiation dose.23 Metoprolol is the first-line intravenous (IV) b-blocker for HR lowering in
patients undergoing coronary CTA.24 However, a recent survey has revealed that 50% of centers allow an HR >70 beats/min for coronary CTA, mainly because of concerns regarding potential side effects of b-blocker administration (mainly hypotension and bradycardia).25 The half-life of IV metoprolol is approximately 3 to 7 hours; therefore, if adverse effect occurs as a result of the HR-lowering medication, it may debilitate the patient for hours. These data indicate the need for a safe, short-lasting HR control in the scanner rooms.20
Esmolol is an ultrashort-acting cardioselective IV b-receptor blocking agent with a rapid onset (within 2-3 minutes) and ultrashort duration of action (mean half-life [t1/2]= 9 minutes).26 The rapid onset and offset of effects of esmolol provide an element of safety not previously available with longer-acting b-adrenoceptor antagonists.27 During coronary CTA, short and effective HR control is desirable; therefore, esmolol might be a good alternative to the standard of care metoprolol. There is a lack of evidence regarding the efficacy and safety of IV esmolol administered in a body weight-independent simplified protocol. Furthermore, no direct comparison of esmolol vs metoprolol administration for HR control during coronary CTA is available.
The other crucial factor in coronary CTA image acquisition is the proper iodinated contrast media (CM) enhancement of the coronaries and the left side of the heart. Therefore, high flow rate injection, high concentration and relatively large volume of CM is used in daily practice. However, the highly viscous iodinated CM and the high injection flow rate increase the risk of vessel wall injury resulting in CM extravasation. Contrast media extravasation is a well-known complication of CTA, with an incidence rate of 0.3–1.3%.28-33 In case of CM extravasation, image quality is deteriorated due to insufficient intraluminal attenuation, leading to an increased number of repeated CTA examinations, which results in extra radiation doses, additional CM load and increased costs.34,35 Extravasation usually resolves without any serious complications; however, in some instances it can lead to severe injuries.36 CM has toxic effects on perivascular tissues that may trigger acute and chronic local inflammatory response, tissue necrosis or compartment syndrome.31,32,37,38 It has been shown that female gender, elderly age, history of chemo- or radiotherapy, low muscle volume and peripheral locations other than the cubital region as injection site increase the risk of CM extravasation.29,30,39 Three-phasic CM injection-protocol is widely used to achieve optimal attenuation during coronary CTA, which results in high contrast enhancement in the left side of the heart and in a lower enhancement in the right.40,41 The traditional three-phasic injection-protocol starts with a high flow rate CM injection (>5 ml/s), continues with a mixture of CM and saline, and finishes with a saline chaser
bolus. The relatively large quantity of high viscosity CM could place an increased strain on the vein’s wall, which increases the risk of extravasation. Extending the three-phasic injection- protocol with an initial slower saline flux of pacer bolus right before CM administration may open the possibly collapsed vein lumen with less stress on the vessel wall, thus when the contrast material enters the lumen with a higher flow rate, the already pre-dilated lumen is less likely to rupture.
The third factor that greatly influences coronary CTA image quality is linked to the image reconstruction techniques. Image quality is especially important in quantitative plaque assessment. Automated plaque quantification with coronary CTA allows highly reproducible assessment of plaque dimensions, however its performance is influenced by image quality.42-44 Most coronary CTA studies have been reconstructed with noise prone filtered back projection (FBP). With hardware evolution, vendors facilitated the introduction of computationally intense iterative image processing techniques, potentiating low-dose CT imaging with improved image quality.45-48 Hybrid iterative reconstruction (HIR) utilizes statistic-model based denoising both in raw and image domains, providing up to 55% noise reduction for cardiac image acquisition at standard tube settings.49 Moreover, two recent studies demonstrated that HIR has no significant effect on plaque morphology assessment.50,51 Three-dimensional raw data based reconstruction techniques were introduced with forward modelling of system geometry (focal spot size, shape of X-ray beam, interactions of emitted photons with tissue and detector) additionally to statistical modeling.52 Preliminary data showed the potential of model based iterative reconstruction techniques to achieve more robust noise reduction and/or improved image quality of coronary CTA.53,54 There is a growing body of evidence regarding the prognostic value of quantified coronary plaque volume for adverse events. Our study group previously demonstrated significant changes in coronary calcium scores using novel iterative reconstruction algorithms.55 Novel model based iterative reconstruction could influence measured plaque volumes that ultimately influence individual risk assessment.
The image quality and radiation dose of coronary CTA in patients who underwent heart transplantation (HTx) is of great importance. Cardiac allograft vasculopathy (CAV) is the leading cause of death during the first year HTx. The overall frequency of CAV at 1, 5, and 10 years after transplantation is 8%, 30%, and 50%, respectively.56 CAV is characterized by diffuse concentric intimal hyperplasia.57 Because of the denervated transplanted hearts, patients do not experience symptoms related to ischemia; therefore, early diagnosis of CAV is challenging. International guidelines recommend annual or biannual invasive coronary
angiography for the assessment of coronary status. However, invasive coronary angiography has limited diagnostic accuracy to detect CAV because of the diffuse and concentric manifestation of the disease. Furthermore, invasive coronary angiography does not provide information regarding the coronary wall; therefore, intravascular ultrasound (IVUS) or optical coherence tomography (OCT) is suggested as a complementary imaging test.58 The combination of invasive coronary angiography with intravascular imaging techniques increases sensitivity, but their routine use increases costs and rates of procedural complications; therefore, it is considered optional for CAV assessment.59 In addition, the International Society for Heart and Lung Transplantation consensus statement does not recommend the routine use of intravascular ultrasound for CAV assessment.58
Coronary CTA allows non-invasive visualization of the coronary artery wall and lumen with a high diagnostic accuracy.18 It can detect 1.5-2 times more coronary segments with coronary atherosclerotic plaques than does invasive coronary angiography.60 Notably, the absence of parasympathetic and sympathetic innervation of the transplanted hearts results in higher resting HRs, which may compromise the diagnostic performance of coronary CTA.
Moreover, because of their higher HRs, retrospective ECG-gating has been used for HTx recipients, which results in higher radiation dose. These concerns precluded the widespread use of coronary CTA in HTx recipients.61 Prospectively ECG-triggered coronary CTA would be desirable because of its low radiation dose, but it requires a low HR (generally <65 beats/min).
The HTx recipients have higher but steady HR with minimal HR variability because of the lack of autonomous innervation. The steady HR of HTx recipients might provide a unique opportunity to scan these patients with low radiation dose and achieve good image quality.
2.2 Imaging coronary artery disease with computed tomography
The identification of patients at high risk of developing acute coronary events remains a major challenge in cardiovascular imaging.62-64 Current diagnostic strategies focus predominantly on the detection of myocardial ischaemia and haemodynamic luminal narrowing, but not the detection and characterization of coronary atherosclerotic plaques.2,65 This strategy is based on the evaluation of symptomatic patients and ignores the larger problem of a major adverse coronary events occurring as the first (and only) manifestation of CAD.
In post-mortem studies, most acute coronary events are found to be caused by sudden luminal thrombosis due to plaque rupture.6,66,67 The morphology of atherosclerotic plaques that
are prone to rupture is distinct from stable lesions (Figure 1a), which provides a unique opportunity for non-invasive imaging to identify high-risk plaques before they lead to adverse clinical events.68,69 Moreover, the assessment of coronary plaque composition and size are potentially more important than traditional detection of luminal stenosis for predicting devastating acute coronary events.67,70-72
Histological investigations have revealed three distinct features of plaques associated with acute coronary events: rupture; erosion; and calcified nodule.5 Two-thirds of luminal thrombi in acute events result from ruptured atherosclerotic lesions characterized by a necrotic core covered by a thin layer of fibrous cap (Figure 1b).5 Plaques vulnerable to rupture might have the same morphological characteristics as ruptured plaques, but with an intact thin fibrous cap.6 These lesions – termed thin-cap fibroatheroma (TCFA), with a cap thickness of <65 μm – are considered to be the precursor lesions of plaque rupture.5 The spatial resolution of current CT scanners (≈400 μm) precludes the morphometric analysis of fibrous cap by coronary CTA.73 Histopathological investigations suggest that plaques prone to rupture are enlarged in all three spatial dimensions.5,74 In TCFAs the necrotic core length is ~2-17 mm (mean 8 mm) and the area of the necrotic core in 80% of cases is >1.0 mm2.5 These dimensions are over the plaque detection threshold (>1 mm plaque thickness) for coronary CTA.75 Moreover, the majority of TCFAs occur in the proximal portions of the main coronary arteries, where vessel diameter is largest, and coronary CTA has the highest image quality and accuracy for the plaque detection.5,76 In modern CT scanners, the detection and quantification of some features of high-risk lesions might, therefore be feasible.
2.2.1 Morphologic plaque characteristics
Low attenuation plaques
Lesions leading to ACS often have a large necrotic lipid-rich core; therefore, the CT differentiation between plaques containing lipid-rich material and plaques with predominantly fibrous components is desirable for prediction of ACS.69 Traditionally, coronary CTA classifies plaques according to the presence or absence of calcified components, thereby differentiating
Figure 1 | The morphology and functional characteristics of stable and vulnerable plaques. a | Stable fibrocalcific lesion with calcification and small lipid pools. The plaque leads to mild narrowing of the lumen; and there is no ischaemia after the lesion (FFR >0.8; green). ESS near the plaque is in the normal physiological range indicating undisturbed flow. b | Rupture prone vulnerable plaque with a large lipid-rich necrotic core, thin fibrous cap, neovascularization, spotty calcium and presence of inflammatory cells. Despite the positively remodelled vessel wall at the site of the plaque, the lesion causes severe luminal narrowing and ischaemia (FFR <0.8; red). The downstream plaque region with low and oscillatory ESS promotes plaque growth, whereas the upstream low ESS at the shoulder regions is more inflamed (indicated by presence of macrophages), which might lead to plaque destabilization. High ESS at the most stenotic part can trigger plaque rupture. Abbreviations: ESS, endothelial shear stress; FFR, fractional flow reserve.
between calcified (CP), partially-calcified or mixed (PCP), and non-calcified plaques (NCP).
The differentiation between CP components and NCPs was feasible even with early multidetector CT technology (such as 4-slice CTs used in the late 1990s).77,78 However, the classification of NCPs into lipid-rich and fibrous lesions on the basis of CT attenuation values (measured by HU) remains challenging.
Some investigators have correlated coronary CTA plaque assessment with the clinical reference standard IVUS, and report low CT attenuation on average for lipid-rich plaques.79 Non-calcified plaques with high CT attenuation correlated with fibrous tissue and those with low densities correlated with necrotic core and fibrofatty tissue as assessed by VH-IVUS.80 In histogram analysis of the intraplaque pixel CT numbers, lipid-rich plaques have a higher percentage of pixels with low HU values compared with plaques of predominantly fibrous components.81 This observation was validated in an ex vivo study that showed that the relative area (area >25%) of intraplaque pixels with <60 HU could accurately detect lipid-rich atherosclerotic lesions (sensitivity, 73%; specificity, 71%).82 Moreover, low CT numbers were measured in TCFAs identified by optical coherence tomography (OCT; the standard clinical reference for fibrous cap thickness measurements and necrotic lipid-rich core detection) compared with stable lesions (35-45 HU versus 62-79 HU; P <0.001).83,84 However, the variability of CT values within plaque types is wide. Despite the differences in mean densities between fibrous plaques and lipid-rich plaques, almost all investigators have reported a substantial overlap of densities, which prevented the reliable sub-classification of NCPs.79,80 Furthermore, CT measurements of coronary plaques are influenced by several factors, such as the concentration of adjacent intraluminal iodinated contrast agent, plaque size, image noise, tube voltage, slice thickness, and the reconstruction filter.18,85-87 The reliable differentiation between lipid-rich and fibrous lesions made solely on the basis of CT attenuation is, therefore, not yet feasible.19 New automated plaque quantification software tools, with scan specific adaptive attenuation threshold settings, can potentially overcome some of these limitations and might improve CT number-based plaque component quantification.88,89 Despite the challenges associated with CT attenuation-based plaque characterization, low CT numbers seem to be a consistent feature of lipid-rich plaques. Low-density plaques, defined by <30 HU average attenuation, were more often seen in patients with ACS than in those individuals with stable angina pectoris (SAP) (79% versus 9%; P <0.0001).90 The same investigators compared the characteristics of ruptured fibrous cap culprit lesions in patients with ACS with the intact fibrous cap plaques of patients with SAP. Again, the low plaque attenuation was defined as <30 HU, and 88% of ruptured plaques had a low CT attenuation, compared with 18% of the stable
lesions (P <0.001).91 Similarly, other investigators have also reported lower mean CT densities of NCPs in patients with ACS versus SAP (40-86 HU versus 97-144 HU; P <0.01).92-94
Establishing a simple CT number cut-off value across an entire plaque that permits the reliable differentiation between lipid-rich and fibrous atherosclerotic lesions is difficult.
However, quantification of CT number variability and identification of focal areas of low CT attenuation are methods that might aid a more-accurate differentiation of vulnerable plaques by coronary CTA. Moreover, culprit lesions in patients with ACS have significantly lower average CT numbers compared with patients who have SAP, suggesting that low CT attenuation is an established high-risk plaque feature (Figure 2).
Positive remodelling
Rupture-prone plaques might not lead to significant luminal narrowing, owing to the effect of positive remodelling.95 Positive remodelling describes the compensatory enlargement of the vessel wall that occurs at the site of the atherosclerotic lesion as the plaque size increases, resulting in the preservation of luminal area.96 In histopathology studies, positive remodelling is associated with the abundance of macrophages and increased necrotic core.97 Coronary CTA can measure the outer vessel wall and lumen dimension.80,98 The remodelling index is calculated as the vessel cross-sectional area at the site of maximal stenosis divided by the average of proximal and distal reference segments’ cross-sectional areas.98 A remodelling index threshold of ≥1.1 was suggested for the definition of positive remodelling visualized by coronary CTA, whereas some authors use ≥1.05 or >1.0 as the cut-off point on the basis of IVUS studies.99 Automated software now permits the easy quantification of the remodelling
Figure 2| Representative images of plaque coronary CT angiography-based plaque types
index.88 The remodelling index assessed by coronary CTA correlates well with IVUS measurements; however, coronary CTA has a trend towards overestimation of remodelling index (95% CI of the mean difference 0.01-0.08; p=0.005).88,99 Consistent with histopathological data, lesions with positive remodelling on coronary CTA have a higher plaque burden, a larger amount of necrotic core and a higher prevalence of TCFA assessed by VH-IVUS when compared to lesions without positive remodelling.100
Furthermore, in two correlative studies comparing coronary CTA with OCT, the CT-derived remodelling index was higher in TCFA compared with non-TCFA lesions classified by OCT (1.14 versus 1.02, P <0.0001; and 1.14 versus 0.95, p<0.0001).83,84 In a study of 38 patients with ACS and 33 patients with SAP, positive remodelling was strongly associated with culprit plaques in ACS (87%), but not SAP (12%; P <0.0001), and had the best diagnostic performance among other high-risk CT plaque features (low attenuation and spotty calcification) to identify the culprit lesions (sensitivity 87%; specificity 88%).90 Several other cross-sectional coronary CTA studies have also found a higher remodelling index in patients with ACS compared with patients with SAP (1.14-1.6 versus 0.9-1.2; p=0.001-0.04).92-94,101 Positive plaque remodelling and/or low plaque attenuation was an independent predictor of ACS in a clinical study with 27 ± 10 months follow-up (HR 22.8; 95% CI 6.9-75.2; p
<0.001).102 Among patients with one of these high-risk CT features, one in five will have an adverse coronary event within 1-3 years, a similar rate to those with a three-feature positive plaque determined by VH-IVUS in the The multicentre Providing Regional Observations to Study Predictors of Events in the Coronary Tree (PROSPECT) trial.102,103 The remodelling index can be reliably measured by coronary CTA. However, a more conservative remodelling index threshold of 1.1 is preferred in the assessment of coronary CTA (Figure 2).99
Spotty calcium in plaques
Calcification is an ever-present feature of advanced coronary atherosclerosis.104 Coronary calcification assessed by CT is highly associated with plaque burden and related to poor clinical prognosis.105,106 However, the effect of calcification on plaque instability is controversial.107-110 Although most acute plaque ruptures in individuals with sudden cardiac death contain some calcification under histopathology, approximately two-thirds have only microcalcification, which is not detectable by CT.111 In a serial IVUS study, plaques with heavy calcification are clinically quiescent, whereas spotty (small) calcification was associated with accelerated disease progression in patients with SAP.112 Furthermore, the presence of spotty
calcification was related to culprit plaques in patients with ACS in a study utilizing IVUS imaging.113 In coronary CTA, spotty calcification is defined as a small, dense (>130 HU) plaque component surrounded by noncalcified plaque tissue. The typical cut-off to define a small calcification in coronary CTA as spotty is <3 mm (Figure 2).70,90,102
Spotty calcifications have been further differentiated into small (<1 mm), intermediate (1–3 mm), and large (>3 mm) calcifications.114 Small spotty calcification has the strongest association with vulnerable plaque features defined by VH-IVUS.114 Furthermore, in multiple cross-sectional studies in patients with ACS and SAP, spotty calcification is associated with ACS culprit lesions.92-94 However, results vary widely, and highlight the current uncertainty in the relationship between spotty calcification and plaque rupture.104 With further improvements in CT technology, detection of microcalcifications, which have been suggested to be a frequent feature in unstable angina, might be feasible.115
Semiquantitative coronary plaque burden
Several studies, such as the COURAGE trial (Clinical Outcomes Utilizing Revascularization and Aggressive Drug Evaluation) showed that plaque burden assessment may be more important than ischemic myocardium burden for predicting later major adverse outcomes.116 Furthermore, Bittencourt et al. demonstrated that patients with extensive CAD (>4 coronary artery segments involved) have similar hazard ratios for developing major adverse events as patients with obstructive disease with less than 5 segments involved, thus also emphasizing the importance of quantifying plaque burden.117 Min et al. proposed a score system, the Segment Stenosis Score (SSS) and the Segment Involvement Score (SIS) to quantify plaque burden.118 SSS is calculated by grading all coronary segments as: 0 - No plaque;
1 - < 50% stenosis; 2 - 50-69% stenosis; 3 - ≥ 70% stenosis. SIS is the number of affected segments. Based on 1127 patients, SSS had a hazard ratio of 1.99 (CI: 1.48–2.67), while SIS had a hazard ratio of 1.23 (CI: 1.13-1.34). Similarly, results from the CONFIRM (COroNary computed tomography angiography evaluation for clinical outcomes: an InteRnational Multicenter) registry also showed SIS to be an independent predictor of later major adverse events (hazard ratio: 1.22; CI: 1.03-1.44) 119. Several other studies have also demonstrated SSS and SIS to be significant independent predictors of later outcomes.120-123 While SSS and SIS are simple and elegant concepts for describing plaque burden, they are conceptually flawed.
SSS and SIS scores assume that plaque burden is additive, meaning that adding one plaque to two diseased segments or 12 diseased segments has the same effect. Furthermore, SSS and SIS
lose all anatomical information, thus they assume a moderate stenosis on the left main has the same effect as a moderate stenosis on the second diagonal branch, which clearly is not true. Results of the CONFIRM trial also emphasize the importance of lesion characteristics and location. The trial demonstrated that excluding distal segments and only considering the number of proximal segments with obstructive plaques significantly improved their prediction model.119 Another simple metric for quantifying the magnitude of plaque burden is the 3-vessel score, which counts how many major epicardial vessels (Left anterior descending, Left circumflex, Right coronary) have obstructive stenosis.118 Andreini et al. demonstrated that having only one major epicardial vessel effected with an obstructive lesion (≥ 50%) has a hazard ratio of 3.18 (CI: 2.16–4.69), if all three vessels are affected, the hazard ratio increases to 7.10 (CI: 4.61–10.93).120 Similar tendencies have been reported by several studies.118,121-125 A more quantitative approach originally developed to characterize CAD severity using ICA,126 later adopted for coronary CTA is the Duke Coronary Artery Disease Index.118,127 Patients are assigned a risk score between 0-100 based on previously published prognostic data.126 The score is an extension of the 3-vessel disease score. It also incorporates stenosis severity and calculates with left main stenosis and proximal left anterior descending stenosis (Table 1). Min et al. showed that there was a significant difference between patients’ survival for the different scores.118 Left main plaque with any additional moderate or severe stenosis had the worst outcome, while patients without any disease or only mild CAD had almost no events.
Altogether, plaque burden assessment seems to be a very important concept to describe the severity of CAD and predict adverse outcome.128,129 Several methods have been proposed to properly quantify plaque burden, indicating the lack of a single best method. Furthermore, as we have seen, not only plaque burden, but plaque localization, stenosis severity, plaque composition and vulnerability features all play a role in later outcomes, thus necessitating a more complex holistic approach, which incorporates as many of these parameters as possible.72 Based on the clinical outcome studies investigating the risk of plaque features and extension of CAD, several attempts have been made to create composite scores incorporating anthropometric vulnerability with extent of CAD, plaque localization and vulnerability features
Table 1 Modified Duke Coronary Artery Disease Index for coronary CTA
Score system is based on Miller et al. In the Modified Duke Coronary Artery Disease Index patients are assigned to the most severe category. CTA, CT angiography; LAD, left anterior descending.
as assessed by CTA.
The CONFIRM registry is an international prospective observational cohort currently with seven participating countries.130 Structured interviews were used to collect information regarding patients’ anthropometrics and cardiovascular risk profile. Using this information the National Cholesterol Education Program Expert Panel on Detection, Evaluation, and Treatment of High Blood Cholesterol in Adults (NCEP ATP III),131 the Framingham132 and the Morise clinical risk scores were calculated.133 The 16-segment coronary artery model was used to assess the CTA images.134 Each coronary segment was evaluated for the presence of plaque.
Plaques were classified as calcified, partially calcified or non-calcified. The degree of stenosis was graded as: none (0% luminal stenosis); mild (1% to 49% luminal stenosis); moderate (50%
to 69% luminal stenosis); or severe (≥70% luminal stenosis). Overall, 17,793 patients’ data was used to create the CONFRIM risk score using multivariate Cox proportional hazard models.119 The resulting models were evaluated using a separate test set, which consisted of 2,506 patients’
data. After separate assessment of clinical risk scores and CTA imaging markers, a combined score was created. The COMFIRM risk score is a combination of the NCEP ATP III score, the number of proximal segments (proximal and mid right coronary artery, left main, proximal, and mid left anterior descendent, proximal circumflex, first obtuse marginal branch) with stenosis greater than 50%, and the number of proximal segments with partially calcified or calcified plaques. Adding these two additional parameters caused 32% of the patients to be reclassified, 22% to a lower risk category and 10% to a higher category. Overall, the combined risk score outperformed all clinical scores and significantly improved prediction of all-cause mortality. A online calculator is available for the CONFIRM risk score.135
Originally the Leaman score was established based on ICA measurements. Since plaque features cannot be visualized using ICA, only the localization and the degree of stenosis is used to calculate the score. Obstructions are weighted based on typical amount of blood flow to the left ventricle going through that given segment. On average in case of a right dominant coronary anatomy, the RCA receives 16%, while the left main trunk delivers 84% of the blood flow going the left ventricle.136 For left dominant coronary systems, all of the left ventricle is supplied by the left coronary artery. Weighting factors are equal to how many times more blood goes through a given segment as compared to the RCA. For left dominant systems, the RCA receives a weighting factor of zero, while the weighting factor of the LM and circumferential segments increases by one.137 The degree of stenosis was also accounted for. Occlusions receive a multiplication factor of five, 90-99% stenosis receive multiplication factor of three and obstructions between 70-89% receive a multiplication factor of one. Non-obstructive lesion
(<70%) are not accounted for. A patients’
Leaman score is equal to the sum of all segment scores for all 16 segments.134 Coronary CTA adapted Leaman score as proposed by Gonçalves et al.138 has minor modifications as compared to the original publication of Leaman et al.137 To account of balanced coronary systems an intermediate value was used for segments where there was difference in weighting factors for left and right dominant systems. Plaque composition was also included. For non-calcified and partially calcified plaques weighting factor of 1.5 is added, while calcified plaques receive a weighting factor of one. Lesions with
<50% stenosis receive a multiplication factor of 0.615 which is the relative proportion of the hazard ratios for mortality between obstructive and non- obstructive CAD, as reported by Chow et al. from the CONFIRM registry.139 A summary of the calculation can be found in Table 2. Mushtaq et al evaluated the CTA adapted Leaman score using a single-center prospective registry including 1,304 consecutive patients.140 Hard cardiac events (cardiac death and nonfatal myocardial infarction) were considered primary end-points. Using multivariate Cox regression models which included clinical parameters and SSS or SIS or the coronary CTA adapted Leaman score, were all independent predictors of adverse events. The Leaman score had the highest hazard ratio as compared to the other two scores (hazard ratio: Leaman score: 5.39, CI: 3.49 - 8.33; SSS: 4.42, CI: 2.97 - 6.57; SIS: 3.09, CI: 2.00 - 4.75, respectively). The event free survival of patients with
CTA adapted Leaman-score is calculated by multiplying the weighing factors regarding plaque composition, stenosis severity and location for a given segment. Overall score is calculated by summing up scores for all segments. RCA, right coronary artery;
R-PDA, posterior descending artery originating from right coronary; R-PLB, posterolateral branch originating from right coronary; LAD, left anterior descending; IM, intermediate branch;
LCx, left circumflex; OM, obtuse marginal; L-PDA, posterior descending artery originating from left coronary; L-PLB, posterolateral branch originating from left coronary.
Table 2 Coronary CTA adapted Leaman score weighting factors
Leaman scores in the highest tercile (score >5) and obstructive CAD was similar to patients with similar Leaman scores but without obstructive CAD (78.6% vs. 76.5%; p=0.627).
Originally the SYNTAX (SYNergy between percutaneous coronary intervention with TAXus and cardiac surgery) score was developed to quantify the complexity of CAD, and to determine optimal revascularization strategies for multi-vessel CAD patients.141 SYNTAX score incorporates multiple score systems. As opposed to previously described CTA scores, the SYNTAX score is a lesion-based scoring system, rather than a segment-based system, thus multiple lesions can be present and also scored in the same segment. The original 16-segment classification of the American Heart Association134 is extended based on the Arterial Revascularization Therapies Study,142 to include additional side branches.
Only vessels greater than 1.5 mm and lesions with a stenosis greater than
>50% are analysed. The SYNTAX score does not recognize balanced coronary dominance. Each lesion receives the Leaman score values for the segments in which it is present.
Each segment score is multiplied by 2 for non-occlusive lesions (50-99%) and by 5 for occlusive lesions (100%).
Only one segment is allowed to be occlusive for each lesion. Additional lesion attributes are scored based on the ACC/AHA lesion classification system.143 Characteristics of occlusions144, involvement of trifurcations, bifurcations145,146 and aortal ostium, severe tortuosity, lesion length, heavy calcification, thrombus and diffuse coronary disease are all accounted for. Further adverse lesion characteristics are all additive. Details of the scoring system is described in
SYNTAX score is calculated by multiplying the Leaman score (Table 2) of the segments which contain the given lesion by the stenosis factor. Further lesion characteristics are all additive.
Overall, the SYNTAX score is the sum of all individual lesion scores. +, addition; ×, multiplication.
Table 3Scoring system of the SYNTAX score
Table 3. The SYNTAX score includes many vulnerability parameters, thus utilization of the scoring system for long-term prognosis seems rational. Suh et al. evaluated the performance of the SYNTAX score based on 339 patients who underwent both CTA and ICA 147. Only characteristics assessable by both CTA and ICA were included in the SYNTAX score. Based on univariate Cox regression analysis age, 3-vessel or LM disease on coronary CTA, two-vessel disease or three-vessel or LM disease on ICA, and SYNTAX scores higher than 23 based on ICA were predictors of MACE. On the contrary, multivariate analysis showed that models incorporating the SYNTAX score or simply the number of involved vessels had similar predictive power, both in case of CTA (area under the curve: 0.701 vs. 0.659, respectively) and ICA (area under the curve: 0.706 vs. 0.676, respectively). Recently, the SYNTAX score II has been developed that combines the SYNTAX score with clinical variables.148 Long term follow- up data are promising based on ICA, but we currently lack CTA-based results. Based on these results, it seems incorporating an exceedingly complex score system, such as the SYNTAX
Figure 3 | Representative examples of plaque burdens and composite plaque scores. For the CONFIRM score both patients were assumed to be 65-year-old smoking male patients with 230 mg/dL total cholesterol, 47 mg/dL HDL, 142 mmHg systolic blood pressure using hypertension medication. For the SYNTAX score calculations, the LAD-LCX bifurcation was assumed to be ≥70 ̊ and all plaques were shorter than 20 mm. The example shows, that patients with very different degree of disease can have very similar plaque burden scores. Composite plaque burden scores on the other hand seem to better differentiate between the severity of coronary artery disease. D, diagonal; IM, intermediate branch; LAD, left anterior descending; LCX, left circumflex; PDA, posterior descending artery; PLB, posterolateral branch; OM, obtuse marginal; RCA, right coronary artery; prefixes: d, distal; m, mid; p, proximal.
score, is not justifiable, since it has no proven additive value in risk prediction, as compared to simple CTA based CAD burden scores.
Overall, composite plaque burden scores seem to be a valid concept to determine the severity of CAD.128 One major limitation of simple plaque burden scores is that very different disease severities can have very similar scores (Figure 3). Composite scores seem to account for this, but one must not forget, that these scores are only useful if they are calculated. The calculation of composite scores can become very complex, adding an additional burden to the clinicians. In the future, with the use of structured reporting platforms, these values can be calculated and evaluated automatically.149,150 Therefore, these scores could transition from research domain to clinically useful risk stratification systems.128
Quantitative coronary plaque burden
Large plaque volume was associated with the diagnosis of ACS in cross-sectional studies, and quantification of NCPs can improve risk stratification and improve the prognostic value of coronary CTA to predict future cardiovascular events. The PROSPECT trial is the first and largest natural-history study of coronary plaques using invasive angiography and IVUS to identify plaques vulnerable to rupture on a per lesion basis.103 The prospective study included 697 patients with ACS in whom three-vessel grey- scale IVUS and IVUS with radiofrequency backscatter analysis (known as virtual histology IVUS [VH-IVUS]) were performed to characterize non-culprit (that is unruptured) lesions. After a median of 3.4 years follow-up, the strongest predictor of future events was the IVUS-derived plaque burden of ≥70% (HR 5.03;
95% CI 2.51-10.11; P <0.001).103
Coronary CTA datasets with sub-millimeter isotropic spatial resolution, and the possibility of CT attenuation-based tissue characterization enable the quantification of total coronary plaque burden and individual plaque components, which is similar to the results obtained with IVUS.101,151-153 Automated software tools are now available for plaque quantification and characterization (Figure 4). Automated quantification of plaques is desirable to improve the reproducibility, accuracy and efficiency of coronary CTA plaque analysis. The reproducibility of automated 3D quantification software for plaque burden was demonstrated to be excellent, with an ICC value of 0.88 (95% CI 0.74–0.95); excellent agreement was defined as an ICC coefficient of >0.8.88 The accuracy of automated coronary plaque quantification by coronary CTA was successfully validated against greyscale IVUS and VH-IVUS.80,88 However, automated plaque quantification software tools have poor inter-platform reproducibility; the
same software should, therefore, be used for serial or comparative assessments.154
The culprit lesion (that is ruptured) and vulnerable plaques evaluated by histology or invasive imaging techniques tend to be large in size, leading to the hypothesis that coronary CTA quantification might incrementally improve risk stratification of patients over conventional coronary CTA reading.69 A cross-sectional clinical investigation demonstrated that the culprit plaques in patients with ACS have larger volume than stable lesions in patients
Figure 4 | Example of plaque characterization and quantification using a dedicated automated software tool and coronary CTA data set. a | Segmented whole coronary tree. The LAD is indicated in blue. The coronary centrelines and the aorta are indicated in green. Red box indicates plaque of interest. b | Curved multiplanar reconstruction of the LAD. Dotted lines indicate a partially calcified, positively remodelled plaque in the LMS bifurcation. c | The LMS plaque cross-section from panel b. d | The LMS plaque cross-section with colour overlay derived with adaptive threshold setting. The lipid rich (low CT attenuation) plaque components are shown in red. Fibro-fatty tissue is shown in light-green. Fibrous tissue is shown in dark- green. Calcium is shown in white. e | Volumetric assessment of the lipid rich plaque core is shown in red, and the core’s spatial relation to the lumen (grey mesh) and calcium (white). f | The graph illustrates the areas of different plaque components. The colour scheme is identical to panel d. Abbreviations: Ca, calcium;
coronary CTA, coronary computed tomography angiography; LAD, left anterior descending artery; LCx, left circumflex coronary artery; LMS, left main stem.
with stable angina pectoris (SAP; 193 mm3 versus 104 mm3; p=0.001).92 In patients with unstable angina, quantitative coronary CTA revealed that plaques with morphological features of plaque disruption (such as intraplaque contrast dye penetration) had a larger volume compared with plaques that had no signs of disruption (313±356 mm3 versus 118±93 mm3; p<0.0001). These lesions also contained more low CT attenuation components characteristic to lipid-rich plaques (99±161 mm3 versus 19±18 mm3; p<0.0001) than undisrupted plaques.155 In patients with acute chest pain and obstructive coronary lesions, the total volume of plaques leading to stenosis was not significantly different between those individuals with and those without ACS (212 mm3 versus 171 mm3; p=0.24). Interestingly, the volume of NCP with low CT attenuation density, (<90 HU) was significantly larger in patients with ACS compared with patients who did not have ACS (91 mm3 versus 49 mm3; p=0.03).70
Longitudinal clinical investigations indicate a strong prognostic value of coronary CTA derived plaque volume for future coronary events. In a retrospective study of 1,059 patients with stable chest pain, the coronary plaque volume was larger in those patients who developed ACS compared with patients who did not during a follow-up period of 27±10 months (134.9±14.1 mm3 versus 57.8±5.7 mm3; p<0.001).102 The authors of a study published in 2013 elegantly demonstrated that semiautomatic plaque quantification – whereby plaques are manually identified before automatic segmentation, characterization, and quantification, with optional manual corrections – provided additional prognostic value for ACS over both clinical risk factors and traditional CT reading (including calcium score, segment stenosis score, lesion severity, and number of segments with NCP).156 The patients who developed ACS had a higher total plaque volume (median 94 mm3 versus 29 mm3; p<0.001) and total NCP volume (28 mm3 versus 4 mm3; p<0.001) at baseline compared with those individuals who did not develop ACS.156 The volume of nonobstructive NCP measured by CCTA was a strong predictor of future coronary events in a prospective study of 312 patients with non-ST-segment elevation myocardial infarction who underwent CCTA before invasive coronary angiography.157 In total, 23 patients had a coronary event after a median follow-up of 16 months and the total volume of nonobstructive NCP was independently associated with the events with an HR of 1.18 per 100 mm3 plaque volume increase. Interestingly, neither Agatston score, nor calcified plaque volume were associated with an increased risk of coronary event.157 A subset of patients (n = 32) underwent coronary CTA in the PROSPECT study.103,158 The authors of this exploratory sub-study observed a higher total atheroma volume at baseline in patients with subsequent cardiac events during the mean 39 months follow-up (970 mm3 versus 811 mm3; p<0.01).158
However, despite these promising results, further software improvements are warranted
to maximize accuracy, reproducibility, and time-efficiency before automated plaque burden quantification is implemented in the clinic.82 Moreover, industry standards should be developed to enable reproducible plaque assessments with coronary CTA regardless of the software tool used.129,154
Coronary plaque radiomics
Radiologic images are large two-dimensional or three-dimensional datasets in which the quantitative values present in the pixels (or volumetric pixels called voxels) are used to create a picture.159 Each and every voxel is a measurement itself on the basis of some physical characteristics of the underlying anatomic structure, such as the attenuation of electromagnetic radiation intensity that is used in CT. These values can be assessed by visual inspection, as done in daily clinical routine, or they can be analysed using advanced image analyses. Radiomics is the process of extracting numerous quantitative features from a given region of interest to create large data sets in which each abnormality is described by hundreds of parameters.159 Some of these parameters are commonly known and used by radiologists, such as the mean attenuation value or the longest diameter of a lesion, whereas others that quantify the heterogeneity or shape
of an abnormality are less apparent. From these values novel analytical methods are used to identify associations between the parameters and the clinical or outcome data. Datamining is the process of finding new, meaningful patterns and relationships between the different variables. From these results, novel imaging biomarkers may be identified that can increase the diagnostic accuracy of radiologic examinations and expand our knowledge of the underlying pathologic processes (Figure 5).159
Figure 5 | Pipeline of radiomics-based patient analysis. After image acquisition, new novel radiomics-based image characteristics are extracted to quantify different lesion properties. The hundreds of variables are joined together to create “big data” databases. Data- mining is used to find new meaningful connections between the parameters and the clinical outcome data. On the basis of the results, new imaging biomarkers can be identified that have the potential to increase the diagnostic accuracy of radiologic examinations.
2.2.2 Functional plaque characteristics
Plaques develop at specific areas of coronary arteries where flow is disturbed, such as the outer walls of bifurcations, in side branches, and in the inner curve of arteries, despite risk factors for plaque formation (including smoking, high cholesterol levels, hypertension, and insulin resistance) affecting the whole vascular bed.160-163 Haemodynamic factors, such as endothelial shear stress (ESS), are pathologically important for the spatial localization and development of atherosclerotic plaques.164 Low ESS promotes an atherogenic milieu and high-risk plaque formation, whereas high ESS at stenotic vulnerable plaque sites promotes plaque rupture by destabilization of the fibrous cap.165-167
In the early 1990s, post-mortem studies indicated that more than two-thirds of infarctions evolve from non-obstructive lesions (that is lesions occupying <70% of the lumen).168 However, histopathological investigations have now challenged these studies, and a high portion of culprit lesions now seem to cause obstructive luminal narrowing (>75% area stenosis was seen in 70% of plaque ruptures), especially in late stages of plaque development before the disruption of the fibrous cap.68,71,169 These observations correlate with evidence that patients with ischaemic lesions have a poor prognosis.170,171 Indeed, increased plaque vulnerability might in part be a consequence of haemodynamic perturbations and altered shear stress owing to abnormal fractional flow reserve (FFR).172 Invasive FFR is the gold standard method for the identification of lesions that result in ischaemia.173 The combination of ESS and FFR might, therefore, provide a novel functional dimension in plaque vulnerability assessment.174 Advances in computational fluid dynamics (CFD) have enabled the simulation of coronary flow and pressure-based metrics on the 3D geometry of the coronary artery tree.175 When CFD is added to standardly acquired coronary CTA dataset, ESS-CT and FFR-CT coronary maps can be calculated.174,176