Bypass Surgery or Stenting for
Left Main Coronary Artery Disease in Patients With Diabetes
Milan Milojevic, MD, MSC,aPatrick W. Serruys, MD, PHD,bJoseph F. Sabik III, MD,cDavid E. Kandzari, MD,d Erick Schampaert, MD,eAd J. van Boven, MD, PHD,fFerenc Horkay, MD, PHD, DSC,gImre Ungi, MD, PHD,h Samer Mansour, MD,iAdrian P. Banning, MD,jDavid P. Taggart, MD, PHD,jManel Sabaté, MD, PHD,k
Anthony H. Gershlick, MBBS,lAndrzej Bochenek, MD, PHD,mJose Pomar, MD, PHD,kNicholas J. Lembo, MD,n Nicolas Noiseux, MD,iJohn D. Puskas, MD,oAaron Crowley, MA,pIoanna Kosmidou, MD, PHD,n,p
Roxana Mehran, MD,p,qOri Ben-Yehuda, MD,n,pPhilippe Généreux, MD,e,p,rStuart J. Pocock, PHD,s Charles A. Simonton, MD,tGregg W. Stone, MD,n,pArie Pieter Kappetein, MD, PHDa
ABSTRACT
BACKGROUNDThe randomized EXCEL (Evaluation of XIENCE versus Coronary Artery Bypass Surgery for Effectiveness of Left Main Revascularization) trial reported a similar rate of the 3-year composite primary endpoint of death, myocardial infarction (MI), or stroke in patients with left main coronary artery disease (LMCAD) and site-assessed low or intermediate SYNTAX scores treated with percutaneous coronary intervention (PCI) and coronary artery bypass grafting (CABG).
Whether these results are consistent in high-risk patients with diabetes, who have fared relatively better with CABG in most prior trials, is unknown.
OBJECTIVESIn this pre-specified subgroup analysis from the EXCEL trial, the authors sought to examine the effect of diabetes in patients with LMCAD treated with PCI versus CABG.
METHODSPatients (N¼1,905) with LMCAD and site-assessed low or intermediate CAD complexity (SYNTAX scores#32) were randomized 1:1 to PCI with everolimus-eluting stents versus CABG, stratified by the presence of diabetes. The primary endpoint was the rate of a composite of all-cause death, stroke, or MI at 3 years. Outcomes were examined in patients with (n¼554) and without (n¼1,350) diabetes.
RESULTSThe 3-year composite primary endpoint was significantly higher in diabetic compared with nondiabetic patients (20.0% vs. 12.9%; p<0.001). The rate of the 3-year primary endpoint was similar after treatment with PCI and CABG in diabetic patients (20.7% vs. 19.3%, respectively; hazard ratio: 1.03; 95% confidence interval: 0.71 to 1.50;
p¼0.87) and nondiabetic patients (12.9% vs. 12.9%, respectively; hazard ratio: 0.98; 95% confidence interval: 0.73 to 1.32; p¼0.89). All-cause death at 3 years occurred in 13.6% of PCI and 9.0% of CABG patients (p¼0.046), although no significant interaction was present between diabetes status and treatment for all-cause death (p¼0.22) or other endpoints, including the 3-year primary endpoint (p¼0.82) or the major secondary endpoints of death, MI, or stroke at 30 days (p¼0.61) or death, MI, stroke, or ischemia-driven revascularization at 3 years (p¼0.65).
CONCLUSIONSIn the EXCEL trial, the relative 30-day and 3-year outcomes of PCI with everolimus-eluting stents versus CABG were consistent in diabetic and nondiabetic patients with LMCAD and site-assessed low or intermediate SYNTAX scores.(Evaluation of XIENCE versus Coronary Artery Bypass Surgery for Effectiveness of Left Main
Revascularization [EXCEL];NCT01205776) (J Am Coll Cardiol 2019;73:1616–28) © 2019 Published by Elsevier on behalf of the American College of Cardiology Foundation.
ISSN 0735-1097/$36.00 https://doi.org/10.1016/j.jacc.2019.01.037
From theaErasmus Medical Center, Rotterdam, the Netherlands;bImperial College of Science, Technology and Medicine, London, United Kingdom;cUH Cleveland Medical Center, Cleveland, Ohio;dPiedmont Heart Institute, Atlanta, Georgia;eHôpital du Sacré- Coeur de Montréal, Montreal, Quebec, Canada;fMedical Center Leeuwarden, Leeuwarden, the Netherlands;gSemmelweis Uni- versity, Budapest, Hungary;hUniversity of Szeged, Szeged, Hungary;iCentre Hospitalier de l’Université de Montréal, Montreal, Quebec, Canada;jJohn Radcliffe Hospital, Oxford, United Kingdom;kHospital Clinic, Barcelona, Spain;lGlenfield Hospital, Leicester, United Kingdom;mAmerican Heart of Poland, Katowice, Poland;nNewYork-Presbyterian Hospital/Columbia Univer- sity Medical Center, New York, New York;oMount Sinai Heart at Mount Sinai Saint Luke’s, New York, New York;pClinical Trials Listen to this manuscript’s
audio summary by Editor-in-Chief Dr. Valentin Fuster on JACC.org.
T
he number of people with diabetes mellitus is increasing, having risen from 108 million in 1980 to 422 million in 2014 (1). Patients with diabetes are at an increased risk for systemic atherosclerosis and advanced coronary artery disease (CAD), and diabetes is a predictor of adverse events after both coronary artery bypass grafting (CABG) and percutaneous coronary intervention (PCI)(2,3).In patients with diabetes and complex anatomic dis- ease, CABG has been associated with lower mortality rates compared with PCI(3–5). As a result, CABG has been recommended as the standard of care for pa- tients with diabetes and complex CAD including left
main coronary artery disease (LMCAD)(6); however, in a recent pooled analysis of 3 randomized trials (2 of which were performed more than a decade ago), patients with diabetes and low or intermediate anatomic complexity as signified by a SYNTAX score of #32 had similar 5-year rates after PCI and CABG of all-cause death, cardiac death, and the composite of death, myocardial infarction (MI), or stroke (7).
Conversely, patients with high ($33) SYNTAX scores had significantly higher adverse event rates with PCI compared with CABG. Since the performance of these trials, both PCI technology and technique, as well as
surgical methods and outcomes, have continued to improve. The extent to which diabetes thus influences outcomes after contemporary revascularization strategies in patients with LMCAD is unknown.
The EXCEL (Evaluation of XIENCE versus Coronary Artery Bypass Surgery for Effec- tiveness of Left Main Revascularization) trial was a large-scale study in which selected patients with LMCAD were randomized to PCI with everolimus-eluting stents (EES) versus CABG(8). Acknowledging the importance of diabetes, randomization was stratified by the presence of this variable to ensure a balanced baseline in the diabetic and nondiabetic strata. The present report describes the pre- specified subgroup analysis examining the impact of diabetes on 30-day and 3-year outcomes after PCI versus CABG in patients with LMCAD.
METHODS
STUDY DESIGN. The protocol, patient eligibility criteria, and methods of the EXCEL trial have been reported previously(9). The EXCEL trial was a pro- spective, multinational, unblinded randomized trial
SEE PAGE 1629
A B B R E V I A T I O N S A N D A C R O N Y M S
BIMA= bilateral internal mammary artery
CABG= coronary artery bypass grafting
CAD= coronary artery disease CI= confidence interval DES= drug-eluting stent(s) EES= everolimus-eluting stent(s)
HR= hazard ratio IDR= ischemia-driven revascularization
LMCAD= left main coronary artery disease
MI= myocardial infarction PCI= percutaneous coronary intervention
URL= upper reference limit
Center, Cardiovascular Research Foundation, New York, New York;qThe Zena and Michael A. Wiener Cardiovascular Institute, Icahn School of Medicine at Mount Sinai, New York, New York;rGagnon Cardiovascular Institute, Morristown Medical Center, Morristown, New Jersey;sLondon School of Hygiene and Tropical Medicine, London, United Kingdom; andtAbbott Vascular, Santa Clara, California. Dr. Banning is partially funded by the NHS Oxford NIHR Biomedical Research Centre. Dr. Serruys has been a consultant to Abbott, Biosensors, Medtronic, Micell Technologies, QualiMed, SINOMED, St. Jude Medical, Stentys, Svelte, Philips/Volcano, and Xeltis. Dr. Sabik has been a consultant to Medtronic, Edwards, and Sorin; and has served on the advisory board of Medtronic Cardiac Surgery. Dr. Kandzari has received consulting fees from Medtronic Biotronik, and Boston Scientific;
and has received research support from Medtronic, Abbott Vascular, Boston Scientific, Biotronik, and Medinol. Dr. Schampaert has been a consultant and/or speaker for Abbott Vascular, Boston Scientific, and Philips Medical; and has been an advisory board member for Abbott, AstraZeneca, Bayer, and Servier. Dr. Mansour has received research support and speaker honoraria from Abbott Vascular. Dr. Banning has received institutional grant support for a research fellowship from Boston Scientific; and has received lecture fees from Boston Scientific and Abbott Vascular. Dr. Sabaté has been a consultant for Abbott Vascular. Dr. Lembo has been a consultant to Abbott Vascular; and has served on the Speakers Bureau for Abbott Vascular, Boston Scientific, and Medtronic. Dr. Mehran has received institutional research grant support from Eli Lilly/Daiichi-Sankyo, Bristol-Myers Squibb, AstraZeneca, OrbusNeich, Bayer, CSL Behring, Abbott Laboratories, Watermark Research Partners, Novartis Pharmaceuticals, Medtronic, AUM Cardiovascular, and Beth Israel Deaconess Medical Center; has served on executive committees for Janssen Pharmaceuticals, and Osprey Medical; has served on a data safety monitoring board for Watermark Research Partners; has been a consultant to Abbott, Medscape, Boston Scientific, Merck & Company, Cardiovascular Systems, Inc. (CSI), Regeneron, Roivant Sciences, Spectranetics/Phillips/Volcano, SanofiUSA, Siemens, Shanghai BraccoSine Pharmaceutical Corp. and AstraZeneca; has equity in Claret Medical and Elixir Medical Corporation; and her spouse has been a consultant to Abiomed and The Medicines Company. Dr. Généreux has received speaker fees from Abbott Vascular, Edwards Lifesciences, Medtronic, Tryton Medical, Cardinal Health, and Cardiovascular Systems Inc.; has received consulting fees from Abbott Vascular, Boston Scientific, Cardio- vascular Systems Inc., and Pi-Cardia; has received an institutional research grant from Boston Scientific; and holds equity in SIG.NUM, SoundBite Medical Solutions, Saranas, and Pi-Cardia. Dr. Pocock has been a consultant to Abbott Vascular. Dr. Simonton is an employee of Abbott Vascular. Dr. Stone has been a consultant to Matrizyme, Miracor, Neovasc, V-wave, Shockwave, Valfix, TherOx, Reva, Vascular Dynamics, Robocath, HeartFlow, Gore, Ablative Solutions and Ancora; has received speaker honoraria from Amaranth and Terumo; holds equity/options in Ancora, Cagent, Qool Therapeutics, Aria, Caliber, MedFocus family of funds, Biostar family of funds, Applied Therapeutics, and SpectraWAVE; and his employer, Columbia University, receives royalties for sale of the MitraClip. Prof. Kappetein is an employee of Medtronic. All other authors have reported that they have no relationships relevant to the contents of this paper to disclose.
Manuscript received December 4, 2018; accepted January 1, 2019.
in which 1,905 patients with de novo LMCAD and site- assessed SYNTAX scores#32 in whom equipoise was present for transcatheter versus surgical revasculari- zation were randomly (1:1) assigned to undergo PCI with cobalt–chromium fluoropolymer-based EES (Abbott Vascular, Santa Clara, California) or CABG.
Patients were assessed for eligibility at each partici- pating site by a heart team that consisted of (at least) an interventional cardiologist and a cardiac surgeon (10). Randomization was stratified according to the presence of diabetes and site. The trial was approved by the investigational review board or ethics com- mittee at each participating center. All patients pro- vided written informed consent before enrollment.
The trial was funded by Abbott Vascular but led by a broad academic group with equal representation of interventional cardiologists and cardiac surgeons (8,9). The trial is registered at clinicaltrials.gov, identifierNCT01205776.
ENDPOINTS AND DEFINITIONS.The primary endpoint was the 3-year rate of all-cause mortality, stroke, or MI. Major powered secondary outcomes included this endpoint at 30 days and the composite rate of death, stroke, MI, or ischemia-driven revascularization (IDR) at 3 years. Other secondary endpoints included the components of the primary and secondary endpoints as well as revascularization, stent thrombosis, symptomatic graft stenosis or occlusion, and a pre- specified composite of periprocedural major adverse events.
The definitions of these outcome measures have been previously described in detail (8,9). In brief, stroke was defined as a focal neurological deficit of central origin lasting>24 h, confirmed by a neurolo- gist and imaging. Post-procedure MI was defined as the rise within 72 h after PCI or CABG of creatine kinase-myocardial band (CK-MB) to>10the upper reference limit (URL), or>5 URL plus new patho- logical Q waves in at least 2 contiguous leads or new persistent non–rate-related left bundle branch block, or angiographically documented graft or native cor- onary artery occlusion or new severe stenosis with thrombosis and/or diminished epicardial flow, or imaging evidence of new loss of viable myocardium or new regional wall motion abnormality. Sponta- neous MI was defined as the occurrence >72 h after PCI or CABG of a rise and fall of cardiac biomarkers (CK-MB or troponin)>1URL plus electrocardiogram changes indicative of new ischemia, or development of pathological Q waves in$2 contiguous electrocar- diogram leads, or angiographically documented graft or native coronary artery occlusion or new severe stenosis with thrombosis and/or diminished
epicardialflow, or imaging evidence of new loss of viable myocardium or new regional wall motion ab- normality. Revascularization events were classified as either ischemia-driven or non–ischemia-driven by pre-specified criteria (9). An independent clinical events committee adjudicated all primary and secondary endpoints with source document verification.
Patients with diabetes at baseline were categorized according to treatment as: 1) insulin-treated (with or without oral hypoglycemic agents); 2) oral hypogly- cemic agent–treated without insulin; and 3) non- pharmacological therapy only, including dietary modification, exercise, and weight reduction. Using this classification, the following diabetes subgroups were defined and analyzed in the present study: 1) insulin-treated patients with or without oral hypo- glycemic agents; and 2) non–insulin-treated patients (because only a small number of patients were treated without medications).
STATISTICAL ANALYSIS. Subgroup analysis accord- ing to diabetes status with formal interaction testing was pre-specified in the trial protocol, although no formal statistical hypothesis was defined a priori. All analyses were performed with data from the time of randomization in the intention-to-treat population, which included all patients according to the group to which they were randomly assigned, regardless of the treatment received. Data are summarized using descriptive statistics, presented as proportions (%, count/sample size) or meanSD. Continuous vari- ables were compared using the Student’st-test; dif- ferences in categorical variables were assessed with the chi-square test or Fisher exact test, as appro- priate. Event rates were based on Kaplan-Meier esti- mates in time-to-first-event analyses and were compared by the log-rank test. Multivariable pre- dictors of 3-year outcomes were identified using stepwise selection with a significance level of<0.10 for entry and exit in a logistic regression model. p Values for interaction were generated by logistic regression chi-square test. Analyses according to SYNTAX score tertiles (low 0 to 22, intermediate 23 to 32, high$33) were performed using 3-year Kaplan- Meier event estimates. All analyses were performed using SAS software, version 9.4 (SAS Institute, Cary, North Carolina).
RESULTS
BASELINE AND PROCEDURAL CHARACTERISTICS.
Baseline diabetes status was known in 1,904 of 1,905 randomized patients. Diabetes was present in 554 of
1,904 patients (29.1%); 147 patients were treated with insulin, 358 were treated with oral hypoglycemic agents without insulin, and 49 were treated with nonpharmacological measures. Patients with diabetes had a significantly greater number of comorbidities compared with nondiabetic patients, including hy- pertension, hyperlipidemia, anemia, renal insuffi- ciency, peripheral vascular disease, congestive heart failure, prior stroke, and a higher STS score, although were less likely to be current smokers (Table 1). By core laboratory analysis, diabetic patients also had a higher SYNTAX score, more frequently had diffuse or small vessel disease, and had a greater number of treated lesions.
As shown inTable 2, bilateral internal mammary artery (BIMA) grafting was performed significantly less frequently in patients with diabetes compared with patients without diabetes (19.6% vs. 32.4%; p<
0.001). Off-pump CABG technique, total bypass time, and the number of grafts did not differ between groups. Mean PCI duration was significantly longer in diabetic than in nondiabetic patients. There were no significant differences between the groups in other PCI procedural aspects. At hospital discharge, no differences in the administration of antiplatelet agents, statins, and beta-blockers were found be- tween diabetic and nondiabetic patients after both PCI and CABG (Table 2). Medication use during follow-up is presented inOnline Table 1.
THIRTY-DAY OUTCOMES. As shown in Table 3, the 30-day rates of major adverse events were not significantly different in diabetic compared with nondiabetic patients; however, in both diabetic and nondiabetic patients, the 30-day rate of the compos- ite endpoint of death, stroke, or MI was higher after CABG than after PCI. The difference in outcome was driven mainly by higher rates of stroke and MI after CABG, whereas rates of all-cause death and ischemia- driven revascularization were similar between CABG and PCI. Major adverse events were also higher after CABG than PCI in both diabetic and nondiabetic pa- tients. Acute renal failure within 30 days occurred more commonly in patients with diabetes compared with those without diabetes (2.7% vs. 1.1%; p¼0.01), and was more frequent after revascularization with CABG compared with PCI both in patients with (4.1%
vs. 1.4%; p ¼ 0.005) and without (1.9% vs. 0.3%;
p¼0.05) diabetes (pinteraction¼0.44) (Online Table 2).
Among CABG patients, sternal wound dehiscence occurred in 0.4% versus 1.2% of diabetic and nondi- abetic patients, respectively (p¼0.26). Furthermore, sternal dehiscence did not occur more often after the use of BIMA compared with the single internal
mammary artery technique (0% vs. 0.5%; p¼0.68).
There were no significant interactions between dia- betes status and treatment for any of the 30-day study endpoints.
3-YEAR OUTCOMES. Clinical outcomes according to diabetes status and treatment group are shown in Table 4 and Figure 1. Compared with nondiabetic patients, diabetic patients had higher 3-year rates of the composite primary endpoint, including higher rates of all-cause death, cardiovascular death, MI, and IDR. The rates of the 3-year composite primary
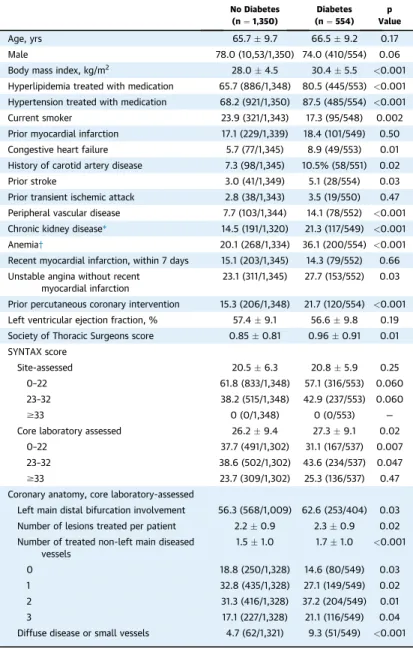
TABLE 1 Baseline Characteristics of Patients According to Diabetes Status in the Overall Cohort
No Diabetes (n¼1,350)
Diabetes (n¼554)
p Value
Age, yrs 65.79.7 66.59.2 0.17
Male 78.0 (10,53/1,350) 74.0 (410/554) 0.06
Body mass index, kg/m2 28.04.5 30.45.5 <0.001
Hyperlipidemia treated with medication 65.7 (886/1,348) 80.5 (445/553) <0.001 Hypertension treated with medication 68.2 (921/1,350) 87.5 (485/554) <0.001
Current smoker 23.9 (321/1,343) 17.3 (95/548) 0.002
Prior myocardial infarction 17.1 (229/1,339) 18.4 (101/549) 0.50
Congestive heart failure 5.7 (77/1,345) 8.9 (49/553) 0.01
History of carotid artery disease 7.3 (98/1,345) 10.5% (58/551) 0.02
Prior stroke 3.0 (41/1,349) 5.1 (28/554) 0.03
Prior transient ischemic attack 2.8 (38/1,343) 3.5 (19/550) 0.47 Peripheral vascular disease 7.7 (103/1,344) 14.1 (78/552) <0.001 Chronic kidney disease* 14.5 (191/1,320) 21.3 (117/549) <0.001
Anemia† 20.1 (268/1,334) 36.1 (200/554) <0.001
Recent myocardial infarction, within 7 days 15.1 (203/1,345) 14.3 (79/552) 0.66 Unstable angina without recent
myocardial infarction
23.1 (311/1,345) 27.7 (153/552) 0.03
Prior percutaneous coronary intervention 15.3 (206/1,348) 21.7 (120/554) <0.001 Left ventricular ejection fraction, % 57.49.1 56.69.8 0.19 Society of Thoracic Surgeons score 0.850.81 0.960.91 0.01 SYNTAX score
Site-assessed 20.56.3 20.85.9 0.25
0–22 61.8 (833/1,348) 57.1 (316/553) 0.060
23–32 38.2 (515/1,348) 42.9 (237/553) 0.060
$33 0 (0/1,348) 0 (0/553) —
Core laboratory assessed 26.29.4 27.39.1 0.02
0–22 37.7 (491/1,302) 31.1 (167/537) 0.007
23–32 38.6 (502/1,302) 43.6 (234/537) 0.047
$33 23.7 (309/1,302) 25.3 (136/537) 0.47
Coronary anatomy, core laboratory-assessed
Left main distal bifurcation involvement 56.3 (568/1,009) 62.6 (253/404) 0.03 Number of lesions treated per patient 2.20.9 2.30.9 0.02 Number of treated non-left main diseased
vessels
1.51.0 1.71.0 <0.001
0 18.8 (250/1,328) 14.6 (80/549) 0.03
1 32.8 (435/1,328) 27.1 (149/549) 0.02
2 31.3 (416/1,328) 37.2 (204/549) 0.01
3 17.1 (227/1,328) 21.1 (116/549) 0.04
Diffuse disease or small vessels 4.7 (62/1,321) 9.3 (51/549) <0.001 Values are meanSD or % (n/N). *Estimated glomerularfiltration rate<60 ml/min.†Hemoglobin<12 g/dl in women and<13 g/dl in men.
endpoint of death, stroke, or MI, or the secondary composite endpoint of death, stroke, MI, or IDR were not significantly different between CABG and PCI in either of the nondiabetic and diabetic cohorts. The 3- year rate of all-cause death was significantly higher after PCI compared with CABG in diabetic patients (13.6% vs. 8.0%; p¼0.046), but not in nondiabetic patients (5.5% vs. 5.0%; p ¼ 0.71). IDR rates were lower after CABG compared with PCI in both diabetic and nondiabetic patients, whereas graft occlusion or stent thrombosis rates were lower after PCI compared with CABG. There were no significant in- teractions between diabetes status and treatment for any of the 3-year study endpoints, including mortality.
IMPACT OF INSULIN TREATMENT. Among diabetic patients, insulin use was associated with greater 3- year rates of MI and IDR (Online Table 3). The rate of the 3-year primary composite endpoint of death, stroke, or MI was similar after PCI and CABG in both insulin-treated and non–insulin-treated diabetic patients (Figure 2). There were no significant
interactions between insulin use, revascularization modality, and 3-year outcomes among diabetic pa- tients (Online Table 3).
SYNTAX SCORE SUBGROUPS. Analysis according to site-reported coronary complexity showed a stepwise increase in 3-year event rates with intermediate compared with low SYNTAX scores in diabetic pa- tients, but similar event rates in nondiabetic patients (Figure 3, Online Table 4). In patients with diabetes and low SYNTAX scores (0 to 22), no significant 3-year event rate differences were observed between CABG and PCI, except for IDR (7.8% vs. 17.0%, respectively;
p¼0.02); however, 3-year mortality was lower after CABG compared with PCI among the 237 diabetic pa- tients with intermediate SYNTAX scores (9.6% vs.
19.6%; p¼0.04). However, the interaction between low versus intermediate site-assessed SYNTAX score and revascularization modality for 3-year death in diabetic patients was not significant (p ¼ 0.32).
Among nondiabetic patients, rates of adverse events were not significantly different after PCI and CABG irrespective of SYNTAX scores. The results according
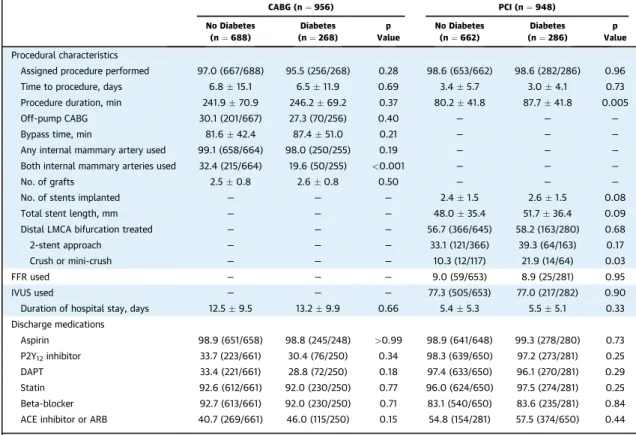
TABLE 2 Procedural Characteristics and Discharge Medications According to Diabetes Status and Revascularization Assignment
CABG (n¼956) PCI (n¼948)
No Diabetes (n¼688)
Diabetes (n¼268)
p Value
No Diabetes (n¼662)
Diabetes (n¼286)
p Value Procedural characteristics
Assigned procedure performed 97.0 (667/688) 95.5 (256/268) 0.28 98.6 (653/662) 98.6 (282/286) 0.96
Time to procedure, days 6.815.1 6.511.9 0.69 3.45.7 3.04.1 0.73
Procedure duration, min 241.970.9 246.269.2 0.37 80.241.8 87.741.8 0.005
Off-pump CABG 30.1 (201/667) 27.3 (70/256) 0.40 — — —
Bypass time, min 81.642.4 87.451.0 0.21 — — —
Any internal mammary artery used 99.1 (658/664) 98.0 (250/255) 0.19 — — —
Both internal mammary arteries used 32.4 (215/664) 19.6 (50/255) <0.001 — — —
No. of grafts 2.50.8 2.60.8 0.50 — — —
No. of stents implanted — — — 2.41.5 2.61.5 0.08
Total stent length, mm — — — 48.035.4 51.736.4 0.09
Distal LMCA bifurcation treated — — — 56.7 (366/645) 58.2 (163/280) 0.68
2-stent approach — — — 33.1 (121/366) 39.3 (64/163) 0.17
Crush or mini-crush — — — 10.3 (12/117) 21.9 (14/64) 0.03
FFR used — — — 9.0 (59/653) 8.9 (25/281) 0.95
IVUS used — — — 77.3 (505/653) 77.0 (217/282) 0.90
Duration of hospital stay, days 12.59.5 13.29.9 0.66 5.45.3 5.55.1 0.33
Discharge medications
Aspirin 98.9 (651/658) 98.8 (245/248) >0.99 98.9 (641/648) 99.3 (278/280) 0.73
P2Y12inhibitor 33.7 (223/661) 30.4 (76/250) 0.34 98.3 (639/650) 97.2 (273/281) 0.25
DAPT 33.4 (221/661) 28.8 (72/250) 0.18 97.4 (633/650) 96.1 (270/281) 0.29
Statin 92.6 (612/661) 92.0 (230/250) 0.77 96.0 (624/650) 97.5 (274/281) 0.25
Beta-blocker 92.7 (613/661) 92.0 (230/250) 0.71 83.1 (540/650) 83.6 (235/281) 0.84
ACE inhibitor or ARB 40.7 (269/661) 46.0 (115/250) 0.15 54.8 (154/281) 57.5 (374/650) 0.44
Values are % (n/N) or meanSD.
ACE¼angiotensin-converting enzyme; ARB¼angiotensin II receptor blockers; CABG¼coronary artery bypass grafting; DAPT¼dual antiplatelet therapy; FFR¼fractional flow reserve; IVUS¼intravascular ultrasound; LMCA¼left main coronary artery; PCI¼percutaneous coronary intervention.
to core lab adjudication were similar to those from the site-reported analysis (Online Table 5, Online Figure 1).
MULTIVARIABLE ANALYSIS.As shown in Online Tables 6 and 7, diabetes was an independent predic- tor for the composite endpoint of death, stroke, or MI after both CABG (hazard ratio [HR]: 1.55; 95% confi- dence interval [CI]: 1.04 to 2.31; p ¼0.03) and PCI (HR: 1.53; 95% CI: 1.04 to 2.26; p¼0.03). Diabetes was
also an independent predictor of stroke after CABG and all-cause death after PCI.
DISCUSSION
The present pre-specified EXCEL substudy examined the impact of diabetes on clinical outcomes after PCI with EES versus CABG in patients with LMCAD and site-assessed low or intermediate SYNTAX scores (Central Illustration). Compared with nondiabetic
TABLE 3 30-Day Clinical Outcomes According to Diabetes Status and Revascularization Assignment
All (N¼1,904) No Diabetes (n¼1,350) Diabetes (n¼554) No Diabetes
(n¼1,350) Diabetes (n¼554)
p Value
CABG (n¼688)
PCI (n¼662)
p Value
CABG (n¼268)
PCI (n¼286)
p
Value pinteraction
Death, stroke, or MI 6.0 (80) 7.5 (41) 0.24 7.2 (49) 4.7 (31) 0.06 9.8 (26) 5.3 (15) 0.05 0.61 Death, stroke, MI, or IDR 6.3 (84) 7.6 (42) 0.29 7.8 (53) 4.7 (31) 0.02 10.2 (27) 5.3 (15) 0.03 0.69
Death 0.9 (12) 1.3 (7) 0.46 0.9 (6) 0.9 (6) 0.96 1.5 (4) 1.1 (3) 0.63 0.68
Cardiovascular 0.8 (11) 1.3 (7) 0.36 0.7 (5) 0.9 (6) 0.73 1.5 (4) 1.1 (3) 0.63 0.58
Stroke 0.8 (10) 1.5 (8) 0.15 0.9 (6) 0.6 (4) 0.55 2.3 (6) 0.7 (2) 0.13 0.44
MI 4.9 (66) 5.5 (30) 0.65 6.1 (41) 3.8 (25) 0.06 6.8 (18) 4.2 (12) 0.20 0.98
Periprocedural 4.9 (65) 4.6 (25) 0.77 5.9 (40) 3.8 (25) 0.08 6.1 (16) 3.2 (9) 0.12 0.68
Spontaneous 0.1 (1) 0.9 (5) 0.003 0.1 (1) 0 0.32 0.8 (2) 1.1 (3) 0.72 0.99
All repeat revascularization 1.0 (13) 1.3 (7) 0.56 1.3 (9) 0.6 (4) 0.18 1.5 (4) 1.1 (3) 0.63 0.66
IDR 0.9 (12) 1.3 (7) 0.46 1.3 (9) 0.5 (3) 0.09 1.5 (4) 1.1 (3) 0.63 0.48
PCI 0.5 (7) 1.3 (7) 0.09 0.6 (4) 0.5 (3) 0.74 1.5 (4) 1.1 (3) 0.63 0.92
CABG 0.4 (5) 0 0.15 0.7 (5) 0 0.03 0 0 — >0.99
Graft occlusion or stent thrombosis 0.7 (9) 0.9 (5) 0.59 1.2 (8) 0.2 (1) 0.02 1.1 (3) 0.7 (2) 0.59 0.26 Major adverse events* 15.3 (204) 15.1 (83) 0.92 23.1 (156) 7.3 (48) <0.001 23.5 (62) 7.4 (21) <0.001 0.97
Values are % (n) of Kaplan-Meier time-to-first event estimates. *The composite rate of death, stroke, myocardial infarction, TIMI major or minor bleeding, transfusion$2 U of blood, major arrhythmia (supraventricular tachycardia requiring cardioversion, ventricular tachycardia orfibrillation requiring treatment, or bradyarrhythmia requiring tem- porary or permanent pacemaker), ischemia-driven revascularization, any unplanned surgery or therapeutic radiologic procedure, renal failure (serum creatinine increase by$0.5 mg/dl from baseline or need for dialysis), sternal wound dehiscence, infection requiring antibiotics, or prolonged intubation (>48 h).
IDR¼ischemia-driven revascularization; MI¼myocardial infarction; other abbreviations as inTable 2.
TABLE 4 3-Year Clinical Outcomes According to Diabetes Status and Revascularization Assignment
All (N¼1,904) No Diabetes (n¼1,350) Diabetes (n¼554)
pinteraction
No Diabetes (n¼1,350)
Diabetes (n¼554)
p Value
CABG (n¼688)
PCI (n¼662)
p Value
CABG (n¼268)
PCI (n¼286)
p Value Death, stroke, or MI 12.9 (170) 20.0 (109) <0.001 12.9 (86) 12.9 (84) 0.89 19.3 (51) 20.7 (58) 0.87 0.82 Death, stroke, MI, or IDR 18.9 (248) 26.1 (142) <0.001 17.5 (116) 20.2 (132) 0.28 22.8 (60) 29.2 (82) 0.17 0.65
Death 5.3 (69) 10.9 (59) <0.001 5.0 (33) 5.5 (36) 0.71 8.0 (21) 13.6 (38) 0.046 0.22
Cardiovascular 3.1 (41) 6.2 (33) 0.002 3.1 (20) 3.2 (21) 0.85 5.4 (14) 7.0 (19) 0.48 0.68
Stroke 2.3 (30) 3.6 (19) 0.11 2.3 (15) 2.3 (15) 0.99 5.1 (13) 2.3 (6) 0.08 0.17
MI 7.3 (96) 10.5 (56) 0.03 7.5 (50) 7.1 (46) 0.73 10.8 (28) 10.3 (28) 0.76 0.99
Periprocedural 5.0 (67) 4.7 (26) 0.80 6.1 (41) 4.0 (26) 0.09 6.1 (16) 3.5 (10) 0.17 0.81
Spontaneous 2.4 (30) 6.4 (33) <0.001 1.6 (10) 3.2 (20) 0.06 5.6 (14) 7.2 (19) 0.50 0.38 All repeat revascularizations 9.2 (117) 13.1 (68) 0.01 7.0 (45) 11.3 (72) 0.008 9.1 (23) 16.9 (45) 0.01 0.68
IDR 9.0 (115) 12.9 (67) 0.01 7.0 (45) 11.0 (70) 0.01 8.7 (22) 16.9 (45) 0.008 0.51
PCI 7.6 (97) 11.1 (58) 0.01 6.1 (39) 9.1 (58) 0.04 8.3 (21) 13.8 (37) 0.058 0.77
CABG 2.0 (26) 2.2 (11) 0.89 0.9 (6) 3.1 (20) 0.005 0.4 (1) 3.8 (10) 0.009 0.37
Graft occlusion or stent thrombosis 2.6 (34) 4.0 (21) 0.12 4.8 (31) 0.5 (3) <0.001 6.7 (17) 1.5 (4) 0.002 0.32 Values are % (n) of Kaplan-Meier time-to-first event estimates.
Abbreviations as inTables 2 and 3.
patients, diabetic patients with LMCAD were at a nearly 2-fold higher risk for all-cause death, stroke, or MI at 3 years. There was no significant difference in the 3-year composite primary endpoint of death, stroke, or MI or the powered 3-year secondary endpoint of death, stroke, MI, or IDR after PCI or CABG either in the diabetic or nondiabetic strata.
Thirty-day adverse events were significantly less af- ter PCI compared with CABG both in diabetic and
nondiabetic patients. Conversely, all-cause mortality at 3 years was greater after PCI compared with CABG among diabetic patients with higher site-assessed SYNTAX scores, although the interaction between site-assessed SYNTAX score and revascularization modality for 3-year death in diabetic patients was not significant. IDR at 3 years was higher with PCI, whereas graft failure or thrombosis rates were higher after CABG, both irrespective of diabetic status.
FIGURE 1 3-Year Outcomes of PCI Versus CABG in Diabetic and Nondiabetic Patients
0 6 12 18
Time (Months) 24 HR: 1.03 (95% CI: 0.71-1.50, P = 0.87)
30 20.7%
19.3%
36
286 PCI
Number at risk:
262 253 240 226 220 213
268
CABG 225 223 218 214 209 205
A
10 5 0 30 25 20 15
Death, Stroke, or MI (%)
0 6 12 18
Time (Months) 24 HR: 1.26 (95% CI: 0.90-1.76, P = 0.17)
30 29.2%
22.8%
36
286 PCI
Number at risk:
256 239 223 207 198 192
268
CABG 222 218 212 205 202 199
B
15 10 5 0 40 35
25 30
20
Death, Stroke, MI, or IDR (%)
0 6 12 18
Time (Months) 24 HR: 1.71 (95% CI: 1.00-2.91, P = 0.046)
30 13.6%
8.0%
36
286 PCI
Number at risk:
275 266 255 244 238 230
268
CABG 252 248 243 240 238 234
C
5
0 20
15
10
All-Cause Death (%)
0 6 12 18
Time (Months) 24 HR: 1.96 (95% CI: 1.18-3.27, P = 0.008)
30 16.9%
8.7%
36
286 PCI
Number at risk:
264 247 230 215 204 199
268
CABG 244 236 229 222 222 218
D
5
0 20
15
10
Ischemia-Driven Revascularization (%)
PCI CABG
Kaplan-Meier estimates of the composite endpoint of all-cause death, stroke, or myocardial infarction (MI); the composite endpoint of all-cause death, stroke, MI, or ischemia-driven repeat revascularization; all-cause death; and IDR in patients with(A to D)and without(E to H)diabetes. p Values are by log-rank test. CABG¼coronary artery bypass grafting; CI¼confidence interval; HR¼hazard ratio; IDR¼ischemia-driven revascularization; PCI¼percutaneous coronary intervention.
Continued on the next page
Our findings confirm that diabetes is a critical determinant of long-term outcomes after myocardial revascularization(3,4). Currently, no specific recom- mendation exists concerning the optimal revascular- ization strategy in diabetic patients with LMCAD(6).
Given the clinical and anatomic complexity that is frequently present in this high-risk subgroup, the selection between CABG and PCI in diabetic patients requires careful consideration. Large-registry data show a substantial increase in the number of patients with diabetes and LMCAD undergoing PCI over the last 20 years, although outcomes data are scarce(11).
Before the present report, comparative effectiveness
data for PCI with drug-eluting stents (DES) versus CABG in diabetic patients were limited to small sub- group analyses from clinical trials. In a pooled anal- ysis of individual patient data from the PRECOMBAT (Bypass Surgery Versus Angioplasty Using Sirolimus- Eluting Stent in Patients With Left Main Coronary Artery Disease) and the SYNTAX (Synergy Between PCI With TAXUS and Cardiac Surgery) trials, Cav- alcante et al. (12)found no difference in the occur- rence of major adverse events between CABG and PCI withfirst-generation DES in LMCAD patients with or without diabetes at 5-year follow-up. The present results in which second-generation EES and
FIGURE 1 Continued
0 6 12 18
Time (Months) 24 HR: 0.98 (95% CI: 0.73-1.32, P = 0.89)
30 12.9%
12.9%
36
662 612 601 590 580 572 544
688 606 593 578 572 555 536
E
10 5 0 30 25 20 15
0 6 12 18
Time (Months) 24 HR: 1.15 (95% CI: 0.89-1.47, P = 0.28)
30 20.2%
17.5%
36
662 605 574 551 537 521 498
688 594 576 560 550 527 509
F
15 10 5 0 40 35 30 25 20
0 6 12 18
Time (Months) 24 HR: 1.10 (95% CI: 0.68-1.76, P = 0.71)
30 5.0%5.5%
36
662 645 636 629 621 614 589
688 652 639 626 622 605 586
G
5
0 20
15
10
0 6 12 18
Time (Months) 24 HR: 1.59 (95% CI: 1.09-2.32, P = 0.01)
30 11.0%
7.0%
36
662 631 601 578 565 550 527
688 635 616 600 590 567 549
H
5
0 20
15
10
PCI CABG
Death, Stroke, MI, or IDR (%)
Death, Stroke, or MI (%) Ischemia-Driven Revascularization (%)
All-Cause Death (%)
contemporary CABG techniques were evaluated are consistent with thesefindings and indicate that both revascularization strategies result in comparable rates of major adverse events at 3 years.
Although PCI resulted in substantially fewer ma- jor adverse events at 30 days in both diabetic and nondiabetic patients, an important consideration affecting the selection of revascularization proced- ure is long-term survival. In this regard, a large propensity-matched analysis of 4,048 patient-pairs from the New York State outcomes registries sug- gested that the apparent survival benefit of CABG over PCI in diabetic patients in the FREEDOM (Comparison of Two Treatments for Multivessel Coronary Artery Disease in Individuals With Dia- betes) and SYNTAX trials (3,4) might be lost when PCI was performed with EES(13); however, registries are particularly sensitive to the occurrence of se- lection bias, and these results must be interpreted with caution (14). Among the 554 diabetic patients randomized in the EXCEL trial, a significant differ- ence in mortality between CABG and PCI was observed in those with higher SYNTAX scores;
however, the EXCEL trial was not powered for mortality in the entire population, let alone the diabetic subgroup, and no interaction was noted between diabetic status, revascularization, and
3-year mortality. In a recently published pooled analysis of individual randomized patient data (15) from the SYNTAX, PRECOMBAT, EXCEL, and NO- BLE (PCI vs. CABG in the Treatment of Unprotected Left Main Stenosis) trials (8,16–18), there was no significant difference in 5-year mortality after treatment of 4,478 patients with LMCAD with PCI versus CABG (10.7% vs. 10.5%; HR: 1.07; 95% CI:
0.87 to 1.33; p ¼ 0.52), either in patients with (n¼1,120; HR: 1.34; 95% CI: 0.93 to 1.31) or without (n¼3,358; HR: 0.94; 95% CI: 0.72 to 1.23) diabetes.
In this analysis, CABG did, however, result in su- perior survival to PCI in diabetic patients with multivessel disease (but without LMCA involve- ment), again suggesting that in general patients with diabetes and complex CAD may preferentially benefit by CABG.
Finally, despite the fact that evidence supports the recommendation of increasing use of BIMA grafts during CABG in diabetic patients who are at low risk of deep sternal wound infection (6,19,20), rates of BIMA usage are still relatively low (only 19.6% of diabetic patients in the present trial). No significant differences in sternal wound dehiscence were observed in diabetic patients treated with a single internal mammary artery versus BIMA in the EXCEL trial. It is also noteworthy that adherence rates to
FIGURE 2 3-Year Outcomes in Patients with Diabetes Stratified by Insulin Treatment
0 6 12 18
Time (Months) 24 HR: 0.98 (95% CI: 0.62-1.54, P = 0.92)
30 18.5%
18.3%
36
213 PCI
Number at risk:
200 193 184 173 169 166
194
CABG 167 165 160 157 153 149
A
10 5 0 30 25 20 15
Death, Stroke, or MI (%)
0 6 12 18
Time (Months) 24 HR: 1.19 (95% CI: 0.61-2.31, P = 0.61)
30 26.9%
22.2%
36
73 62 60 56 53 51 47
74 58 58 58 57 56 56
B
10 5 0 30 25 20 15
PCI CABG
Kaplan-Meier estimates of the composite endpoint of all-cause death, stroke, or MI among non–insulin-treated(A)and insulin-treated(B)patients. The p values are by log-rank test. Abbreviations as inFigure 1.
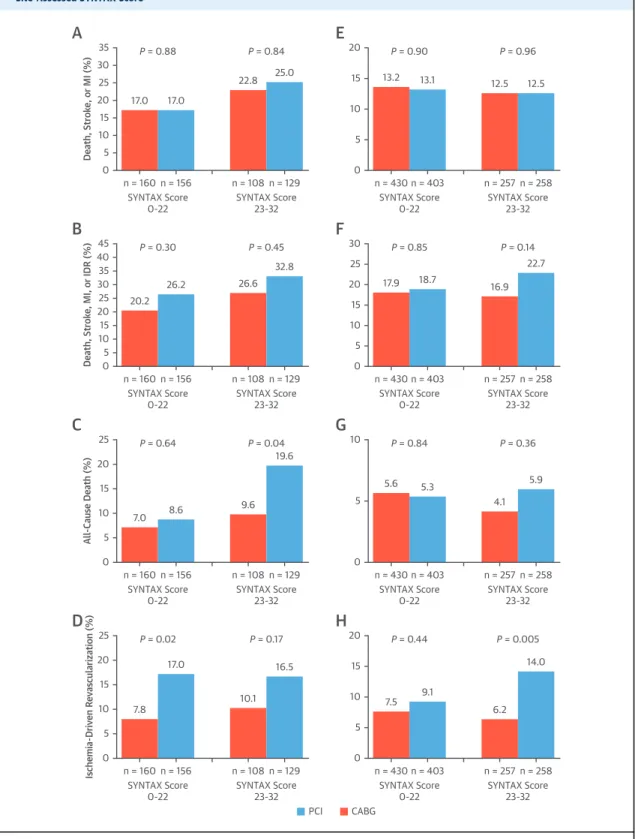
FIGURE 3 3-Year Outcomes for Diabetic and Nondiabetic Patients According to Anatomic Lesion Complexity as Measured by the Site-Assessed SYNTAX Score
n = 160 n = 156 SYNTAX Score
0-22 SYNTAX Score
23-32 P = 0.88
A
P = 0.84
n = 108 n = 129 17.0 17.0
22.8 25.0 20
15 10 5 0 35 30 25
Death, Stroke, or MI (%) 10
5 0
n = 430 n = 403 SYNTAX Score
0-22 SYNTAX Score
23-32 P = 0.90
E
P = 0.96
n = 257 n = 258
13.2 13.1 12.5 12.5
20 15
n = 160 n = 156 SYNTAX Score
0-22 SYNTAX Score
23-32 P = 0.30
B
P = 0.45
n = 108 n = 129 20.2
26.2 26.6
32.8
25 20 10 15 5 0 45 40 35 30
Death, Stroke, MI, or IDR (%) 15
5 10
0
n = 430 n = 403 SYNTAX Score
0-22 SYNTAX Score
23-32 P = 0.85
F
P = 0.14
n = 257 n = 258 17.9 18.7
16.9 22.7 30
25 20
n = 160 n = 156 SYNTAX Score
0-22 SYNTAX Score
23-32 P = 0.02
D
P = 0.17
n = 108 n = 129 7.8
17.0
10.1 16.5 15
5 10
0 25 20
Ischemia-Driven Revascularization (%)
10
5
0
n = 430 n = 403 SYNTAX Score
0-22 SYNTAX Score
23-32 P = 0.44
H
P = 0.005
n = 257 n = 258 7.5 9.1
6.2 14.0 20
15 n = 160 n = 156
SYNTAX Score
0-22 SYNTAX Score
23-32 P = 0.64
C
P = 0.04
n = 108 n = 129
7.0 8.6 9.6
19.6
15
5 10
0 25 20
All-Cause Death (%)
5
0
n = 430 n = 403 SYNTAX Score
0-22 SYNTAX Score
23-32 P = 0.84
G
P = 0.36
n = 257 n = 258 5.6 5.3
4.1 5.9 10
PCI CABG
Kaplan-Meier estimates of the composite endpoint of all-cause death, stroke, or MI; the composite endpoint of all-cause death, stroke, MI, or ischemia-driven repeat revascularization (IDR); all-cause death; and IDR in diabetic patients(A to D)and nondiabetic patients(E to H).
Treatment by SYNTAX score interactions in the diabetic and the nondiabetic groups: The composite endpoint of all-cause death, stroke, or MI (pint¼0.81 and pint¼0.98); the composite endpoint of all-cause death, stroke, MI, or IDR (pint¼0.87 and pint¼0.31); all-cause death (pint¼0.32 and pint¼0.40); and IDR (pint¼0.63 and pint¼0.10). p Values are by log-rank test. Rates are separated according to the site- reported SYNTAX score values, indicating low (0 to 22) and intermediate (23 to 32) anatomic lesion complexity. SYNTAX¼Synergy Between PCI With TAXUS and Cardiac Surgery; other abbreviations as inFigure 1.
CENTRAL ILLUSTRATION Impact of Diabetes Mellitus on 3-Year Outcomes After Left Main Revascularization
0 6 12 18
Time (Months) 24 HR: 1.60 (95% CI: 1.26-2.04, P < 0.001)
30 36
20.0%
12.9%
554 487 476 458 440 429 418
1,350 1,218 1,194 1,168 1,152 1,127 1,080 DM
Number at risk:
Non-DM
20
0 100
60 80
40
Death, MI, or Stroke (%)
DM Non-DM
20.7%
19.3%
12.9%
12.9%
0 6 12 18
Time (Months) 24
> HR: 1.03 (95% CI: 0.71-1.50, P = 0.87)
> HR: 0.98 (95% CI: 0.73-1.32, P = 0.89)
30 36
286 262 253 240 226 220 213
268 225 223 218 214 209 205
662 612 601 590 580 572 544
688 606 593 578 572 555 536
PCI: DM Number at risk:
CABG: DM PCI: Non-DM CABG: Non-DM
20
0 100
60 80
40
Death, MI, or Stroke (%)
M D : G B A C M
D : I C
P PCI :Non-DM CABG :Non-DM
Diabetes Versus Non-Diabetes
A
PCI Versus CABG
B
Milojevic, M. et al. J Am Coll Cardiol. 2019;73(13):1616–28.
The incidence rates of the primary composite endpoint of death, stroke, or MI among diabetic and non-diabetic patients(A)and according to the type of revascularization procedure(B)are shown. Over the 3-year follow-up period, PCI with EES compared with CABG was associated with similar risk of the primary composite endpoint among both diabetic and nondiabetic patients. CABG¼coronary artery bypass grafting;
CI¼confidence interval; DM¼diabetes mellitus; EES¼everolimus-eluting stents; HR¼hazard ratio; MI¼myocardial infarction;
PCI¼percutaneous coronary intervention.
guideline-directed medication therapy after CABG have reached 90% in the EXCEL trial(21)but remain lower than after PCI. Of note, approximately one- third of CABG patients were discharged on dual an- tiplatelet therapy, which, although less than after PCI, represents a higher percentage than in some other studies. This may reflect appropriate use after CABG in patients presenting with acute coronary syndromes, as well as the potential for dual anti- platelet therapy to enhance graft patency (22), the topic of several ongoing randomized controlled trials (Ticagrelor Antiplatelet Therapy to Reduce Graft Events and Thrombosis [TARGET], NCT02053909;
Effect of Ticagrelor on Saphenous Vein Graft Patency in Patients Undergoing Coronary Artery Bypass Grafting Surgery [POPular CABG], NCT02352402;
Study Comparing Ticagrelor With Aspirin for Pre- vention of Vascular Events in Patients Undergoing CABG [TiCAB],NCT01755520). Optimizing guideline- directed medication therapy after both CABG and PCI is essential for patients to derive the most bene- fits from revascularization.
STUDY LIMITATIONS. Although randomization was stratified by diabetes status, and the diabetes sub- group analysis was pre-specified in the EXCEL trial design, the present study was not powered to detect a difference in the primary endpoint of death, stroke, or MI between PCI and CABG in the diabetic cohort, and secondary outcome measures were not adjusted for multiple comparisons. Hence, the results of the present study should be interpreted as hypothesis- generating only, and further investigation in dedi- cated trials of diabetic patients are warranted(23,24).
In addition, the EXCEL trial enrolled patients with LMCAD and site-assessed low or intermediate SYN- TAX scores who were eligible to undergo both PCI and CABG. Therefore, these findings cannot be extrapolated either to patients with unacceptable high surgical risk or patients with coronary anatomy unsuitable for PCI. A major focus of diabetes man- agement is optimal glycemic control. Recently, the use of gliflozins has been shown to reduce the risk of major cardiovascular events in patients with type 2 diabetes(25). Unfortunately, the use of specific oral hypoglycemic agents and data on long-term glycemic
control were not collected in the present study.
Finally, follow-up in the EXCEL trial is complete only through 3 years; longer-term surveillance is neces- sary to examine whether additional differences emerge over time.
CONCLUSIONS
In the large-scale EXCEL trial, among both diabetic and nondiabetic patients with LMCAD and site- assessed low-to-intermediate (#32) SYNTAX scores, PCI using EES and CABG resulted in similar rates of the primary composite endpoint of death, stroke, or MI at 3-year follow-up, although fewer adverse events at 30 days occurred after PCI. For diabetic patients with LMCAD and relatively noncomplex coronary anatomy, PCI may be a reasonable approach, whereas CABG should be considered for diabetic pa- tients with more complex CAD.
ADDRESS FOR CORRESPONDENCE:Prof. Arie Pieter Kappetein, Department of Cardio-Thoracic Surgery, Erasmus University Medical Center, P.O. Box 2040, 3000 CA Rotterdam, the Netherlands. E-mail: a.
kappetein@erasmusmc.nl. Twitter: @kandzari,
@Drroxmehran, @philgenereux, @AKappetein,
@DrChuckSimonton,@GreggWStone.
R E F E R E N C E S
1.Roglic G. WHO global report on diabetes:
a summary. Int J Noncommun Dis 2016;1:3–8.
2.Kappetein AP, Head SJ. CABG or PCI for revascularisation in patients with dia- betes? Lancet Diabetes Endocrinol 2013;1:
266–8.
3.Kappetein AP, Head SJ, Morice MC, et al.
Treatment of complex coronary artery disease in patients with diabetes: 5-year results comparing outcomes of bypass surgery and percutaneous coronary intervention in the SYNTAX trial. Eur J Cardiothorac Surg 2013;43:1006–13.
4.Farkouh ME, Domanski M, Sleeper LA, et al.
Strategies for multivessel revascularization in pa- tients with diabetes. N Engl J Med 2012;367:
2375–84.
5.Verma S, Farkouh ME, Yanagawa B, et al.
Comparison of coronary artery bypass surgery and
PERSPECTIVES
COMPETENCY IN PATIENT CARE AND PROCEDURAL SKILLS:Patients with diabetes mellitus and LMCAD undergoing myocardial revascularization are at higher risk of mortality and major adverse events than those without diabetes. In a randomized trial, there was no difference in the 3-year composite endpoint of all-cause death, stroke, or myocardial infarction between PCI and CABG, irrespective of baseline diabetes status.
TRANSLATIONAL OUTLOOK:Although CABG remains the standard of care for diabetic patients with complex CAD, further studies are needed to ascertain the characteristics of patients with diabetes who can be appropriately managed by percutaneous intervention.