GENETIC AND ENVIRONMENTAL EFFECTS ON THE MORPHOLOGY AND HEMODYNAMICS OF
THE CIRCLE OF WILLIS
PhD thesis
Bianka Forgó
Basic and Translational Medicine Doctoral School Semmelweis University
Supervisor: Ádám Domonkos Tárnoki, MD, Ph.D., med.habil.
Official reviewers: Dénes Horváthy, MD, Ph.D.
Arnold Tóth, MD, Ph.D.
Head of the Final Examination Committee:
Kálmán Hüttl, MD, Ph.D., med. habil.
Members of the Final Examination Committee:
Sándor Péter Manninger, MD, Ph.D.
Zsuzsanna Földes-Lénárd, MD, Ph.D.
Budapest
2019
3
Table of Contents
1. Introduction ... 9
1.1. The anatomy of the Circle of Willis (CoW) ... 9
1.2. CoW variants ... 11
1.2.1. Ethnical differences in the appearance of CoW variants ... 14
1.3. Imaging of the CoW ... 14
1.3.1. Hemodynamic assessment of the CoW using transcranial insonation ... 14
1.3.1.1. Basic principles of transcranial insonation ... 15
1.3.1.2. The clinical use of transcranial Doppler (TCD) ... 18
1.3.1.3. Assessed flow parameters using transcranial insonation ... 20
1.3.2. Digital subtraction angiography (DSA) ... 21
1.3.3. Computed tomography angiography (CTA) ... 22
1.3.4. Magnetic resonance angiography (MRA) ... 22
1.3.5. Comparison of the CoW imaging modalities ... 23
1.4. The clinical relevance of cerebrovascular variants ... 26
1.4.1. The association between cerebral ischaemia and CoW variants ... 26
1.4.2. Fetal type posterior circulation (FTP) and its association with cerebrovascular pathologies ... 27
1.4.3. Further diseases possibly associated with CoW variants ... 29
1.5. Previous results on the genetic background on CoW variants ... 29
1.5.1. Animal studies ... 29
1.5.2. Twin and family studies in humans... 30
2. Objectives ... 32
3. Methods ... 33
3.1. Subjects ... 33
3.1.1. Sample of the MRA and TCD study ... 33
3.1.2. Sample of the transcranial color-coded duplex sonography (TCCS) study .. 33
3.2. Study designs ... 33
3.2.1. Design of the MRA and TCD study ... 33
3.2.1.1. MRA study ... 34
3.2.1.2. Hemodynamic assessment using TCD ... 35
3.2.2. Design of the TCCS study ... 35
4
3.2.2.1. Hemodynamic assessment using TCCS ... 36
3.3. Statistical analysis ... 36
3.3.1. Monozygotic (MZ) – dizygotic (DZ) comparison ... 36
3.3.1.1. Continuous variables ... 36
3.3.1.2. Dichotomous variables ... 37
3.3.2. Comparison of TCCS hemodynamic parameters between men and women 38 3.3.3. Correlations of the TCCS parameters ... 38
3.3.4. The twin study concept ... 38
3.3.4.1. Heritability and concordance rates ... 38
3.3.4.2. Statistical analysis in MZ discordant twins in the MRA-TCD study ... 41
4. Results ... 42
4.1. Clinical characteristics ... 42
4.1.1. MRA and TCD study in Hungarian twins ... 42
4.1.2. TCCS study in Italian twins ... 43
4.2. Results of the MRA and TCD study ... 44
4.2.1. The prevalence of CoW variants ... 44
4.2.2. Concordance and discordance rates and TCD results ... 47
4.2.3. Intra-pair differences regarding cardiovascular risk factors and cerebral hemodynamics in MZ twins discordant to CoW morphology ... 49
4.3. Results of the TCCS study ... 51
4.3.1. Hemodynamic parameters in MZ and DZ twins ... 51
4.3.2. Hemodynamic parameters in relation to gender ... 53
4.3.3. Hemodynamic parameters in relation to age, body mass index (BMI) and blood pressure ... 55
4.3.4. Concordance and discordance rates ... 60
4.3.5. Intra-pair correlations of hemodynamic variants ... 62
5. Discussion ... 65
5.1. The role of cardiovascular risk factors ... 68
5.1.1. Age and CoW ... 68
5.1.2. Gender and CoW ... 69
5.1.3. Hypertension and CoW ... 70
5.1.4. Internal carotid artery (ICA) stenosis and CoW variants ... 71
5
5.2. Genetic effects on the CoW in animal models... 72
5.3. Possible stochastic and epigenetic effects on CoW variants ... 73
5.3.1. Possible epigenetic effects on CoW variants ... 73
5.3.2. Stochastic factors influencing CoW variants ... 75
5.4. Limitations ... 76
5.4.1. Limitations of the MRA study ... 76
5.4.2. Limitations of the TCCS study ... 76
6. Conclusion ... 79
7. Summary ... 80
8. Összefoglaló ... 81
9. References ... 82
10. Bibliography of own publications... 101
10.1. Publications related to the current PhD thesis ... 101
10.2. Publications not related to the current PhD thesis ... 101
11. Acknowledgement ... 103
6
The List of Abbreviations ACA: anterior cerebral artery
ACoA: anterior communicating artery BA: basilar artery
BMI: body mass index CEA: carotid endarterectomy
CE-MRA: contrast-enhanced magnetic resonance angiography CI: confidence interval
CST3: cystatin 3
CT: computed tomography
CTA: computed tomography angiography CoW: Circle of Willis
DBP: diastolic blood pressure
DSA: digital subtraction angiography DZ: dizygotic
EDV: end diastolic velocity
FTP: fetal-type posterior circulation GPx4: glutathione peroxidase 4 ICA: internal carotid artery
LACA A1: left anterior cerebral artery A1 segment LACA A2: left anterior cerebral artery A2 segment LMCA: left middle cerebral artery
LPCA P1: left posterior cerebral artery P1 segment
7 LPCA P2: left posterior cerebral artery P2 segment LPCoA: left posterior communicating artery LVA: left vertebral artery
MAP: mean arterial pressure MCA: middle cerebral artery MFV: mean flow velocity
MRA: magnetic resonance angiography MRI: magnetic resonance imaging MZ: monozygotic
OA: ophthalmic artery OR: odds ratio
PCA: posterior cerebral artery
PCoA: posterior communicating artery PFN-2: profiling-2
PGF: placental growth factor PI: pulsatility index
PICA: posterior inferior cerebellar artery PP: pulse pressure
PSV: peak systolic velocity
RACA A1: right anterior cerebral artery A1 segment RACA A2: right anterior cerebral artery A2 segment RI: resistance index
RMCA: right middle cerebral artery
8
RPCA P1: right posterior cerebral artery P1 segment RPCA P2: right posterior cerebral artery P2 segment RPCoA: right posterior communicating artery RVA: right vertebral artery
SBP: systolic blood pressure
TCCS: transcranial color-coded duplex sonography TCD: transcranial Doppler sonography
TOF MRA: time of flight magnetic resonance angiography VA: vertebral artery
VEGF: vascular endothelial growth factor
9 1. Introduction
1.1. The anatomy of the Circle of Willis (CoW)
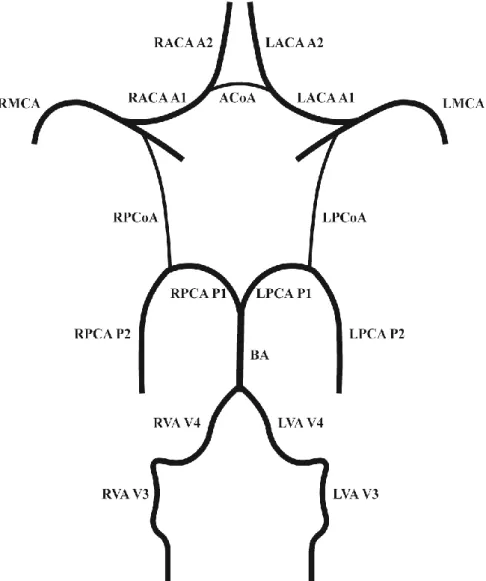
The circulus arteriosus cerebri, an arterial anastomotic polygon located at the skull base is of key importance regarding the maintenance of cerebral perfusion. The arterial anastomotic circuit that connects the carotid and vertebrobasilar circulation was first described by Thomas Willis nearly 400 years ago and was named in his honor “Circle of Willis”. The anastomotic circuit ensures blood supply to the brain through the cerebral and communicating arteries (Figure 1). The two anterior cerebral arteries (ACA) are branches of the internal carotid artery (ICA) and are connected by a single anterior communicating artery (ACoA). The middle cerebral artery (MCA) origins from the ICA bilaterally and is connected to the posterior cerebral artery (PCA) by the posterior communicating arteries (PCoA). The two PCAs origin from the basilar artery (BA). The BA arises from the confluence of the vertebral arteries (VA). The integrity of the CoW seems to be crucial to maintain a compensatory flow in case of cerebrovascular events involving large artery stenosis or occlusion. However, the classical anatomical configuration of the CoW is rarely seen during autopsy and imaging studies. A relevant percentage of the healthy adult as well as paediatric population has hypoplasia or absence of one or more CoW arteries. The etiology of these anatomical variants is unknown.
10
Figure 1. Normal anatomy of the CoW. ACoA: anterior communicating artery, LACA A1: left anterior cerebral artery A1 segment, CoW: Circle of Willis, LACA A2: left anterior cerebral artery A2 segment, LMCA: left middle cerebral artery, LPCA P1: left
posterior cerebral artery P1 segment, LPCA P2: left posterior cerebral artery P2 segment, LPCoA: left posterior communicating artery, LVA V3: left vertebral artery V3
segment, LVA V4: left vertebral artery V4 segment, RACA A1: right anterior cerebral artery A1 segment, RACA A2: right anterior cerebral artery A2 segment, RMCA: right
middle cerebral artery, RPCA P1: right posterior cerebral artery P1 segment, RPCA P2: right posterior cerebral artery P2 segment, RPCoA: right posterior communicating
artery, RVA V3: right vertebral artery V3 segment, RVA V4: right vertebral artery V4 segment (self-made illustration).
11 1.2. CoW variants
The exact number of variants is impossible to determine, however, certain parts of the CoW show a tendency to appear hypoplastic or absent. The anterior and posterior communicating arteries commonly show variant anatomy. The typical CoW configuration without any hypoplasia or absence was found only in 5-28% [1-6]. Variants of the posterior circulation are more common as compared to the anterior CoW when investigating the anterior and posterior circulation separately [7-10]. Bilateral hypoplastic PCoA was observed in 13-32% being the most common variant amongst all, non-classical configurations as well as in the posterior circulation [1-6, 10]. The prevalence of unilateral hypoplastic PCoA was somewhat lower but also among the most common variants (6- 20%) [1-6]. Hypoplasia of the ACoA was the most commonly seen variant anteriorly (0- 14%) and hypoplastic ACA A1 segment was observed in 0-10% [1-6, 11]. The more rare variants include fenestrations and duplications mainly in the anterior CoW, with debated significance in intracranial aneurysm formation [12-14]. Conflicting results are reported regarding the fetal-type posterior circulation (FTP) and the role of this variant in the individual predisposition to stroke [15-17]. The FTP is a variant with debated significance, where the PCA P1 segment is supplied by the ICA through the posterior communicating artery. The FTP can be divided into partial and full categories. Partial FTP is defined as a hypoplastic PCA P1 segment and a more dominant ipsilateral PCoA, whereas an absent PCA P1 segment is seen in case of full FTP [18]. The prevalence of fetal-type variants was 3-36% in autopsy and imaging studies [2, 5, 11, 18-31], however, these numbers are highly dependent on the imaging modalities and autopsy methods.
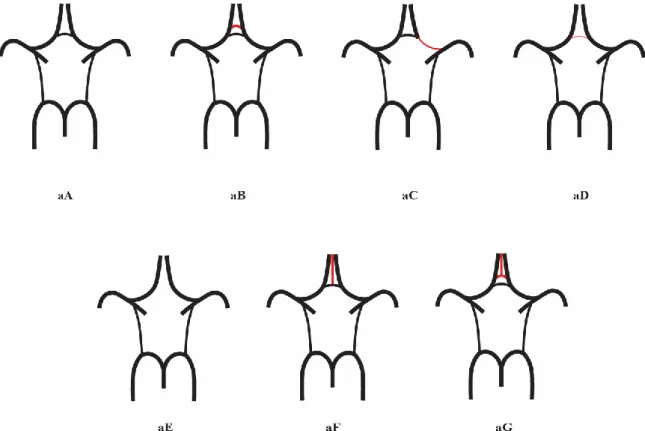
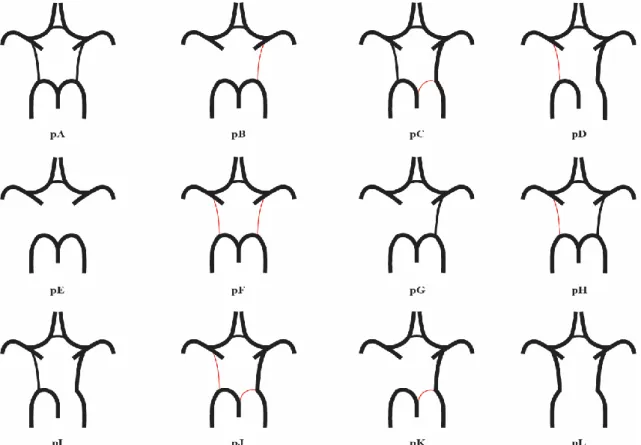
Figures 2 and 3 show illustrations of common CoW variants (these images are also referred to in chapter 3.2.1.1., 4.2.1. and 4.2.2.).
The factors determining these variants are still to be elucidated. There is substantial research supporting that these variants show a differences regarding their prevalence among ethnicities.
12
Figure 2. Variants of the anterior part of the CoW. aA: „Normal” variant with single, non-hypoplastic ACoA and ACAs. aB: Two ACoAs. aC: Unilateral ACA A1 segment hypoplasia. aD: hypoplastic ACoA. aE: Absent ACoA. aF: Medial artery of the corpus
callosum arising from the ACoA. aG: Two ACoAs with medial artery of the corpus callosum arising from the ACoA. ACA: anterior cerebral artery, ACoA: anterior
communicating artery, CoW: Circle of Willis (self-made illustration).
13
Figure 3. Variants of the posterior CoW. pA: „normal” configuration with non- hypoplastic PCoAs present on both sides. pB: Unilateral PCoA hypoplasia, absent
contralateral PCoA. pC: Unilateral fetal-type variant with ipsilateral dominant PCoA and hypoplastic PCA P1 segment. pD: Unilateral fetal-type variant with
absent ipsilateral PCA P1 segment and contralateral PCoA hypoplasia. pE:
Bilaterally absent PCoAs. pF: Bilaterally hypoplastic PCoAs. pG: Absent unilateral PCoA. pH: Hypoplastic unilateral PCoA. pI: Unilateral fetal-type variant with ipsilateral absent PCA P1 segment. pJ: Unilateral fetal-type variant with ipsilateral
hypoplastic PCA P1 segment and contralateral hypoplastic PCoA. pK: Unilateral fetal-type variant with ipsilateral hypoplastic PCA P1 segment and contralateral
absent PCoA. pL: Bilateral fetal-type variant with bilaterally absent PCA P1 segments. CoW: Circle of Willis, PCA: posterior cerebral artery, PCoA: posterior
communicating artery (self-made illustration).
14
1.2.1. Ethnical differences in the appearance of CoW variants
There are autopsy studies suggesting ethnical differences in CoW-variations, although results are inconclusive in this field. Significant differences were described in the CoW- variant profile of the USA compared to Morocco, Iran, France and Sri-Lanka and the difference was mostly attributable to complex configurations where both the anterior and the posterior circulation is affected [1]. The complex variants are rare and therefore they could be related to the larger sample size in the USA-studies. In contrast, Eftekhar et al.
did not find a significant difference amongst the aforementioned (Moroccan, French, Iranian and North-American) populations [6]. Li et al. investigated the CoW variants in the Chinese population and concluded that the prevalence of compromised CoW was higher in this cohort which may be due to ethnical differences in CoW morphology, although the results were compared to magnetic resonance angiography (MRA) and autopsy studies and therefore, methodological differences could account for this observation [11]. Methodological aspects make the comparison challenging [1]. Post mortem changes in vessel calibre may bias the number of detected hypoplastic vessels.
Furthermore, the criteria for hypoplasticity, the cause of death and the gender distribution in the sample may all be relevant factors that influence the results. Therefore, the results urge for thorough investigation of the genetic and environmental factors influencing the formation of variants in the CoW in humans using different imaging methods.
1.3. Imaging of the CoW
1.3.1. Hemodynamic assessment of the CoW using transcranial insonation
The morphology of the CoW can be analysed by magnetic resonance imaging (MRI) and computed tomography (CT), but the hemodynamic parameters of the CoW can exclusively be measured real-time by transcranial insonation such as transcranial Doppler (TCD) or Transcranial Color Coded Duplex Sonography (TCCS) [32].
15 1.3.1.1. Basic principles of transcranial insonation
TCD uses pulsed-wave Doppler measurements without the imaging of the intracranial vessels and surrounding structures [33]. Modern TCD equipment combine the power motion Doppler with a single-channel spectral analysis as power-motion Doppler is a helpful tool to identify the CoW-arteries [34]. Using the power motion mode, color-coded flow signals indicating flow direction can be detected in a range of insonation depth [34].
The sonographer can identify the CoW arterial segments based on given flow direction in a given depth on power-motion Doppler mode and choose an accurate depth for single- depth spectral analysis accordingly [34]. Therefore, identification of the vessels with this technique is based on the depth, flow direction and resistance pattern. TCCS is a technique where B-mode imaging is used together with color-Doppler and most often is completed by spectral analysis. Unlike TCD, TCCS allows angle correction and thus, more accurate velocity measurement as well as the investigation of CoW anatomy.
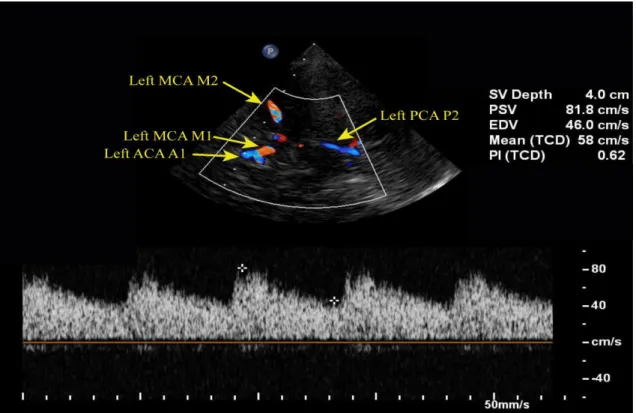
Figures 4, 5 and 6 show examples of TCCS examinations.
Figure 4. TCCS showing normal flow velocities in the left MCA. ACA: anterior cerebral artery, EDV: end-diastolic velocity, MCA: middle cerebral artery, mean (TCD): mean
flow velocity, PCA: posterior cerebral artery, PI (TCD): pulsatility index, PSV: peak systolic velocity, SV depth: sample volume depth, TCCS: transcranial color-coded
duplex sonography. Courtesy of Dr. Zsolt Garami.
16
Figure 5. TCCS showing normal flow velocities in the left MCA. ACA: anterior cerebral artery, ACoA: anterior communicating artery, EDV: end-diastolic velocity, ICA:
internal carotid artery, MCA: middle cerebral artery, mean (TCD): mean flow velocity, PCA: posterior cerebral artery, PI (TCD): pulsatility index, PSV: peak systolic velocity,
SV depth: sample volume depth, TCCS: transcranial color-coded duplex sonography.
Courtesy of Dr. Zsolt Garami.
17
Transcranial insonation utilizes parts of the skull where the bone is thinner (transtemporal window, transorbital window), or naturally absent (transforaminal window), and therefore, Doppler signal from the arteries and veins can be obtained. Transducers with low frequency (usually 2 MHz) are used in order for the ultrasound beam to penetrate the skull. The ophthalmic artery (OA) and the carotid syphon can mainly be detected through the transorbital window, the ACA, MCA, PCA P1 and P2 segments and rarely, the PCoA can be examined through the transtemporal window. The BA and the VA V3 and V4 segments can typically be detected through the transforaminal window. The detection rate through the transtemporal window using transcranial color duplex is very good in case of the ACA (83%), MCA (91%) and PCA (90%) and its P1 (92%) and P2 (94%) segments, but it is poor regarding PCoA (65%) [33, 35-37]. Fair detection rates of the OA (85%) and carotid syphon (67%) were observed with TCCS through the transorbital window, Figure 6. TCCS showing normal flow velocities in the left ACA. ACA: anterior cerebral
artery, EDV: end-diastolic velocity, ICA: internal carotid artery, mean (TCD): mean flow velocity, PCA: posterior cerebral artery, PI (TCD): pulsatility index, PSV: peak systolic velocity, SV depth: sample volume depth, TCCS: transcranial color-coded
duplex sonography. Courtesy of Dr. Zsolt Garami.
18
but the detection rates were excellent when investigated by TCD (100% for the OA and carotid syphon, respectively) [33, 38-42]. Through the transforaminal window, BA was detected in 79–94% [36, 43-45] and VA V4 segment in 89-98% [33, 36, 43, 45].
1.3.1.2. The clinical use of TCD
TCD together with carotid artery ultrasound, MRA or computed tomography angiography (CTA) is a valuable complementary diagnostic method to assess the flow and collateral function in the CoW related to extracranial ICA stenosis [46]. Furthermore, TCD has been used before, during and after vascular surgical procedures that involve clamping of the carotid arteries and consequently affect the CoW flow [47]. These procedures include aortic arch surgery and carotid endarterectomy (CEA) [48, 49]. Preoperative TCD may also assess microemboli and collateral function that is relevant during CEA [50] and intraoperative monitoring may improve clinical outcomes by giving additional real-time information about the decrease of blood flow in the MCA during carotid cross-clamping (and thus, shunt need) and about the presence of microemboli [51]. Configuration of the CoW may also affect the outcome of CEA or may require a shunt to prevent cerebral ischemia [52, 53]. Postoperatively, TCD may be useful in the detection hyperaemia [54].
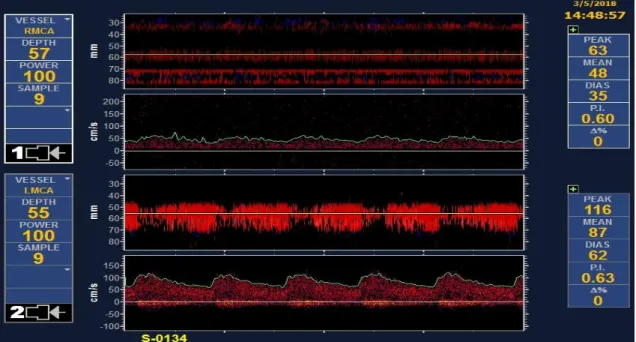
The real-time function of the CoW can only be examined using transcranial sonographic methods. TCD gives additional information to carotid duplex ultrasound as it can detect the effect of carotid artery stenosis on cerebral hemodynamics and it might be informative when carotid duplex is ambiguous or inconclusive [46]. Figures 7 and 8 show TCD signals in the right MCA at baseline and during CEA.
TCD can detect flow in the OA, ACoA and PCoA if there is flow gradient present in these collaterals [55]. Therefore, these collaterals are visualized better when a lesion is present in the vertebrobasilar or carotid arteries which causes an increased gradient rather than in healthy individuals [55]. Therefore, it may not be an accurate tool to assess the morphology of communicating arteries [55]. Patients with greater than 70% carotid artery stenosis are more likely to have established intracranial collaterals detected by TCD [46].
Anterior circulation ischemic stroke was associated with nonfunctional anterior
19
collaterals and the prevalence of failing anterior collaterals was greater in patients with stroke related to ICA stenosis than in those with stroke etiology of cardiac emboli [56].
Figure 7. TCD showing normal baseline flow in the right MCA with high-intensity signals related to microemboli. DIAS: end-diastolic velocity, MEAN: mean flow velocity, PEAK: peak systolic velocity, P.I.: pulsatility index, RMCA: right middle
cerebral artery, TCD: transcranial Doppler. Courtesy of Dr. Zsolt Garami.
Figure 8. TCD showing decreased flow in the right MCA upon clamping during CEA.
CEA: carotid endarterectomy, DIAS: end-diastolic velocity, MEAN: mean flow velocity, PEAK: peak systolic velocity, P.I.: pulsatility index, RMCA: right middle cerebral
artery, TCD: transcranial Doppler. Courtesy of Dr. Zsolt Garami.
20
1.3.1.3. Assessed flow parameters using transcranial insonation
Abnormal flow velocities recorded by transcranial sonography may indicate pathologic conditions. Mean flow velocity (MFV) is the average velocity during the time-velocity waveform [57]:
𝑀𝐹𝑉 =𝑃𝑆𝑉 + (𝐸𝐷𝑉 × 2) 3
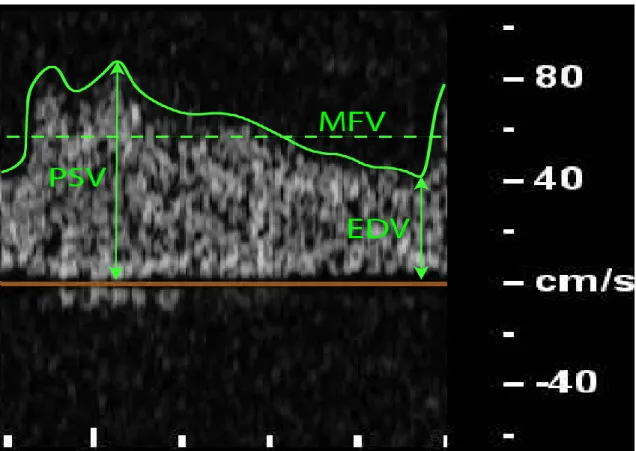
It is a useful marker of stenosis or occlusion of intracranial vessels and used more often for TCD rather than the absolute PSV and EDV values since it is less influenced by the cardiac output and peripheral resistance [58]. These parameters are illustrated on Figure 9. Resistance index (RI) is calculated by subtracting the EDV from PSV and dividing it by the PSV and is another indicator of vascular resistance distal to the site of insonation [32, 34, 58]:
𝑅𝐼 =𝑃𝑆𝑉 − 𝐸𝐷𝑉 𝑃𝑆𝑉
Pulsatility index (PI) is used to assess cerebrovascular resistance and is calculated by subtracting EDV from PSV and dividing the value by MFV and is more dependent on the cardiac output than the RI [32, 58]:
𝑃𝐼 =𝑃𝑆𝑉 − 𝐸𝐷𝑉 𝑀𝐹𝑉
Albeit transcranial sonography is a widespread modality to assess the function of CoW- vessels, their morphology can more precisely be assessed by angiography.
21 1.3.2. Digital subtraction angiography (DSA)
DSA is the gold standard in the imaging of CoW and is used as a reference modality compared to CTA [59-61], MRA and transcranial ultrasound [37, 62, 63], however, it is an invasive method with risk for complications [64] which requires the administration of contrast media and uses high doses of ionizing irradiation. Another limitation of DSA from a functional aspect is that non-functional collaterals may falsely appear as functional because of the abrupt local increase in the arterial pressure upon the administration of contrast media. Therefore, it is mainly reserved for those patients who are planned to go through vascular interventions and is usually not used as a first-choice diagnostic imaging method as CTA has taken over its role in the acute setting. DSA may also elucidate underlying vessel pathology if there is a disagreement among the other imaging results obtained with CTA or MRA and transcranial ultrasound.
Figure 9. Illustration of measured TCD and TCCS parameters during one cardiac cycle. EDV: end-diastolic velocity, MFV: mean flow velocity, PSV: peak systolic
velocity (self-made illustration).
22 1.3.3. CTA
CTA has also been a popular technique to evaluate CoW variants retrospectively in a research setting [11, 65-67]. CTA uses ionizing irradiation and requires the administration of contrast media which are the most important limiting factors and disadvantages of this modality. This is the reason why CTA is not used for research purposes on healthy (volunteer) populations. On the other hand, CTA is a commonly used modality in stroke patients in an acute setting as the vasculature of the neck as well as the brain and its arteries can be examined quickly with less motion artefacts. Therefore, CTA is commonly used in acute and preoperative settings, allowing to obtain a detailed image on the brain supplying arteries quickly. The non-visualized segments of CoW have a lower prevalence using CTA as compared to MRA because of the better spatial resolution and the absence of flow-dependency. However, compared to the gold standard DSA, the sensitivity of CTA depicting non-hypoplastic CoW vessels is somewhat lower and it is poor regarding the imaging hypoplastic CoW vessels (see chapter 1.3.5.).
1.3.4. MRA
MRA has been extensively used in the research of CoW variants in both healthy individuals as well as patients. MRI does not require ionizing radiation, which is why it is a superior method over CT in healthy volunteers. Furthermore, no contrast agent is needed to visualize vessels with time of flight magnetic resonance angiography (TOF- MRA) technique. On the other hand, TOF-MRA has the disadvantage of long acquisition time and therefore, motion artefacts may appear. Furthermore, visualization of the arteries is highly flow-dependent and therefore, arterial segments with low or turbulent flow may not appear on the image. Consequently, if the blood pressure difference between the anterior and posterior CoW is too low, the PCoA may appear as absent. The relatively low spatial resolution may also be a limiting factor of this imaging method. Despite, it is comparable with contrast-enhanced magnetic resonance angiography (CE-MRA) and CTA. Great efforts are made continuously to improve the imaging of the arteries with TOF MRA and technical advances may eliminate the limiting factors in the near future [68, 69]. Alfke et al. compared each segment of the CoW with CE-MRA and TOF MRA protocols and found that the delineation of the right ACA A1 segment was significantly
23
better with CE-MRA compared to TOF MRA [70]. No significant difference was observed in any other CoW vessels implying that these imaging methods are comparable and TOF may be utilized when contrast agent administration is not possible, although there was a tendency towards better delineation with CE-MRA [70]. Since CE-MRA has the risk of gadolinium accumulation in the brain and bone tissue even in patients with normal renal function [71], this risk must be taken into consideration in case of gadolinium contrast administration in healthy volunteers.
MRA has been extensively used to determine the prevalence of CoW variants and results are comparable with autopsy studies, although the frequency of “absent” PCoA may be higher because of the aforementioned artefacts [9, 21, 72-75]. Furthermore, MRA is a tool to examine the relation between CoW variants and other neurological conditions such as intracranial aneurysms [76], small vessel disease [77], white matter disease [78, 79], migraine [80, 81] and unilateral thalamic infarction [82]. The CoW variants, such as hypoplasia of one or more vessels are relevant in patients with ICA stenosis or occlusion [23] and CEA because of the possibility of additional pathway for blood flow in these conditions. The CoW may ensure pathways for compensatory flow and the communicant arteries are important regarding shunt need during CEA and regarding its clinical outcomes [53, 83, 84]. MRA has also been used to assess CoW variants in neonates to get a better understanding of the developmental origin of CoW variants. The results are controversial as preterm infants tend to have a considerably higher prevalence of CoW variants compared to adults in one study [85], while another study found higher prevalence of complete CoW in preterm infants compared to term-borns [86].
1.3.5. Comparison of the CoW imaging modalities
Each of the above mentioned modality has its advantages and disadvantages. Combining these techniques usually improves the diagnostic value [87]. Collaterals are difficult to detect with MRA or CTA only. MRA may underestimate the presence of collaterals [88]
because of its flow-dependent nature and limited resolution, but its combination with TCD increases the sensitivity, although it still does not reach the sensitivity of the gold standard DSA (92% and 88% for the presence of ACoA and PCoA, respectively, in combined MRA and TCD) [62].
24
Hetzel et al. applied TCD monitoring during carotid compression and compared the results with the appearance of interhemispheric crossover-flow through the ACoA during temporary balloon occlusion of the ICA [89]. More than 60% decrease in the contralateral MCA MFV and more than 50% increase in the contralateral ACA MFV correlated well with the grade of interhemispheric cross-over flow detected on angiography (positive predictive value 84% for MFV decrease in the MCA and 96% for MFV increase in the ACA, respectively) [89]. Sensitivity and specificity of TCCS without carotid compression test was 98% and 100% for the detection of collateral flow through the ACoA and 84%
and 94% for the PCoA, respectively, when compared to DSA [37]. Another study compared the collaterals identified on MRA to those detectable with TCCS under manual carotid artery compression. The sensitivity of MRA was 85% and 87% for the two readers and the specificity was 81% and 67%, respectively [90]. Orosz et al. applied a mathematical model based on autopsy data on the CoW vessels and compared it to in vivo TCCS findings. They demonstrated that functional and non-functional collaterals differ in diameter and flow velocities and depend on the hemodynamic gradient in the collateral vessel (pressure difference between the two ends of the communicating arteries) [91].
When compared to CTA, TCD had a sensitivity of 76% in a small population (n=15) with cerebral ischemia [92].
Importantly, there are some positive and negative features of TCD and TCCS that have to be mentioned. The B-mode in TCCS is useful in the visualisation of vessel anatomy because of the anatomical landmarks and because of the use of color Doppler. Flow velocity measurements are more accurate with TCCS compared to TCD since angle correction is possible with TCCS but not with TCD [93, 94]. On the other hand, the TCCS machine is less portable and more expensive and the TCCS probe is larger and requires a larger insonation window which may lead to the inability to obtain the image. Despite this technical difficulty, Krejza et al. demonstrated that the rate of successful insonation is comparable using TCD and TCCS in healthy individuals [95]. Still, TCD has become more widespread, for example in an intraoperative setting such as during carotid artery surgery.
Through the B-mode and color image, CoW anatomy can be assessed which allows TCCS to detect certain CoW variants. However, assessing the hypoplasia or absence of primary collaterals, that is PCoA and ACoA, is a great challenge especially in healthy individuals,
25
partly because of the poor resolution, partly because only functioning arteries are visualised. The threshold for collaterals detected by TCCS as functional is between 0.4 and 0.6 mm on autopsy studies [96], but TCCS is not suitable to assess hypoplasia or absence the same way as MRA or CTA does, as the diameter cannot be accurately measured by TCCS. However, other branching anomalies in the CoW and FTP can be assessed using TCCS. In fact, MRA may miss a substantial number of collaterals that are potentially functional [90].
TCD or TCCS have not been proven to be superior methods to CTA or MRA regarding the imaging of CoW vessels, but on the other hand, they provide valuable complementary information on real-time hemodynamics that none of the latter modalities do [92]. The sonographer and interpretational skills, the bone windows and the time between the TCD and CTA studies have a great influence on the agreement of the two modalities [92]. The spatial resolution of CTA is greater than that of MRA, furthermore, CTA is not flow- dependent as compared to MRA. CTA post-processed with volume-rendering has been compared to the gold standard DSA [59]. Sensitivity of the detection of non-hypoplastic vessels and absent vessels was 97.9% and 96.6%, respectively. However, the sensitivity was poor, 52.6% regarding the detection of hypoplasia, mostly attributable to the communicating arteries [59]. CTA may overestimate the presence of collaterals due to overlapping veins or adjacent arteries [59]. On the other hand, CTA is highly accurate in the visualisation of FTP compared to DSA [61].
The choice of modality becomes of key importance in case of acute cerebrovascular events. Recognizing CoW-variants can add valuable information to the diagnostic procedure as well as surgical planning.
26
1.4. The clinical relevance of cerebrovascular variants
1.4.1. The association between cerebral ischaemia and CoW variants
Hypoplasia or aplasia of the communicating arteries may predispose to hemodynamic ischemic stroke in patients with severe stenosis or occlusion of the ICA [28, 97, 98]. An appropriate flow in the collateral arteries is of great importance regarding the occurrence and extent of cerebral ischemia. The collateral flow in the CoW has been widely investigated in patients with ICA occlusion or stenosis, and intact collaterals seem to have key importance in maintaining cerebral perfusion in this patient group [28, 72, 99-103]
as the collaterals may compensate for the restricted flow in the stenotic vessel, which is the major artery ensuring cerebral blood supply [102, 104, 105]. Varga et al. found in a recent CTA study that the prevalence of brain ischemia detected on CT was increased in patients with more hypoplastic or absent segments of the CoW [66]. ICA stenosis was the only independent predictor of CoW variants, furthermore, ACA A1 hypoplasia showed a significantly higher rate in patients with more than 90% ICA stenosis [66]. Waaijer et al.
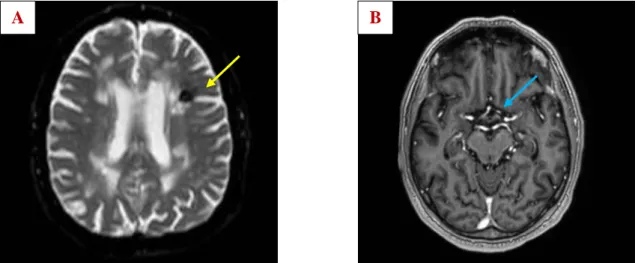
also found significantly higher prevalence of hypoplasia or absence in the anterior CoW in patients with symptomatic ICA stenosis [67]. As for haemodynamic aspects, non- functional anterior and posterior collaterals had a higher prevalence in patients with anterior circulation stroke compared to patients with asymptomatic carotid artery disease [56]. Variations of the CoW were associated with greater risk of stroke in case of hypoplastic or absent segments of the CoW. Prospective studies have confirmed that incomplete anterior CoW is significantly associated with anterior circulation stroke in patients without prior cerebrovascular disease and the risk is even higher if incomplete posterior CoW is present simultaneously [106]. Accordingly, ischemic cerebral changes associated with CoW variants are often detected in clinical practice as shown in Figure 10. The association between stroke and CoW variants is a key issue, but other neurological pathological states may also be related to CoW variants.
27
1.4.2. Fetal type posterior circulation (FTP) and its association with cerebrovascular pathologies
Not only the communicating arteries are of crucial significance regarding collateral flow in the CoW. An especially important location in the posterior CoW is the PCA P1 segment. FTP may predispose to cerebral ischemia. According to the study of Arjal et al., having partial FTP means a 3-fold risk for ischemic stroke [15]. No significant difference was observed when comparing patients with normal PCA, partial and complete FTP regarding the demographics and severity of stroke and the involved intracranial vessels [16]. However, complete FTP was significantly associated with large-vessel stroke etiology as compared to partial FTP and non-variant PCA which could be explained by the lack of thalamic perforators contralaterally [16]. Other authors described an association between posterior circulation ischaemia and FTP when a hypoplastic vertebrobasilar system is present simultaneously [107], as shown in Figure 11. FTP was not associated with increased risk for PCA territory infarct in another study [17]. Thus, results on the clinical relevance of the FTP variant remain inconclusive.
Figure 10. ADC map (A) of a 68-year-old male patient shows subacute ischemic changes at the frontal horn of the left lateral ventricle (yellow arrow). CE-MRA (B)
shows left ACA A1 hypoplasia (blue arrow). ACA: anterior cerebral artery, ADC:
apparent diffusion coefficient, CE-MRA: contrast-enhanced magnetic resonance angiography. Image from the Department of Radiology, Semmelweis University.
B A
28
Figure 11. Unenhanced CT (A, B) shows subacute ischemic changes in the left cerebellar hemisphere (orange arrows) in a 71-year-old male patient. CT angiography
(C, D) shows left PCA P1 hypoplasia (light green arrow) and left VA V4 segment hypoplasia (red arrow). CT: computed tomography, PCA: posterior cerebral artery, VA: vertebral artery. Image from Department of Radiology, Semmelweis University.
A B
C D
29
1.4.3. Further diseases possibly associated with CoW variants
Other neurological conditions have been investigated in relation to CoW variants as well, emphasizing the significance of CoW variants. The relationship between CoW variants and intracranial aneurysms has been intensively researched [76, 108]. A higher incidence of cerebral artery aneurysms has been observed in CoW variants as well as a higher recurrence rate following endovascular procedures [109]. There might be an association between the variant CoW anatomy and white matter disease [78, 79, 110-112], migraine with aura and mesial temporal sclerosis [113, 114]. Interestingly, the causative role of cerebrovascular variants in hypertension was assumed warranting further research in this field [115].
Translational research and studies in humans have contributed significantly to our knowledge on the origin and the consequences of CoW variants, but certain details are still to be elucidated.
1.5. Previous results on the genetic background on CoW variants 1.5.1. Animal studies
Animal studies conducted on rodents provided important information regarding the genetic background of CoW variants. Recently, Faber et al. examined genetic, environmental and potential stochastic factors on the PCoA morphology in mouse strains with different genetic background [116]. A great variation of PCoA diameter and status (unilateral, bilateral or absent) exists between these strains indicating that the naturally occuring genetic constellation may be (at least, partly) responsible for the PCoA variants [116, 117]. Importantly, the differences in PCoA configuration were not only observed between strains, but also within some strains indicating the role of random, stochastic factors besides genetic effects [116]. This was underlined by the fact that low birth weight did not have a significant impact on the PCoA constellation, indicating that in utero random or stochastic factors may be responsible for the inter-individual differences within one strain [116]. Besides in-utero stochastic factors, the role of unique environmental factors has also been investigated. In order to make conclusions on potential environmental factors that contribute to changes in PCoA anatomy, the authors
30
also examined mice with mutations that predispose to obesity, hyperlipidemia, metabolic syndrome, type 2 and type 1 diabetes mellitus [116]. Aging and hypertension decreased PCoA diameter significantly, while the other aforementioned cardiovascular risk factors did not have a significant impact on PCoA variants [116]. Du et al. emphasized the inheritance of ACoA variants, mainly from the mother’s side [118]. The prevalence of incomplete ACoA increased from 35% in the first generation to 63% in the fifth generation by selectively breeding gerbils with incomplete ACoA [118]. Similar tendency (although less marked differences) was observed regarding the PCoA. The ACoA morphology of offspring showed similarity with that of the maternal ACoA pattern in 60.4% [118], however this does not allow any conclusion on heritability. Li et al.
identified four genes related to CoW variants that were selected from a pool of vasculogenesis and angiogenesis related genes in gerbils, however, the association between these genes and the CoW phenotypes cannot certainly be established based on these results [119].
Other authors investigated the possible effects on CoW formation during embryogenesis on a molecular level. The vascular endothelial growth factor (VEGF) has an important role in endothelial cell proliferation and the Notch-signaling pathway is needed for the maturation and differentiation of vascular smooth muscle cells [120]. Notch-signaling deficient vascular smooth muscle cells may predispose to aberrant ACoA formation [120- 122].
Luna et al. investigated the association between placental growth factor (PGF) deficiency and CoW development in mice and described smaller ACA diameter and less collaterals compared to the non-affected animals [123]. The results could have important clinical implications regarding preeclampsia where decreased PGF levels are suspected [123].
1.5.2. Twin and family studies in humans
In humans, twin and family study design provides a possibility to assess the role of heritability in the development of the CoW variants. Twin studies are based on the assumption that monozygotic (MZ) twins share almost 100% of their genes, whereas dizygotic (DZ) twins share in average 50% of their genes just like non-twin siblings.
31
Applying the so called ACE statistical model allows conclusions not only on heritability, but also on the proportion of common and individual environmental factors affecting a given phenotype (“A” stands for additive genetics, “C” stand for common environment and “E” stands for the individual, unshared environment). The “C” component usually refers to the shared household (see in chapter 3.2.3.). This decomposition is not possible in family studies, meaning a great advantage for twin studies. Instead, family studies use a ratio to suggest the risk of relatives developing the same phenotype.
Recently, a family study conducted on families with intracranial aneurysm concluded that incomplete PCoA occurred almost 3-times more often in the index families compared to the controls (odds ratio, OR 2.8, 95%, confidence interval, CI 1.8-4.3) and that the prevalence of this variant was significantly higher within one family [108]. ORs were less in all other examined CoW variants (OR 1.7 95% CI 0.8–3.4 for classical CoW, OR 1.1 95% CI 0.5–2.5 for A1 asymmetry, OR 1.5 95% CI 0.8–3.1 for FTP and OR 2.2 95% CI 1.6–3.0 for any variation) [108].
According to our knowledge, no twin study has investigated the morphology of CoW variants and their heritability previously.
32 2. Objectives
Although the importance of vascular variants is discussed and widely researched, their developmental background remains unclear. A number of other stochastic and environmental factors might affect the formation of CoW variants. Thus, assessing the genetic versus environmental origin of CoW variants could also provide knowledge of genetic predispositions for offspring and could help to understand the role of modifiable environmental factors. Through twin studies it is possible to assess whether heritability plays a significant role in the formation of the variants of CoW or they are influenced mostly by other (environmental or stochastic) factors. Twin studies provide the ideal study model to assess the contribution of genetic versus environmental factors to a certain phenotype. The phenotypes we chose to investigate were the CoW variants assessed by MRA on a Hungarian twin sample and by TCCS on an Italian twin sample as well as the intracerebral hemodynamic factors assessed by TCD in the Hungarian sample and TCCS in the Italian twin sample. Heritability on the CoW morphology alone does not provide enough information, which is why we aimed to study both morphology and hemodynamics of the CoW in healthy individuals. Hypothetically, if the heritability of CoW variants in humans is high, then genetic factors have to be considered. Possibly, in this case studies on the possible benefit of screening could be investigated for offspring of individuals with CoW-variants, if our results are confirmed. On the contrary, if environmental factors dominate over genetics regarding CoW variants, then prevention should be emphasized with focus on the relevant environmental factors that show an association with CoW variants. Accordingly, the aim of our study was to analyse the impact of environmental and genetic factors on CoW morphology and hemodynamic parameters in Caucasian twin samples assessed by MRA, TCD and TCCS.
33 3. Methods
3.1. Subjects
Two independent samples were involved to investigate the morphology and hemodynamics of the CoW variants and their genetic and environmental background. Our first study population consisted of healthy Caucasian twins who are members of the Hungarian Twin Registry [124]. These twin pairs underwent MRA and TCD studies.
Italian twins were involved in the second study who underwent TCCS. The second project was based on an international collaboration between the Hungarian Twin Registry and the Italian Twin Registry [125]. Members of the Hungarian Twin Registry attended the measurements and helped with data collection.
3.1.1. Sample of the MRA and TCD study
120 Hungarian twins attended the study (60 pairs), of whom 38 pairs were MZ and 22 were DZ after the exclusion of 4 twin pairs. These twin pairs had to be excluded either because they did not show up at the scheduled appointment for MRI (3 pairs) or because of claustrophobia (1 pair).
3.1.2. Sample of the TCCS study
64 Italian twins (32 twin pairs), 19 MZ pairs and 13 DZ pairs were analysed. The study population consisted of the members of the Italian Twin Registry who did not have any medical complaints and were older than 18 years of age [124, 126].
3.2. Study designs
3.2.1. Design of the MRA and TCD study
The investigation was approved by the regional ethical committees (Regional/Local Committee of Science and Research Ethics Borsod-Abaúj-Zemplén, Heves and Nógrád County, approval number: 1046-260/2014, 2014/09/22 as well as Semmelweis University Regional and Institutional Committee of Science and Research Ethics 189/2014, 2014/10/21). All participating Hungarian twins signed an informed consent. The tenets of the Declaration of Helsinki were followed. A multiple self-reported questionnaire
34
based on a seven-part, self-reported response was used to maximize the accuracy of zygosity classification [127]. Detailed history and risk factors were obtained by a questionnaire, collecting data on body weight and height, body mass index (BMI), smoking, hypertension, diabetes mellitus and hypercholesterolemia. Both former and current smokers were included in the smoking group.
The twins underwent 3D TOF MRA of the cerebral arteries if the MRI study was not contraindicated. Patients were excluded with any of the following conditions: pregnancy or positive pregnancy test, breast-feeding, immunosuppressive or immunomodulant therapy including systemic steroids in the past 30 days, chemotherapy within 1 year, major surgery within 2 months, transfusion or blood products received within 2 months.
Moreover, pacemaker, implantable cardioverter-defibrillator or other implanted devices, magnetic metal foreign bodies, claustrophobia and aphasia were regarded as exclusion criteria. The studies were performed in part in the Borsod-Abaúj-Zemplén County University Teaching Hospital in Miskolc, Hungary and partly at Semmelweis University Magnetic Resonance Research Centre. Members of a twin pair were examined the same day by a professional operator.
3.2.1.1. MRA study
T1-weightened coronal, T2-weightened sagittal, axial trace-weighted diffusion, axial apparent diffusion coefficient, axial proton density and axial T2 dark fluid images of the brain were obtained. TOF MRA was obtained on the cranial vessels. No contrast agent was applied. The 3D multi-slab TOF MRAs were reconstructed using maximal intensity projection (MIP). At Borsod-Abaúj-Zemplén County University Teaching Hospital measurements were performed on a Siemens Magnetom Verio 3 Tesla scanner (Siemens Healthcare GmbH, Erlangen, Germany). The following imaging parameters were used to obtain the TOF MRA images: RT/ET 21/3.43 ms, flip angle 18°, 768 x 768 matrix, 0.5 mm slice thickness. At the second study location on a Philips Ingenia 3 Tesla scanner (Philips Healthcare, Best, The Netherlands) was used with the following TOF MRA imaging parameters: RT/ET 23/3.45 ms, flip angle 18°, 552 x 332 matrix, 1.2 mm slice thickness.
35
Evaluation of the CoW was made both on MIP and multi-slice MR images. A single observer performed all measurements in the project. This observer was blinded to zygosity and all clinical information.
We investigated CoW variants from two points of view [11, 23, 90]. First, we analysed each vessel of the CoW and determined if they were non-hypoplastic, hypoplastic or absent. Vessel diameters were measured on transverse slices of the 3D multi-slab TOF MR-angiograms. We used a forced-choice method to define hypoplasia and absence of the vessels, which means that non-visible vessels were defined as absent [90]. Visible arteries with a diameter under 0.8 mm were defined as hypoplastic [23]. Secondly, we categorized the anterior and posterior CoW variants separately according to their appearance. We used the morphological classification described by Hartkamp et al. and Li et al. as a basis [11, 23]. However, we made some modifications in their categories because some were not applicable to our findings. Figures 2 and 3 show our classification of the anterior and posterior CoW variants.
3.2.1.2. Hemodynamic assessment using TCD
TCD was performed on the Hungarian twins by the same investigator with the same ultrasound system (Multi-Dop T, Compumedics Germany GmbH, Singen, Germany) with a 2 MHz transducer. Through the temporal and transforaminal windows, MFV and PI were recorded bilaterally from the M1 segment of the MCA, the ACA A1 segment, P1 segment of the PCA and the BA. Flow direction was determined on all the aforementioned vascular segments, which was normal in all individuals.
3.2.2. Design of the TCCS study
The TCCS investigations were conducted at the Neurosonological Laboratory of the University of Padua in 2014 on Italian twins. All study subjects underwent TCCS and a personal interview. Exclusion criteria were pregnancy, acute infectious disease, history of neurosurgical intervention, twin pairs dysgenesis, as in the latter case gender- dependent environmental factors and chromosome X effects may influence the results.
Prior to the examination, each participant signed an informed consent, after having been
36
verbally informed about the course and purpose of the study. During the research, the principles of the Helsinki Declaration were followed. For each subject, a complete history was obtained, body height and body weight were recorded, and BMI was calculated.
Peripheral systolic blood pressure (SBP) and diastolic blood pressure (DBP) was obtained on each individual and pulse pressure (PP) and mean arterial pressure (MAP) was calculated.
3.2.2.1. Hemodynamic assessment using TCCS
TCCS was performed always by the same investigator with the same ultrasound system (Toshiba Aplio XG) with a 2-4 MHz transducer (transducer type: PLT-30BT). Through the transtemporal and transforaminal windows, PSV as well as EDV were recorded from the M1 segment of the MCA, the A1 segment of the ACA, P1, P2a and P2p segments of the PCA, the BA and the V4 segment of the VA. The reported PCA velocity values were actually the mean PSV and EDV of the P1, P2a and P2p segments. The MFV and PI were calculated from the PSV and EDV values. Flow direction was determined on all the aforementioned segments. Normal flow direction was observed in all cases and therefore this trait was not included in further statistical analysis. Anatomical variations of the CoW were recorded; in particular, the missing segments of the CoW were registered as well as those variants where the origin of a given vessel was in an unusual location.
3.3. Statistical analysis
IBM SPSS Statistics for Windows, version 23 (IBM Corp., Armonk, N.Y., USA) and Microsoft Excel 2016 was used for all statistical analysis.
3.3.1. MZ-DZ comparison 3.3.1.1. Continuous variables
We tested whether the variables fulfil the assumptions of the independent-samples t-test in both the MRA-TCD and the TCCS study in order to compare the means of the variables
37
between the MZ and DZ group. Histograms were obtained on the continuous variables in the MZ and DZ group separately and Shapiro-Wilk test was performed in order to test for normal distribution of the continuous data. If the data showed non-normal distribution in either the MZ or the DZ group, then transformation of the data was performed by obtaining inverse, square, square root, cube root, base-10 logarithm and natural logarithm of the variables. If the transformed data showed normal distribution and non-significant p-values of the Shapiro-Wilk test in both groups, then the homogeneity of variance was tested using Fisher’s F-test. If the homogeneity of variances assumption was not violated, then independent samples t-test was performed. We used Welch-test to compare means between variables in the two groups with normal distribution but significantly different variances. These variables included the right MCA EDV, the left ACA EDV, the right PCA PI and the BA PI in the TCCS study.
Accordingly, we used the reciprocal values of the BMI in the MRA-TCD study to perform the parametric independent samples t-test when comparing means between the MZ and DZ groups. In the TCCS study, base-10 logarithmic transformation for BMI and reciprocal transformation for SBP was applied, respectively. Reciprocal values of left and right MCA PI were used when comparing the means between the MZ and DZ groups in the TCCS study.
If the assumption of normal distribution remained violated after data transformation, then we compared the MZ and DZ groups regarding the continuous variable using the non- parametric Mann-Whitney U-test. This was applied when comparing the MZ and DZ groups regarding age in both the MRA-TCD and the TCCS study as the assumptions for parametric tests were violated. Furthermore, the same test was used when comparing means of left VA PI between MZ and DZ groups as this variable showed non-normal distribution between the groups and remained similar after transformation.
3.3.1.2. Dichotomous variables
Fisher’s exact test was applied to investigate differences between MZ and DZ twins regarding sex, smoking, diabetes, hypertension and hypercholesterolemia in the MRA- TCD study as well as the difference between the MZ and DZ groups regarding sex in the TCCS study.
38
3.3.2. Comparison of TCCS hemodynamic parameters between men and women
When comparing the measured TCCS parameters between men and women, we used a similar approach regarding statistical analysis as for the MZ-DZ comparisons (see detailed description in 3.2.3.1.). The variables that did not have normal distribution included BA PSV, left VA EDV, right MCA PI, left MCA PI, left PCA PI and left VA PI.
Normal distribution was obtained by square root transformation of the BA PSV and left PCA PI as well as through reciprocal transformation of the left MCA PI and base-10 logarithm transformation of left VA EDV values. All of these transformed variables showed homogeneity of variances between men and women except for the left PCA PI, where Welch-test was used for the comparison of means. Welch-test was also applied for the non-transformed right MCA MFV values as the homogeneity of variances assumption was violated when comparing means between genders.
The right MCA PI and the left VA PI showed non-normal distribution even after transformation. Non-parametric Mann-Whitney U-test was used to compare the means between men and women regarding these variables.
3.3.3. Correlations of the TCCS parameters
Correlations between the TCCS parameters and age, BMI, SBP, DBP, PP and MAP were conducted. If both correlated variables showed normal distribution, then Pearson’s correlation was conducted. In all other cases we used Spearman’s correlation. The variables that did not show normal distribution included age, SBP, PP, right PCA EDV, right VA PSV, right VA MFV, right MCA PI, left MCA PI, right VA PI, left VA PI and BA PI.
3.3.4. The twin study concept
3.3.4.1. Heritability and concordance rates
Twin studies aim to determine the genetic and environmental basis of a certain phenotypic variance. The concept of twin studies is based on the assumption that MZ twins share almost 100% of their genes on average, whereas DZ twins share in average only 50% of
39
their genes similarly to non-twin siblings. Under this assumption the following equations can be made, where A stands for additive genetic effects (heritability), E stands for unique, non-shared environmental effects, C stands for common environmental effects and D stands for dominant genetic effects (such as epistasis), rMZ stands for MZ intra- pair correlations and rDZ stands for DZ intra-pair correlations:
variance (A) / total variance (P) = a2 = 2 (rMZ - rDZ) variance (E) / total variance (P) = e2 = 1 - rMZ variance (C) / total variance (P) = c2 = 2rDZ - rMZ variance (D) / total variance (P) = d2 = 2rMZ - 4rDZ
The contribution of these parameters to the phenotypic variance would be calculated as following (assuming that MZ and DZ genetic resemblance is 100% and 50%, respectively):
Variance = A + D + C + E MZ covariance: A + D + C DZ covariance: ½ A + ¼ D + C
However, the 4 unknowns cannot be determined using 3 equations, and therefore, A, C, D, and E components cannot be determined at once. Either the C or the D component has to be assumed to equal zero. Usually the D component is fixed to zero and the following equation is used to determine the heritability (additive genetic component behind phenotypic variance) [128]:
2×(rMZ-rDZ)
This is called raw heritability, which we determined regarding continuous hemodynamic parameters measured in TCCS tests. MZ and DZ phenotypic intra-pair correlations (rMZ and rDZ) were counted using Pearson’s correlation coefficient.
However, if rMZ is much higher than 2rDZ, then this formula is not correct and no other formula can be used to determine heritability of a trait. If the value of rMZ is between 2rDZ and 4rDZ then the role of dominant genetic effects has to be assumed and the
40
following formula has to be used to determine the heritability (additive genetic effects) [129]:
4rDZ-rMZ
However, raw heritability does not provide any information on the shared and non-shared environmental component. If MZ twins have more similar phenotypes than DZ twins, then there is a bigger contribution to the phenotypic variance by genetic effects.
Furthermore, twins share the same early environment and therefore, common and non- common environmental factors can be estimated using ACE-model, where A stands for additive genetics, C stands for common shared environmental factors and E stands for unique environmental factors. In the current study, this detailed analysis was not possible due to the small study population.
The similarity between co-twins was estimated with concordance rate in case of categorical variables (which were used in the current study for CoW variants) [130].
We determined the concordance rates of anterior and posterior CoW morphology separately in the MRA study and for the whole CoW in the TCCS study. Pairwise concordance rates were estimated by the following formula [131]:
𝑛 𝑐𝑜𝑛𝑐𝑜𝑟𝑑𝑎𝑛𝑡 𝑡𝑤𝑖𝑛 𝑝𝑎𝑖𝑟𝑠
𝑛 𝑐𝑜𝑛𝑐𝑜𝑟𝑑𝑎𝑛𝑡 𝑡𝑤𝑖𝑛 𝑝𝑎𝑖𝑟𝑠 + 𝑛 𝑑𝑖𝑠𝑐𝑜𝑟𝑑𝑎𝑛𝑡 𝑡𝑤𝑖𝑛 𝑝𝑎𝑖𝑟𝑠
A pair of twins was defined as concordant if both members of the pair had any kind of variant CoW anatomy. Historically, twin pairs where both members are unaffected regarding a given phenotype (which correspond to CoW variants in this work) are not considered concordant. Typically, concordance rates in twin studies are calculated on the presence or absence of a disease, for example schizophrenia [132], diabetes mellitus [133]
or rheumatoid arthritis [134]. Concordance rate is an expression of the probability of one twin having the investigated phenotype if his or her co-twin is affected. Therefore, we did not consider twin pairs as concordant if both members had normal CoW anatomy. In discordant twin pairs, one member of the twin pair had classical CoW anatomy and the other member had variant anatomy in the CoW. Both anterior and posterior CoW parts were investigated separately according to these categories in the MRA and TCD study, whereas the CoW as a whole was investigated in the TCCS study.
41
Chi-square test of homogeneity was conducted in both the MRA-TCD and the TCCS sample to assess proportions of the CoW variants between the MZ and DZ groups. The test yielded non-significant results regarding both samples indicating that the MZ and DZ groups were homogenous regarding the proportion of CoW variants.
3.3.4.2. Statistical analysis in MZ discordant twins in the MRA-TCD study
We examined the intra-pair differences regarding cardiovascular risk factors as well as TCD parameters in MZ twins discordant to anterior or posterior CoW variants. Members of a twin pair were regarded as non-independent groups. Accordingly, we chose statistical tests for this purpose which do not assume independent samples.
Since BMI was not normally distributed across members of the MZ discordant twin pair, we used reciprocal transformation in order to use a parametric test. The inverted BMI values were re-tested for normality and homogeneity of variance and paired t-test was used as the transformed values fulfilled the criteria for paired t-test. Similarly, paired t- test was used regarding the majority of TCD parameters MRA-TCD study. Some hemodynamic parameters were not normally distributed and remained non-normally distributed after transformation. Non-parametric Wilcoxon-signed rank test was performed in these parameters. These TCD parameters included RPCA MFV and LACA PI. Dichotomous variables were compared within the MZ discordant twin pairs using McNemar’s test.
42 4. Results
4.1. Clinical characteristics
4.1.1. MRA and TCD study in Hungarian twins
The median age was 49.5 and 55.0 years in the MZ and DZ group, respectively. There was no significant difference regarding average age between the two groups (p=0.26).
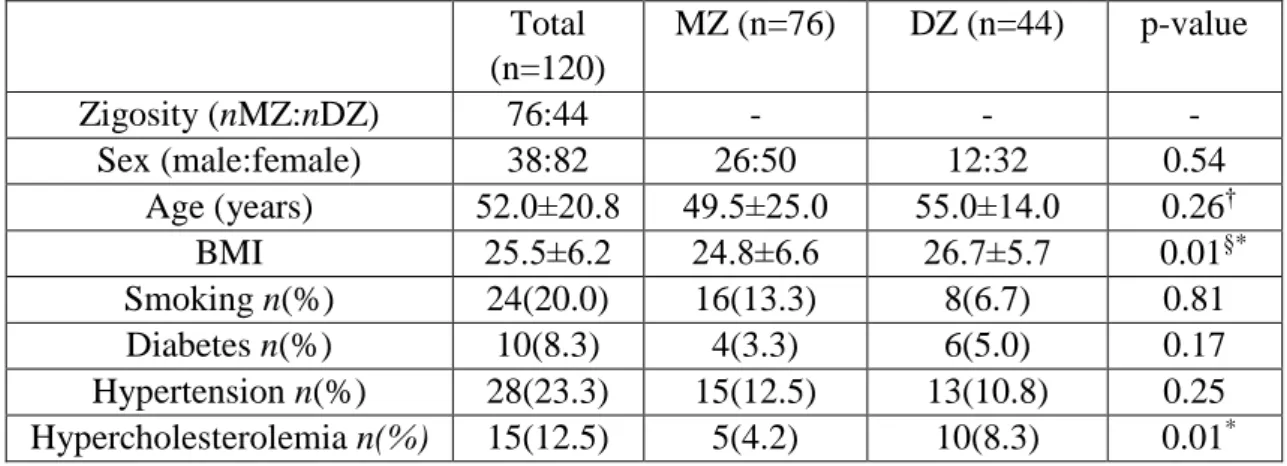
Similarly, no significant difference was demonstrated between the MZ and DZ groups regarding smoking, diabetes and hypertension, however, a significant difference was observed regarding BMI (p=0.01) and hypercholesterolemia (p=0.01) between the two groups. Table 1 shows the characteristics of the MRA and TCD study in the Hungarian study population.
Table 1. Characteristics of the MRA and TCD study population. BMI: body mass index, DZ: dizygotic, MRA: magnetic resonance angiography, MZ: monozygotic, TCD:
transcranial Doppler. Data are shown as median±interquartile range with continuous variables. § indicates that the comparison was made on transformed data with independent samples t-test and † indicates the results of the non-parametric Mann- Whitney U-test. P-values for dichotomous variables are calculated by Fisher’s exact
test. Significant results are marked with asterisk.
Total (n=120)
MZ (n=76) DZ (n=44) p-value
Zigosity (nMZ:nDZ) 76:44 - - -
Sex (male:female) 38:82 26:50 12:32 0.54
Age (years) 52.0±20.8 49.5±25.0 55.0±14.0 0.26†
BMI 25.5±6.2 24.8±6.6 26.7±5.7 0.01§*
Smoking n(%) 24(20.0) 16(13.3) 8(6.7) 0.81
Diabetes n(%) 10(8.3) 4(3.3) 6(5.0) 0.17
Hypertension n(%) 28(23.3) 15(12.5) 13(10.8) 0.25 Hypercholesterolemia n(%) 15(12.5) 5(4.2) 10(8.3) 0.01*
43 4.1.2. TCCS study in Italian twins
The data of 19 MZ (38 persons) and 13 DZ Italian twin pairs (26 persons) were analysed after the exclusion of two MZ twin pairs due to inadequate acoustic window. The median age was 43.0 years in both the MZ and the DZ twins. There was no significant difference between MZ and DZ twins in terms of sex and age. Conversely, there was a significant difference in BMI across zygosity (p=0.01). No significant difference was observed regarding SBP, DBP, PP and MAP between the two groups. Table 2 shows the characteristics of the TCCS study population.
Table 2. Characteristics of the Italian TCCS twin study population. BMI: body mass index, DBP: diastolic blood pressure, DZ: dizygotic, MAP: mean arterial pressure, MZ:
monozygotic, SBP: systolic blood pressure, PP: pulse pressure, TCCS: transcranial color-coded duplex sonography. Data are shown as mean±standard deviation with
continuous variables that have normal distribution (DBP, PP, MAP) and as median±interquartile range with continuous variables that have non-normal distribution (age, BMI, SBP). § indicates that the comparison was made on transformed
data with independent samples t-test and † indicates the results of the non-parametric Mann-Whitney U-test. All other p-values for continuous variables were calculated on
non-transformed data with independent-samples t-test. P-values for dichotomous variables are calculated by Fisher’s exact test.
Total MZ DZ p-value
Zigosity (number of twin
pairs) 32 19 13 -
Sex (male:female) 23:41 14:24 9:17 1.00
Age (years) 43.0±23.0 43.0±22.0 43.0±20.0 0.57†
BMI 23.0±4.0 22.0±4.0 25.0±4.0 0.01§*
SBP 128.0±25.0 129.0±24.0 128.0±30.0 0.54§
DBP 81.2±11.9 81.5±12.3 80.7±11.5 0.80
PP 49.2±11.1 49.8±11.5 48.3±10.8 0.59
MAP 97.6±13.5 98.1±13.4 96.8±13.7 0.71
44 4.2. Results of the MRA and TCD study 4.2.1. The prevalence of CoW variants
Table 3 and 4 show the prevalence of variants of the anterior and posterior CoW. The most common anterior CoW configuration was the “normal” form of the CoW without hypoplasticity or absence in the ACA and anterior communicating artery (ACoA) (aA, 45.0%) followed by hypoplastic ACoA (aD, 25.8%) and absent ACoA (aE, 10.8%).
Among posterior CoW configurations bilaterally absent PCoA (pE, 22.5%) was the most commonly observed variant. Normal morphology (pA, 16.7%), bilaterally hypoplastic PCoA (pF, 15.0%) and unilaterally hypoplastic PCoA (pH, 11.7%) were also among the most common configurations. The total percentage of unilateral fetal configuration (pC, pD, pI, pJ, pK) was seen in 10.9%. No significant difference was observed regarding anterior and posterior CoW variants shown in Figures 2 and 3 between the MZ and DZ groups with one exception: bilaterally hypoplastic PCoA (pF variant) appeared in a significantly higher rate in the DZ group (p=0.02).
45
Table 3. Variants of the anterior CoW. aA: „Normal” variant with single, non- hypoplastic ACoA and ACAs. aB: Two ACoAs. aC: Unilateral ACA A1 segment hypoplasia. aD: hypoplastic ACoA. aE: Absent ACoA. aF: Medial artery of the corpus
callosum arising from the ACoA. aG: Two ACoAs with medial artery of the corpus callosum arising from the distal ACoA. ACA: anterior cerebral artery, ACoA: anterior
communicating artery, CoW: Circle of Willis, DZ: dizygotic, MZ: monozygotic.
Variant n (total) % (total) n (MZ) % (MZ) n (DZ) % (DZ)
aA 54 45.0 33 43.4 21 47.7
aB 9 7.5 6 7.9 3 6.8
aC 6 5.0 4 5.3 2 4.5
aD 31 25.8 19 25.0 12 27.3
aE 13 10.8 8 10.5 5 11.4
aF 6 5.0 5 6.6 1 2.3
aG 1 0.1 1 1.3 0 0.0