Application of Fractional Flow Reserve in the diagnostics of coronary artery disease
PhD thesis
Gábor G Tóth, MD
Semmelweis University – Doctoral School of Clinical Medicine
Consultant: Peter Andréka, MD, PhD
Official reviewers: Dániel Aradi, MD, PhD
András Komócsi, MD, DSc
Head of the Final Examination Committee: Mátyás Keltai, MD, PhD Members of the Final Examination Committee: Zoltán Ruzsa, MD, PhD
Tamás Ferenci, PhD
Budapest 2016
1. Table of content
2. The list of abbreviations 3
3. Introduction 4
3/1. Background 4
3/2. Fractional flow reserve 9
3/2.1 Definition 9
3/2.2 Calculation 9
3/2.3 Practical aspects 11
3/2.4 Fractional flow reserve characteristics 14 3/2.5 Clinical outcome data and specific anatomic settings 16
4. Objectives 23
5. Methods 29
5/1 Methods for QCA vs FFR study 29
5/1.1 Study population 29
5/1.2 Coronary angiography 29
5/1.3 Fractional flow reserve measurement 30
5/1.4 Statistical analysis 30
5/2 Methods for FFR vs FFRmyo study 31
5/2.1 Study population 31
5/2.2 Left and right heart catheterization 31
5/2.3 Fractional flow reserve measurement 31
5/2.4 Statistical analysis 32
5/3 Methods for Dose-response study 32
5/3.1 Study population 32
5/3.2 Intracoronary Doppler velocity measurement 33 5/3.3 Model for FFR dependence on adenosine dose 34
5/3.4 Statistical analysis 35
6. Results 37
6/1 Results for QCA vs FFR study 37
6/1.1 Overall relationship between angiographic metrics and FFR 37 6/1.2 Influence of patients’ characteristics 37
6/1.3 Influence of lesion characteristics 38
6/1.4 Diagnostic performance of 50% versus 70% DS 38 6/1.5 Optimal angiographic cut-off values for diameter stenosis 40
6/2 Results for FFR vs FFRmyo study 43
6/2.1 Relationship between FFR and FFRmyo 44
6/2.2 Effect of varied right atrial pressure values 46
6/3 Results for Dose-response study 48
6/3.1 Dose-response analysis 49
6/3.2 Effect of blood, saline and contrast medium 52
6/3.3 Dose-response model and impact on FFR 53
7. Discussion 55
8. Conclusion 66
9. Summary 67
10. Összefoglalás 68
11. Bibliography 69
12. Bibliography of the candidate's publications – related to the thesis 85 13. Bibliography of the candidate's publications – not related to the thesis 86
14. Acknowledgement 89
2. The list of abbreviations CAD - Coronary artery disease
CFR - Coronary flow reserve DS - Percent diameter stenosis FFR - Fractional flow reserve
FFRmyo - Myocardial fractional flow reserve LAD - Left anterior descending coronary artery LCA - Left coronary artery
LCx - Left circumflex coronary artery LM - Left main stem
MACE - Major adverse cardiac event MI - Myocardial infarction MLD - Minimal luminal diameter Pa - Aortic pressure
PCI - Percutaneous coronary intervention Pd - Distal coronary pressure
QCA - Quantitative coronary angiography RCA - Right coronary artery
RD - Reference diameter
3. Introduction 3/1 – Background
Despite all our preventive and therapeutic efforts cardiovascular disease is still the leading causes of death globally. In 2012 17.5 million people died in cardiovascular diseases, representing one third of the worldwide human mortality. More than half of these deaths occurred due to coronary artery disease (CAD). Since cardiovascular pathologies are typically the diseases of developed countries, numbers are not better in the European Union either. Latest statistics showed 1.9 million cardiovascular deaths yearly, taken almost 40% of the total mortality. Accordingly the costs are enormous, reaching 196 billion euro a year, where more than half derived from the health care costs, while the rest is coming from the productivity losses and the informal care.
Therefore, cardiovascular diseases mean a tremendous medical and economical issue.
However, it is important to realize that cardiovascular diseases are mainly well treatable when detected on time, and so cardiovascular death is well preventable with careful and appropriate medical care. Accordingly, as declared by the World Health Organization,
“people with cardiovascular disease or who are at high cardiovascular risk (due to the presence of one or more risk factors such as hypertension, diabetes, hyperlipidemia or already established disease) need early detection and management using counseling and medicines, as appropriate.” [1]
As a straight consequence, the pressure on the medical system and its players, the hospitals and medical crews, is enormous to manage properly the diagnostic work-up and treatment of patients with suspected CAD. Accordingly, accurate definition of significant or clinically relevant CAD has been in the focus of physiologists for many decades.
As principle the CAD becomes significant, when the blood supply of the myocardium is limited by a coronary stenosis to be less than the demand at any condition. However at the early years of invasive cardiology this principle was very poorly definable in the clinical practice, especially because true in vivo physiologic measures on the level of coronary arteries were markedly limited if not impossible at that time. Therefore, there was an urging need to translate physiology measures to morphology parameters, which were already approachable to some extent by coronary angiography. [2]
Milestone data have been published in the 1970ies by the working group of Gould, who aimed defining a clear link between morphological impairment and hemodynamic consequences based on animal experiments. Extensive measurements were performed in twelve anesthetized dogs after thoracotomy. Coronary blood flow was evaluated in the left circumflex coronary artery using perivascular electromagnetic flowmeter, while different levels of stenoses were generated by a snare, proximally positioned to the flow sensor. Coronary flow was determined during resting conditions, as well as during pharmaceutically induced hyperemia. Flow / stenosis correlation curve was determined
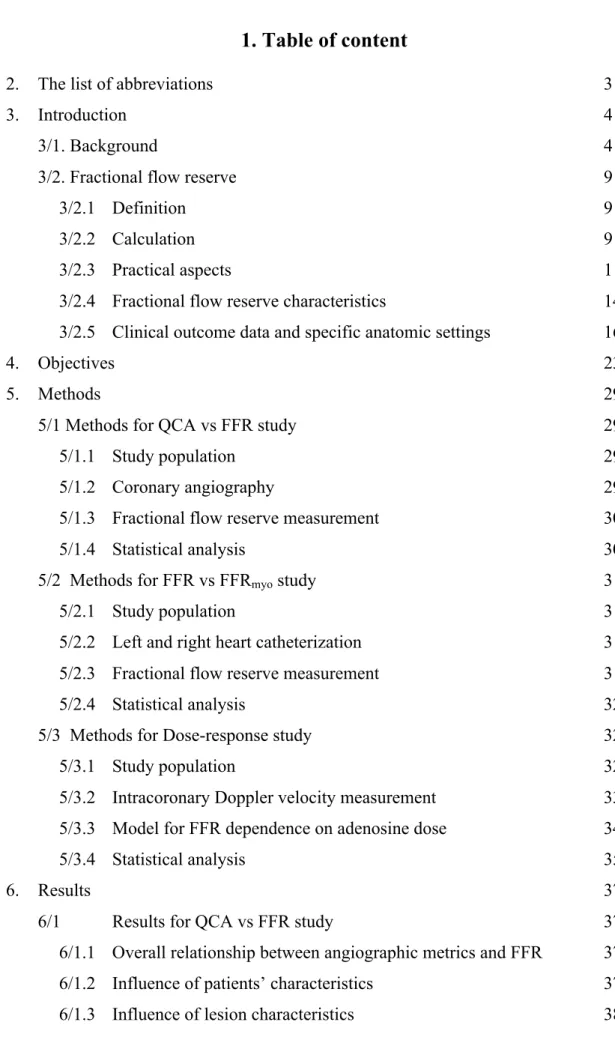
Figure 1 – Coronary flow measurements in dogs, while inducing different level of coronary stenosis. Results show that during resting conditions (dotted line) coronary blood flow remains stable until approximately 85% diameter stenosis, while during hyperemia (solid line) coronary blood flow starts to decline steeply already around 45% diameter stenosis. Adapted from Gould et al. [4]
from the sequential measurements. As Figure 1 shows, due to massive autoregulation mechanisms the resting flow had a stable, uneffected plateau until the constriction has reached 85 percent and it started to decline only above that stenosis severity. However, hyperemic response became damped already when 45 percent coronary narrowing was induced, and decreased precipitously much before resting flow was even affected. [3;4]
Physiologic background of this finding can be well explained by the excellent autoregulatory mechanism of the coronary artery system, including a macrovascular compartment and a microvascular compartment. [5-9] Although the description of all the complex humoral and cellular mechanisms behind is beyond the scope of this work, but the principle is crucial to be understood. The autoregulatory mechanisms of the coronary circulation have the role to stabilize the flow within a wide range of physiologic (or even pathologic) hemodynamic conditions, namely between approximately 50 and 140 mmHg mean arterial pressure. This stability can be achieved by the instantaneous constriction or relaxation of the precapillary resistance sphincters, resulting in increase or decrease in the total microvascular resistance, as a compensating response on changes in perfusion pressure. Accordingly, the resting coronary blood flow becomes independent from the hemodynamic conditions, at least within the wide physiologic range. [10] However, when we pharmacologically ‘exhaust’ the compensating mechanisms by using hyperemia inducing drugs, then markedly higher (uncontrolledly high) blood flow can be observed at baseline, which starts do decline already at stenosis of much slighter severity.
As physiologic measurements in humans were markedly limited due to lack of proper tools and questionable ethical reasons, based on the findings of Gould et al. 50%
diameter stenosis (DS) became the cornerstone of defining significant or obstructive coronary artery disease.
Consequently, the 50% diameter stenosis cut-off value has been used universally for 30 years: (1) it was applied for the validation of risk stratification formulas [11-14], to indicate and justify revascularization [13;14], to serve as an endpoint in studies on revascularization strategies [15-22] and to validate novel non-invasive techniques. [23- 26]
However, one might realize, while this cut-off value was defined in ‘young, healthy dogs’ in standardized coronary location, the population who undergoes cardiac
catheterization is more heterogeneous: in terms of age, in terms of extent of coronary sclerosis, in terms of cardiac- and non-cardiac comorbidities or in terms of medical history. Illustratively, it is wishful thinking that a stenosis of 50% DS in the left main stem of a young man has the same hemodynamic relevance, as a stenosis of 50% DS in the second marginal of an old, diabetic lady, with extensive post-infarct scar in the supplied territory.
Aligned with this example, the Clinical Outcomes Utilizing Revascularization and Aggressive Drug Evaluation (COURAGE) trial has pointed out first that revascularization is not as omnipotent as one might have believed. The trial has showed that with the indications of that time percutaneous revascularization not provides any benefit in terms of death, myocardial infarction or other major cardiovascular events, as compared to medical therapy. Of course, this finding has raised the question, whether our therapy is too weak or not the patients were selected who are really in need for treatment, i.e. revascularization? [17]
One must realize that the main prognostic factor is not purely the angiographic severity of the CAD, but the true presence and extent of ischemia. Therefore benefit from revascularization can be only expected when it eliminates ischemic risk, so when the ischemia inducing potential of that given coronary stenosis is proven [27] Figure 2. As consequence, there was a growing awareness that the link between the angiographic metrics and the ischemic potential of a stenosis is elusive and the revascularization- guiding power of angiographic metrics alone became doubtful, putting more and more emphasis on the need for additional functional evaluation. [28-32]
The presence, localization and extent of ischemia can be assessed by a large number of non-invasive testing, purportedly with acceptable accuracy. [33] Paradoxically, in clinical practice, only a minority of patients, who undergo a coronary angiography, undergoes also any clinically meaningful non-invasive functional test. [34;35] This disconnect relates mainly to the large number of clinical and logistical conditions that make the test difficult to perform, not uniformly available, time- or cost-consuming or challenging to interpret.
The development of coronary angioplasty [36] has already granted access to intracoronary pressure measurements opening a potential approach to physiologic understanding. In the early era of interventional cardiology a post-angioplasty pressure
Figure 2 – Clinical outcome after revascularization versus medical therapy, in correlation with the extent of ischemia. Comparison of mortality after revascularization (red line) versus after pure medical therapy (green line) in patients with CAD. Clinical benefit from revascularization as compared to medical therapy alone can be expected only in case of relevant territorial ischemia, namely more than 10% of the total myocardial mass.
Adapted from Hachamovits et al. [27]
gradient smaller than 20 mmHg was found indicative of a favorable clinical outcome.
[37] Also, coronary wedge pressure was a well recognized marker of collateral function.
[38-40] But the interest in coronary pressure measurements faded away due to three (primarily technical and conceptual) factors precluding the use of pressure measurement to assess stenosis severity: (1) the space occupied by the balloon in the stenosis induced an unpredictable overestimation of the pressure gradient; (2) the pressure gradient is highly dependent on aortic pressure; (3) resting rather than hyperemic pressure measurements were used.
These limitations have been circumvented by the development of pressure measuring guide wires [41] and the invention of the concept of fractional flow reserve (FFR) by
Pijls and coworkers in 1993 [42-44]. As it will be shown, thanks to all technical and conceptual advantages, after 20 years FFR become the standard of reference to define the ischemic potential of epicardial stenoses of intermediate angiographic severity based on outcomes of randomized trials. Accordingly, most recent revascularization guidelines strongly recommend, when non-invasive evaluation of ischemic burden is missing, invasive functional assessment by FFR has to be applied at the time of invasive coronary angiography in order to take appropriate decision about indicating or deferring revascularization. [45]
3/2 – Fractional flow reserve 3/2.1 Definition
FFR is defined as the ratio of maximal hyperemic myocardial blood flow in the presence of a stenosis to the physiologic maximal hyperemic myocardial blood flow in the same territory but in the absence of any stenosis. [42-44] Accordingly, this index expresses maximal achievable blood flow as a fraction (percent) of its theoretically normal value (i.e. in case the epicardial narrowing was absent). Thus, the value of FFR quantifies to what extent hyperemic flow is reduced by the presence of the epicardial narrowing. As a corollary, FFR also quantifies to what extent a revascularization procedure could increase myocardial perfusion. For example, an FFR value of 0.66 corresponds to maximal myocardial blood flow of 66% of its normal value. In this example, restoring the epicardial conductance will increase maximal flow by approximately 50% as compared to its pathologic status.
3/2.2 Calculation
It has been demonstrated that FFR, a ratio of two flows, can be calculated from the ratio of two pressures [44], the distal coronary pressure (Pd) divided by the proximal pressure, or aortic pressure (Pa) under maximal macro- and microvascular dilation. Since in a strictly normal epicardial artery Pd equals Pa [46], each patient and each segment acts as its own control.
Description of the complete mathematical derivation and its physiologic background is beyond the scope of this work. The summary of the princeps is indicated and explained in Figure 3. [42-44] Note, the accuracy and the physiologic meaning of FFR depend on
Figure 3 – Basic principle of measurement and calculation of fractional flow reserve.
FFR – fractional flow reserve; Qn – maximal flow in normal artery; Qs – maximal flow in stenotic artery; Pv – venous pressure; Pa– aortic pressure; Pd – distal coronary pressure; R – resistance of the coronary circulatory system
the induction of maximal hyperemia. Only upon abolition of all mechanisms responsible for the autoregulation of resting blood flow, one can state that the ratio of the Pd/Pa equals the corresponding flow ratio. Therefore, during maximal hyperemia and completely blocked autoregulatory mechanisms a linear relationship can be established between perfusion pressure and hyperemic flow, above 40 mmHg perfusion pressure.
[42-44;47] Note:
a. FFR can be derived from a ratio of two pressures, but fundamentally corresponds to ratio of two flows. Accordingly, FFR is the only pressure-derived index with a true physiologic meaning.
b. In contrast to a general belief, the definition of FFR does not assume that the microcirculation is normal. FFR quantifies the extent to which the epicardial stenosis contributes to reduced myocardial perfusion, regardless of the status of the microvascular function in that given patient. The microcirculatory function is
presumably often abnormal in patients undergoing coronary angiography and it is difficult to assess quantitatively, but microcirculatory dysfunction is not the target of interventional strategies and revascularization therapy. E.g. in a 80-year-old diabetic patient with an FFR of 0.85 in the proximal right coronary artery, the epicardial stenosis accounts for 15% of the reduction of myocardial perfusion. It can be the case that this patient has myocardial ischemia due to severe microvascular disease, which limits the maximal achievable coronary blood flow, but this cannot be eliminated by stenting a stenosis in the epicardial vessels. It is likely when this patient was 40 year younger and not diabetic and had a completely healthy microvascular compartment, the hyperemic flow would have been markedly larger, and in that status the exact same stenosis would have been a significant burden and was associated with a lower FFR. However, for clinical decision-making about revascularization it is important to know the present status of the patient and not that of 40 years ago.
More importantly, as described above, the formula of FFR calculation neglects central venous pressure, as it is considered to be a magnitude smaller as compared to the arterial pressures and therefore to have minimal or no impact on the calculation. For the
‘average’ CAD population it might be generalizable true. However as the use of FFR became broader and it is interrogated even in more severe patient population, such as valvular disease or cardiomyopathies, where the filling pressures are usually (far) above the normal range, the applicability of FFR became questioned. Accordingly the concept of FFR is nowadays often criticized due neglecting the right atrial pressure and indicated as a potential limitation in accuracy. [48;49] Therefore, as specified later, one of the goals of our work was to evaluate whether incorporation of central venous pressure in the FFR formula, namely measurement of myocardial FFR (FFRmyo) has any clinical relevance as compared to ‘traditional’ FFR measurement.
3/2.3 Practical aspects
• Pressure measuring guide wires.
A number of devices are commercially available: the PressureWireTM (St. Jude Medical, St. Paul, Minnesota, USA) and the WaveWireTM (Volcano, San Diego, California, USA), which are 0.014” guidewires, equipped with an electric pressure sensor; the
OptoWireTM (Opsens Medical, Quebec, Canada), which is also a 0.014” guidewire, equipped with a fiberoptic pressure sensor. In addition, a microcatheter with a fiberoptic pressure sensor, called NavvusTM (Acist Medical Systems, Eden Praire, Minnesota, USA), that can be advanced over a regular 0.014” guidewires has been developed to measure distal coronary pressure. The vast majority of the clinical research has been conducted with the PressureWireTM (St. Jude Medical, St. Paul, Minnesota, USA).
In the pressure-sensor guidewires the sensor itself is situated 3 cm proximal to the tip, at the junction between the non-radio-opaque and radio-opaque portions of the wires. The
‘maneuverability’ of the newest generations of all pressure-measuring guidewires is almost equivalent to any standard workhorse percutaneous coronary intervention (PCI) guidewire. Intravenous or intraarterial heparin should be given before manipulating a wire in the coronary arteries.
• Hyperemia
FFR can be accurately obtained only during maximal hyperemia, when all autoregulatory mechanisms are ‘switched off’. Intracoronary nitrate must be administered to reach full dilation of the epicardial vessels. Other hyperemic agents, listed in Table 1, completely and reproducibly minimize microvascular resistances. [42- 44] With the exception of nicorandil and nitroprusside, the effect of most hyperemic agent goes through the release of endogenous adenosine. The most frequently used hyperemic stimuli are intracoronary and intravenous adenosine.
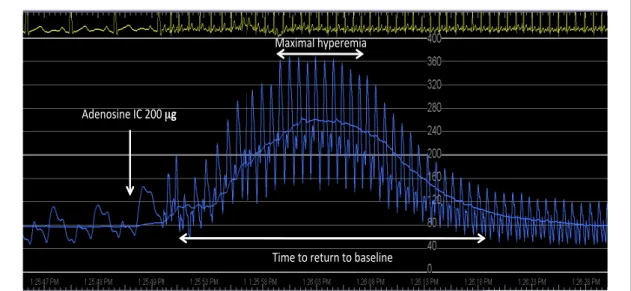
Intracoronary adenosine: Based on early validation experiments the optimal dosage of intracoronary adenosine was defined as 60 µg in the right coronary artery and 100 µg in the left coronary artery. However there are recurrent debates about the potential beneficial effect in terms of increased accuracy, when higher dosages are applied for FFR measurements. [50] As specified later, one of the goals of our work was to define clearly the optimal dosage of intracoronary adenosine for the accurate and reliable measurement of FFR. An example of a typical coronary pressure tracing during the administration of intracoronary adenosine is shown in Figure 4.
Intravenous adenosine: Most early clinical data have been obtained with intravenous adenosine. This method provides with stable maximal hyperemia, but also allows maintaining it for a longer time, when indicated. Therefore, in daily practice it is mainly applied, when (1) intracoronary administration is unreliable (for example in case of
Table 1 – Different pharmacons used for hyperemic stimulus
Epicardial vasodilatation Dosage
• Isosorbide dinitrate: 200 µg intracoronary bolus Microvascular vasodilatation Dosage
• Adenosine: 60-100 µg intracoronary bolus
140 µg/kg/min intravenous infusion
• Papaverine:* 8-12 mg intracoronary bolus
• Nitroprusside: 0.6 µg/kg intracoronary bolus
• Regadenoson: 400 µg intravenous slow bolus
* Not recommended due to frequent occurrence of Torsade De Pointes ventricular tachycardia
ostial stenosis) or when (2) pullback measurement has to be performed for the evaluation of multiple serial stenoses. It is recommended to infuse through a central
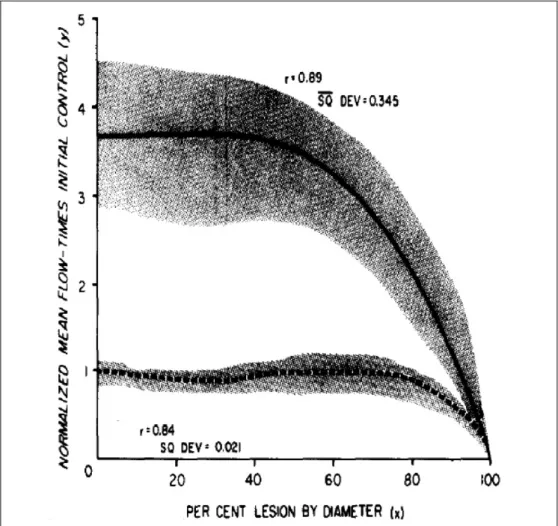
Figure 4 – Fractional flow reserve tracing. An example of a typical coronary pressure tracing during the administration of intracoronary adenosine. Red curve indicates the aortic pressure, while green curve indicates the distal coronary pressure. Different phases of the measurement, namely baseline, induction of hyperemia and hyperemic phase are indicated on the top of the figure. Please note the separation of the two curves after administration of intracoronary adenosine.
venous line 140 µg / body weight kg / minute adenosine, however data suggests that a simple antero-cubital venous access is also reliable in most patients. The latter has an increasing importance and advantage with the increasing use of radial approach. [51]
3/2.4 Fractional flow reserve characteristics
FFR has a number of characteristics making this index particularly suitable for functional assessment of coronary stenoses and clinical decision-making in the catheterization laboratory.
• Normal value
Since in a normal epicardial artery there is virtually no decline in pressure, Pa equals Pd
along the whole coronary artery, meaning that the normal value of FFR is 1.0. An unequivocally normal value is easy to refer to. FFR of angiographically normal coronary arteries was investigated, comparing individuals without any atherosclerosis and patients with angiographic stenoses in another coronary artery. In the first group FFR was near unity, indicating no resistance to flow in truly normal coronary arteries.
In contrast, in the second group of patients with remote coronary atherosclerosis, FFR was found significantly lower indicating the presence of diffuse atherosclerosis without any solid narrowing. Note that angiogram defines stenosis as a narrower segment as compared to the surrounding segments, hypothesizing that the latter are normal. [52]
• Influence of blood pressure and heart rate
For a given coronary stenosis FFR has been shown to be stable despite changes in heart rate and blood pressure, at least within the physiologic autoregulatory range. [53;54]
Several factors may explain this relative insensitivity to hemodynamic changes: (1) In contrast to any flow velocity based measurement, the pressure signal is devoid of
‘noise’; (2) Aortic and distal coronary pressures are measured simultaneously, and will therefore be influenced simultaneously by systemic pressure and by heart rate; (3) Adenosine agonists induce an extremely reproducible maximal vasodilation of the microvasculature, while nitrate derivates expand the epicardial vessels reliably and reproducible. Accordingly, FFR measurements are highly reproducible. Both, the
clinical value of FFR, as well as the trust in its value for decision-making are based on this reproducibility.
• Contribution of collaterals
Oxygen and other nutrients can reach the myocardium antegrade, through the normal epicardial arteries, or retrograde through collateral vessels. Distal coronary pressure takes into account both antegrade and retrograde flows. Therefore, FFR accounts for the summed blood supply, including the flow through native coronary arteries, as well as the collaterals. Collateral function alone can be assessed by distal pressure during occlusion. The higher the distal occlusive wedge pressure, the better the protective role of collaterals for myocardial function. [40;55;56]
In addition, it is important to keep in mind that in case of a coronary artery, which provides collaterals to an occluded artery and therefore supplies much larger myocardial territory then normally, blood flow will increase. Accordingly, in case of a stenosis the transstenotic gradient will be larger and FFR will be lower than if collaterals were absent. Figure 5. Yet the influence of collaterals on the donor artery is modest. [57]
• Spatial resolution
When the decision has to be taken in the catheterization laboratory, the operator has to know exactly, where the ischemia is generated: in which vessel, in which segment, at which millimeter. Since the location of the pressure-sensor of the guidewire is accurately definable and modifiable within the coronary tree, FFR can provide the operator with an extreme high spatial resolution, exceeding any other functional test.
• Cut-off values
In keeping with its theoretical definition, the normal value of FFR equals 1.0. An FFR value of 1.0 indicates the absence of resistance along the epicardial artery. Any value lower than 1.0 is abnormal, but it is not necessarily able to induce myocardial ischemia.
Validation studies have showed that the optimal cut-off threshold for ischemia is between 0.75 and 0.80. [58;59] These cut-off values were defined by comparison to one or several non-invasive tests, which had to be positive prior to revascularization and reverse to negative after revascularization. FFR value >0.80 is associated with the absence of ischemia during stress, while stenoses with an FFR ≤0.80 are almost
uniformly associated with myocardial ischemia and potential clinical consequences.
[44;58-60]
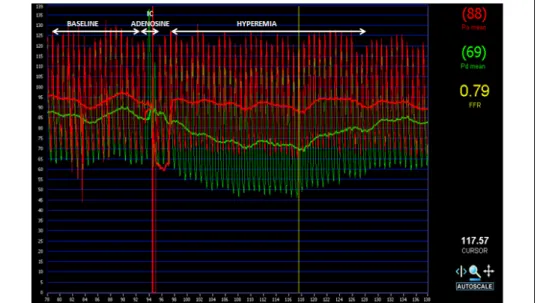
Figure 5 – Role of collaterals. In case of a coronary artery, which provides collaterals to an occluded artery, the supplied myocardial mass and consequently the blood flow are much larger then normally. Accordingly, in case of a stenosis the transstenotic gradient will be larger and FFR will be lower than if collaterals were absent. (Panel A). On the contrary, in case of a coronary artery with tight stenosis, whose territory is also supplied through collaterals from another artery, the transstenotic gradient will be smaller and FFR will be higher than if collaterals were absent. (Panel B)
3/2.5 Clinical outcome data and specific anatomic settings
Clinical outcome data of patients in whom decision-making has been based on FFR are available in most anatomic settings:
• Angiographically intermediate stenoses
The distinction between very mild and critical stenoses is usually not problematic by conventional coronary angiography, but decision-making in the range between can be cumbersome or even inconsequent. [61] Accordingly, stenoses angiographically defined
between 30 and 90% are usually considered ‘moderate’, ‘intermediate’, ‘dubious’,
‘borderline’, ‘non-flow limiting’. The richness of our vocabulary to describe these stenoses testifies of our inability to assess their functional consequences on blood flow and on clinical outcome. The main indication of FFR is the assessment of stenoses with unclear hemodynamic significance. [45] As already discussed, pivotal animal studies by Gould et al. [3;4] have shown that flow starts to decline when a stenosis exceeds half of the reference diameter and therefore the 50% diameter stenosis has become the cornerstone of defining obstructive coronary artery disease. But data suggest that the 50% diameter stenosis might be inaccurate to be used for individual decision-making in real life patient population. [62;63]
As specified later, one of the goals of our work was to evaluate on a large population, whether any angiographic measure could be sufficiently accurate for the definition of ischemic potential of an individual lesion. When assessing functional severity, FFR is more accurate than exercise ECG, myocardial perfusion scintigraphy and stress echocardiography taken separately. Furthermore, in patients with ‘intermediate’
stenoses, the results of non-invasive tests are often contradictory, which renders appropriate clinical decision-making difficult. [58;64] As shown in the DEFER and the FAME 2 studies, the major adverse cardiac event rate of patients with angiographically intermediate stenoses, in whom revascularization was deferred due an FFR>0.80 is around 3% per year and this risk cannot be further decreased by PCI. [65-68]
• Left main stem disease
The left main is unique in many respects: (1) it is the largest coronary segment, perfuse the largest myocardial territory and its disease has major prognostic implications; (2) the left main is difficult to assess on angiography because it is ostial, short, and bifurcated; and (3) non-invasive assessment of the left main is clouded by many theoretical and practical limitations. FFR measurements in left main stenoses are feasible and reliable provided some precautions are taken.
Studies have shown that FFR is reliable for decision-making about revascularization in patients with left main stenosis, meaning that a lesion with FFR > 0.80 can be safely treated medically alone, while a lesion with FFR ≤ 0.80 requires revascularization:
either surgically or interventional. [69]
Left main stenoses are often associated with additional stenoses in the left anterior descending and/or the left circumflex coronary arteries. The presence of a stenosis downstream limits hyperemic flow across the left main stenosis. The extent to which a second lesion affects the FFR measurement across a left main stenosis depends on the severity of the second lesion and of the myocardial mass supplied by that vessel. Yet in practice, it appears that the underestimation of the LM severity by the presence of a second stenosis in the LAD becomes clinically significant only in case of very tight LAD stenosis. [70]
• Multivessel disease
Patients with ‘multivessel disease’ represent a very heterogeneous population characterized by differences in clinical history, in comorbidities, in number of lesions, in their location and in their degree of complexity. The benefit of FFR-guided multivessel PCI compared with standard angiography guidance has been demonstrated in the FAME multicentric randomized clinical trial (Fractional Flow Reserve Versus Angiography for Multivessel Evaluation study). Patients in whom PCI was guided by FFR had significantly less ‘hard events’ (death and myocardial infarction) than patients in whom PCI had been guided solely on the basis of the angiogram. [71-72] These results were achieved at significantly lower cost and without prolonging the procedure.
[73]
• FFR and myocardial infarction
Regarding the use of FFR in patients during or after myocardial infarctions one should distinguish several clinical settings.
In the setting of an ST-elevation acute myocardial infarction, there is no need for FFR measurements in the culprit artery. The clinical question is not whether the lesion is hemodynamically significant, and in addition, measurements performed in these circumstances would be of no value. During the acute phase of an acute coronary syndrome, myocardial dysfunction and oedema, microvascular stunning and spasm, thrombus embolization, etc. preclude microvascular dilation. These changes are dynamic in nature. Measurements related to the culprit vessel, obtained during the acute phase may be different from those obtained later, making FFR assessment of the culprit lesion potentially misleading. Several days and weeks after a myocardial infarction
occurs, the previously viable myocardium is partially replaced by scar tissue with a subsequent decrease of the myocardial mass to be perfused. [59] Accordingly, for an anatomically unchanged lesion, hyperemic flow and gradient will both decrease and FFR will increase. This principle is illustrated in Figure 6.
FFR measurements in the non-infarct artery reliably detect the ischemic potential even during primary PCI. It has been shown that FFR measurements in the non-culprit lesions during the acute phase of a myocardial infarction are similar to those obtained several weeks later. [74] This suggests that the diagnostic work-up of most patients admitted with an acute coronary syndrome could be entirely performed in the catheterization laboratory in one stage.
In the setting of non-ST elevation myocardial infarction the use of FFR measurement for the evaluation of the culprit lesion(s) is still debatable. However, in the
Figure 6 – Impact of old myocardial infarction on the functional relevance of a given stenosis. In case a coronary artery with a stenosis supplies a myocardial territory, containing scar due to former myocardial infarction, the blood flow is much smaller then normally. Accordingly, the transstenotic gradient will be smaller and FFR will be higher than if the supplied territory was completely healthy myocardial tissue, free from scar tissue.
FAMOUS-NSTEMI trial patients with non-ST elevation myocardial infarction were 1:1 randomized between angiography-guided versus FFR-guided revascularization.
Although fewer patients underwent revascularization in the FFR-guided group, there was no difference in clinical outcome, including death, myocardial infarction, unplanned hospitalization or stroke during 12 months follow-up. [75]
• Diffuse disease
Coronary atherosclerosis is diffuse in nature and true isolated stenoses in an otherwise normal artery are exceptional. The concept of a focal lesion is mainly an angiographic
perception that does not reflect the underlying pathologic setting. Until recently, it was believed that when no focal narrowing of >50% was seen at the angiogram, flow and resistance were normal. It was therefore assumed that distal pressure was normal and thus that ‘diffuse mild disease without focal stenosis’ could not cause myocardial ischemia. This paradigm has recently been shifted thanks to better understanding by measuring FFR along the coronary artery: the presence of diffuse disease is often associated with a progressive decrease in coronary perfusion pressure and flow [52], which might even reach pathologic low values in the distality. This effect is difficult to predict from the angiogram. In contrast this decline in pressure correlates with the total atherosclerotic burden. [76] In approximately 10% of patients this abnormal epicardial resistance may be responsible for reversible myocardial ischemia. In these patients chest pain is often considered non-coronary because no single focal stenosis is found, and the myocardial perfusion imaging is wrongly considered false positive (actually a false
‘‘false positive’’). [77] Such diffuse disease and its hemodynamic impact should always be kept in mind when performing functional measurements Note, this diffuse disease is usually not correctable by PCI but it is responsible for the persisting low FFR values which are often found after otherwise successful stenting. In addition diffuse atherosclerosis goes along with abnormal vasomotion. [78]
• Sequential stenoses
When several stenoses are present in the same coronary artery, each of them will influence hyperemic flow and therefore the pressure gradient across the other one. The FFR can theoretically be calculated for each stenosis individually. [79;80] However, this is neither practical nor easy to perform. In practice, it is essential to keep in mind the ‘hemodynamic cross talk’ between the different stenoses. The influence of a distal stenosis on the more proximal is more pronounced than the reverse. A pull-back pressure recording under maximal hyperemia is the best way for identifying the exact location and physiological significance of sequential stenoses individually.
• FFR in bifurcation lesions
Bifurcation stenoses are particularly difficult to be evaluated on angiography. The principle of FFR-guided PCI applies logically also in bifurcation lesions even though separate clinical outcome data are currently still limited. The use of FFR for decision-
making in terms of complexity of bifurcation PCI has been thoroughly investigated by Koo et al. [81-83] The results of these studies can be summarized as follows: (1) After stenting the main branch, the jailed ostium of the side branch is often narrowed at angiography. Such stenoses are grossly overestimated by angiography: Koo et al. found that none of the ostial lesions with a diameter stenosis <75% were found to have an FFR below 0.75. (2) When performing kissing balloon dilation only in ostial stenoses with an FFR <0.75, the FFR at 6 months was >0.75 in 95% of all cases.
• Small vessels
Angiographic evaluation of lesion severity in small vessels is difficult, not only because of the resolution derived intrinsic inaccuracy of angiographic measures, but also due to the small supplied myocardial mass. On the other hand, considering the poor performance of current revascularization techniques in small vessels, unnecessary intervention should be avoided. As shown by Puymirat et al., compared to angiographic guidance FFR-guided revascularization of small vessels is associated with improved long-term clinical outcome, mainly driven by significant benefit in non-fatal myocardial infarction and target vessel revascularization. [84]
• Post-Intervention FFR
After successful stenting no noticeable hyperemic gradient should be present across a well-deployed stent. [85] Even though malapposed struts might induce turbulent flow, FFR is not a good tool for identifying malapposition or underexpansion of the stent.
However, the hyperemic pressure pull-back recording is an informative tool for assessing the extent and significance of residual ischemia, induced within-, proximal- or distal to the stent. [86;87]
• FFR for indicating bypass grafting
Data about FFR-guided surgical revascularization are limited. An observational study showed that graft occlusion rate is twice as high at one year when the graft was placed on a vessel with functionally non-significant lesion, than when placed on a vessel with functionally significant stenosis. There was also a trend suggesting that this hold true for arterial grafts. [88] Until now the clinical consequences of FFR-guidance prior bypass surgery was examined only in a retrospective registry. Our working group showed that patients with angiographically similar coronary artery disease severity are
receiving markedly less grafts, when at least one intermediate lesion is treated according to the value of FFR (deferred or grafted), as compared to the purely angio-guided controls. Of note, the lower number of grafts was associated neither with potential hazard in terms of death, myocardial infarction or target vessel revascularization nor with more symptoms during 5 years follow-up. [89]
Better understanding can be expected after the results of GRAFFITI trial (NCT01810224), where patients are randomly assigned to FFR-guided versus angiography-guided surgical revascularization.
Similarly, the FAME 3 trial (NCT02100722) investigates the potential benefits of FFR guidance in angiographically severe multivessel disease, assigning patients randomly to FFR-guided percutaneous revascularization versus angiography-guided surgical revascularization.
• FFR for revascularization in sclerotic bypass grafts
Data from a retrospective registry suggest the beneficial effect of FFR-guided revascularization of sclerotic bypass grafts. An FFR-guided PCI strategy of coronary bypass grafts was found to be associated with significantly lower rate of major adverse cardiac and cerebrovascular event at long-term follow-up, as compared to angiographic guidance. Additionally, procedural costs were found to be significantly lower, as well.
[90]
4. Objectives
As described above in details, FFR has opened a novel approach to functional assessment of coronary artery stenoses, and it has become the standard of reference to define the ischemic potential of epicardial stenoses of intermediate angiographic severity based on outcomes of randomized trials.
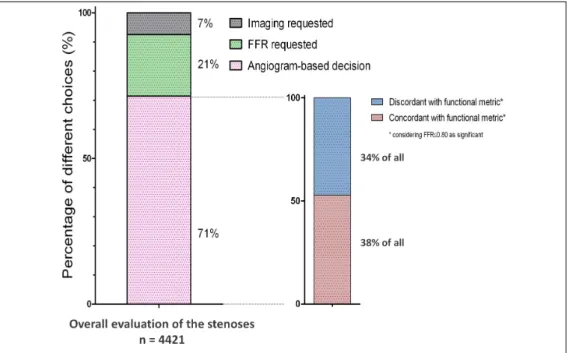
Despite powerful outcome data and the highest level of recommendation by European revascularization guidelines the adaptation by the interventional cardiologists community is still limited. As the results of International Survey on Interventional Strategy have showed, interventional cardiologists are still prone to make decisions about intermediate stenoses purely on the basis of its angiographic appearance in almost three quarter of all cases, even when non-invasive proof of ischemia is missing, and even, when the use of additional invasive diagnostic tools is not restricted by financial limitations. Figure 7. Although the ESC class I recommendation for FFR would apply to all 12 lesions in our survey, given their intermediate nature and absence of prior functional testing, no respondent selected FFR for 100% of the cases. A single respondent out of 495 (0.2%) selected FFR in 10 of the 12 cases (the highest FFR user among all), while 133 of the 495 Participants (27%) never selected FFR at all, indicating a major disconnect between recommendations and true clinical practice.
Decisions were still dominantly based on pure angiographic appearance with questionable validity. [61]
What can be the cause in the background? Since the survey was designed to eliminate all the potential extrinsic burdens, we have to believe that the disconnect between practice and guidelines is due to remaining uncertainties, if any. Indeed, there might be some important questions regarding the concept, causing potential hesitation against its unlimited clinical applicability. Which can be these questions, inducing uncertainties?
In the initial validation studies FFR was measured during left and right heart catheterization, as right atrial pressure was added in the computation of FFRmyo, as explained in details above. Currently, as being the routine tool of interventional practice, FFR is measured during standard coronary angiography by positioning a pressure wire across the coronary stenosis, and calculated as the simple ratio of distal coronary pressure (Pd) and aortic pressure (Pa) during stable and maximal hyperemia without accounting for the right atrial pressure (Pra). This simplification assumes that right atrial
Figure 7 - Distribution of different decisions and the appropriateness of purely angiogram-based decisions in International Survey on Interventional Strategy. Left panel shows the distribution of decisions over the entire dataset: In 7% of all evaluations an imaging modality (quantitative coronary angiography, intravascular ultrasound or optical coherence tomography) was requested and in 21% the need for FFR was expressed. In the rest 71% angiography was found sufficient by the Participants to decide about significance. Among the latter, the proportion of concordance and discordance with the known functional metric is depicted in the right panel. Adapted from Toth G et al. [61]
pressure can be neglected as it has a magnitude difference as compared to the arterial values and so it would have limited impact on the calculated FFR value. Ever since, this assumption has been confirmed and supported by the excellent clinical outcome of patients managed according to the simplified FFR measurement. All the clinical outcome data obtained after FFR-guided decision-making are based on the simple Pd/Pa
ratio, during maximal hyperemia. Deferring intermediate coronary stenoses of stable patients with single vessel disease and FFR above 0.75 has been demonstrated to be safe and associated with excellent clinical outcome up to 15 years [65]. In the FAME and FAME 2 studies a safer cut-off value of 0.80 has been adopted to take into account the intrinsic variability of FFR. Here, an FFR value higher than 0.80 has shown a
negative predictive value over 95%, and FFR-guided revascularization has resulted into a superior clinical outcome as compared with medical therapy or with angiography guided revascularization strategies [66;67;71;72]. These evidences, along with its ease of measurement, have facilitated a growing adoption and broadening field of indication for FFR assessment of coronary stenoses.
As field of application got wider, debates have risen again about FFRs’ universal applicability and validity including patients with elevated right atrial pressures, such as patients with myocardial or valvular heart failure. [48;49] Accordingly, this question requires clarification.
Similarly, as the cornerstone of FFR measurement is the reliable and stable maximal hyperemia, its proper induction is also recurrently debated. While studies of intracoronary adenosine doses and Doppler flow velocity evaluation exist in the literature, no prior study has created sufficiently detailed and convincingly extensive dose-response curve in patients. Therefore the sense or non-sense of applying further increased, extreme dosages of adenosine is a recurring issue, requiring clarification. The original work applying adenosine to the human coronary circulation recorded Doppler velocity response in 33 arteries for a lower range of intracoronary adenosine from 2 to 16 µg only, using intracoronary papaverine as the comparator. [91] They observed that 16 µg produced hyperemia within 10% of papaverine in 90% of patients, consistent with our findings of a large increase in flow at even low doses of intracoronary adenosine but submaximal in some cases. A smaller study monitored Doppler velocity in 12 patients starting at 50 µg of intracoronary adenosine then increasing until a maximal response or side effects. [92] Their mean dose of intracoronary adenosine that produced maximum hyperemia was 230 µg. A larger study of 457 patients found a significant increase in Doppler flow velocity with increasing doses of adenosine, albeit between two modest doses of intracoronary adenosine (average 24 µg versus 35-36 µg).
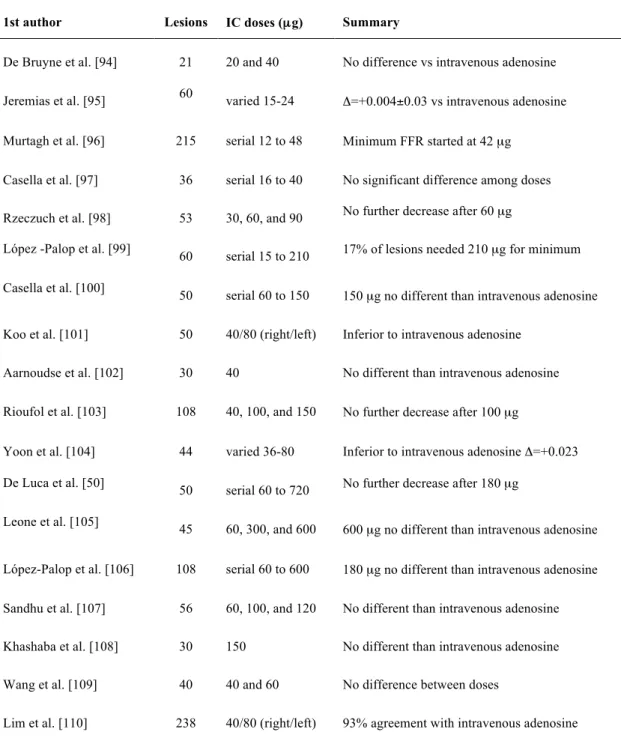
[93] Table 2 summarizes 18 published studies over 15 years measuring FFR in 1,294 lesions using either serial doses of intracoronary adenosine or comparing intracoronary to intravenous adenosine. [50;94-110] With rare exceptions, all studies found no significant decrease in FFR with intracoronary adenosine doses beyond 100 to 210 µg and/or demonstrated equivalence between intracoronary and intravenous administration.
Table 2 – Definition of optimal dosage of adenosine. Studies in the literature, investigating optimal dosing of intracoronary adenosine for the measurement of FFR
1st author Lesions IC doses (µg) Summary
De Bruyne et al. [94] 21 20 and 40 No difference vs intravenous adenosine Jeremias et al. [95] 60 varied 15-24 Δ=+0.004±0.03 vs intravenous adenosine Murtagh et al. [96] 215 serial 12 to 48 Minimum FFR started at 42 µg
Casella et al. [97] 36 serial 16 to 40 No significant difference among doses Rzeczuch et al. [98] 53 30, 60, and 90 No further decrease after 60 µg
López -Palop et al. [99] 60 serial 15 to 210 17% of lesions needed 210 µg for minimum Casella et al. [100] 50 serial 60 to 150 150 µg no different than intravenous adenosine
Koo et al. [101] 50 40/80 (right/left) Inferior to intravenous adenosine Aarnoudse et al. [102] 30 40 No different than intravenous adenosine Rioufol et al. [103] 108 40, 100, and 150 No further decrease after 100 µg
Yoon et al. [104] 44 varied 36-80 Inferior to intravenous adenosine Δ=+0.023 De Luca et al. [50] 50 serial 60 to 720 No further decrease after 180 µg
Leone et al. [105] 45 60, 300, and 600 600 µg no different than intravenous adenosine
López-Palop et al. [106] 108 serial 60 to 600 180 µg no different than intravenous adenosine Sandhu et al. [107] 56 60, 100, and 120 No different than intravenous adenosine Khashaba et al. [108] 30 150 No different than intravenous adenosine Wang et al. [109] 40 40 and 60 No difference between doses
Lim et al. [110] 238 40/80 (right/left) 93% agreement with intravenous adenosine
As shown debates are still rising against some building stones of FFR, such as (1) its disposability by angiographic metrics, (2) its applicability in patients with heart failure and elevated filling pressure values or (3) the proper way of measurement concerning the induction of hyperemia. Therefore the aims of this work and their perspectives are described as follows:
(1) In daily practice the vast majority of decisions about revascularization are based on diameter stenosis (DS) as gauged by visual estimation on coronary angiogram.
Anatomic severity on quantitative coronary angiography (QCA) is limited or
‘one dimensional’ oversimplified measure of stenosis severity that do not account for all aspects of severity, especially for ‘intermediate’ stenosis. Accordingly, the first goal of the present work is to analyze the concordance or discordance between stenosis severity by QCA and by FFR in a large unselected patient cohort. (This topic will be referred as QCA vs FFR study)
(2) As described above, since in the majority of patients with coronary artery disease right atrial pressure is low, the latter is neglected in the calculation of FFR and the ratio of mean distal coronary pressure and mean aortic pressure at maximum hyperemia is simply called FFR. The omission of right atrial pressure simplifies FFR calculations during routine diagnostic coronary angiography.
Yet, whether FFR measurement is still reliable across a wide range of hemodynamic conditions, e.g. in patients with heart failure, is not clear and therefore a frequent target for criticism. Accordingly, the second goal of this work was to assess the impact, if any, of a wide range of right atrial pressures on FFR assessment and on FFR-guided clinical decision-making. (This topic will be referred as FFR vs FFRmyo study)
(3) As described in details above, FFR relates the current maximum blood flow in a stenotic artery to the potential maximum blood flow in absence of the lesion. Note, only under conditions of maximal hyperemia does the pressure ratio between the distal coronary artery and aorta equal the maximum flow ratio between stenotic and normal conditions, therefore reliable induction of maximal hyperemia is crucial for accurate measurement. For a variety of reasons, intracoronary adenosine has been used more commonly in daily practice and in the clinical literature. Despite this widespread adoption of intracoronary adenosine, a recurring debate still exists regarding its optimal dose. Therefore, the third goal of this work is to define the dose-response relationship between intracoronary adenosine and its resulting hyperemia. (This topic will be referred as Dose-response study)
The three main studies of this work are logically well linked by (1) assessing the discrepancies between morphological appearance of a given coronary stenosis and true functional relevance, accordingly emphasizing the indication for consequent use of FFR in clinical practice (QCA vs FFR study); (2) evaluating the conceptual validity of the applied formula (FFR vs FFRmyo study); and (3) defining the proper practice for accurate measurement (Dose-response study). But as they are markedly different in terms of population size, methodology, statistical methods etc., for didactic reasons they will be presented separately over the Methods and Results paragraphs.
5. Methods
5/1 – Methods for QCA vs FFR study 5/1.1 Study population
Between September 1999 and December 2011, 37.047 coronary angiograms and 14.989 PCI’s were performed in the Cardiovascular Center Aalst, Aalst, Belgium. Among them, 2.986 patients (appr. 1:5 relation as compared to PCI’s) underwent both QCA and FFR measurements in at least one stenosis. Only stable coronary stenoses were considered (patients with stable CAD, or the non-culprit vessels of patient with acute CAD).
Repeated measurements of the same lesion in the same setting were excluded.
Measurements of multiple stenoses in the same patient could be included. These data were stored prospectively in the local database together with the clinical characteristics and constitute the basis of the present analysis. All subjects gave written informed consent approved by the local ethics committee prior to undergoing coronary angiography.
5/1.2 Coronary angiography
Coronary angiography was performed by a standard percutaneous femoral or radial approach with a 6 or 7Fr diagnostic- or guiding catheter. After administration of 200-300 µg intracoronary isosorbide dinitrate, the angiogram was repeated in the projection allowing the best possible visualization of the stenosis.
QCA was performed based on the technology, described previously, [111;112] using one of the following software: Siemens Healthcare Axiom Artis VB35D110803 (Siemens Medical Solutions, Siemens AG; Forcheim, Germany); Siemens Healthcare ACOM.PC 5.01 System (Siemens Medical Solutions, Siemens AG; Forcheim, Germany); General Electric AW VolumeShare 6E (General Electric Inc., Fairfield, Ohio, US). All measurements were obtained by an experienced technician, unaware of the FFR results. Data were introduced on a different page of the database. The projection was chosen to avoid, as far as possible, foreshortening or overlap of other arterial segments. The contrast-filled catheter was used for calibration. From an end- diastolic still-frame, reference diameter (RD, mm), minimum luminal diameter (MLD,
mm), percent diameter stenosis (DS, %) and lesions length were calculated. The coronary arterial segments were defined according to the American Heart Association and modified for the ARTS I and II studies. [113] Segment 5 corresponds to the left main stem (LM), and segments 4, 10, 13, 14, 15, 16 and 17 were considered ‘distal’.
5/1.3 Fractional flow reserve measurement
FFR was measured as above described in details. Briefly, after intracoronary administration of isosorbide dinitrate (200 µg), a pressure monitoring guide wire (St.
Jude Medical Inc., St. Paul, Minnesota, US) was advanced distal to the coronary artery stenosis. Hyperemia was obtained after administration of intravenous (continuous infusion of 140 µg/kg/min, 18% of all cases) or intracoronary (bolus of 50-150 µg, 79%
of all cases) adenosine or intracoronary Papaverine (bolus of 10-20 mg, 3% of all cases).
FFR was defined as the ratio of the simultaneously recorded mean arterial pressure distal to the stenosis and the mean aortic pressure at the tip of the guiding catheter during stable, steady state hyperemia. An FFR value ≤0.80 was considered ‘positive’, i.e. likely to induce reversible myocardial ischemia. An FFR value >0.80 was considered ‘negative’, i.e. unlikely to induce reversible myocardial ischemia.
5/1.4 Statistical Analysis
All analyses were performed with Prism GraphPad 5.0 (GraphPad Software Inc., California, US) and SPSS 20.0 (IBM Inc., New York, US). Summary descriptive statistics are reported as mean ± standard deviation, median (inter quartile range) or counts (%), as appropriate. 95% confidence intervals (CI) are added, as appropriate.
Normal distribution was tested with the D’Agostino-Pearson omnibus K2 test.
Correlation among variables was determined by Pearson or Spearman correlation tests, as appropriate and expressed in r value. Sensitivity, specificity, diagnostic accuracy, and optimal diagnostic cut-off value were defined from the calculated receiver operator characteristic curves, as appropriate. Receiver operator characteristics curves were compared as described by Hanley et al. [114] Optimal diagnostic cut-off value was defined based on the Youden’s index, calculated as [(sensitivity + specificity) – 1],
namely where the sum of sensitivity and specificity is maximized. Logistic regression analysis was performed to assess the impact of various clinical and anatomical characteristics on the accuracy of 50% DS cut-off value in predicting FFR ≤ 0.80. P for interaction was calculated within all subgroups, as appropriate. A probability value of p<0.05 was considered statistically significant.
5/2 – Methods for FFR vs FFRmyo study 5/2.1 Study population
Between 1997 and 2013 approximately 45.000 coronary angiograms were performed in the Cardiovascular Center Aalst, Aalst, Belgium. Among them 1.235 patients (~3%) underwent both left- and right heart catheterization and FFR measurement in at least one coronary stenosis, as indicated by operators discretion. Data were stored prospectively in the local database together with the clinical characteristics and constitute the basis of the present analysis. All subjects gave written informed consent to the use of anonymized clinical data for research purposes.
5/2.2 Left and right heart catheterization
Procedures were performed by a standard percutaneous femoral approach, 6F diagnostic catheters were used for injecting the coronary arteries and obtaining pressure values in the left heart, including aortic and left ventricular pressures, 8F Swan-Ganz catheter was used for obtaining pressure values in the right heart, including right atrial-, right ventricular-, pulmonary arterial- and pulmonary capillary wedge pressures.
5/2.3 Fractional flow reserve measurement
We measured and calculated FFR and FFRmyo for every coronary stenosis in the range between 30-90% diameter stenosis by visual estimate. FFR was measured as above described in details. Briefly, a calibrated pressure monitoring guide wire (PressureWireTM, St. Jude Medical Inc., St. Paul, Minnesota, US) was advanced distal to the coronary artery stenosis. After an intracoronary bolus of isosorbide dinitrate
(200 µg), maximal hyperemia was induced by either intravenous infusion (140 µg /kg/min) or an intracoronary bolus (>100 µg) of adenosine.
FFR was calculated as follows:
FFR = Pd
Pa
where Pd is the mean arterial pressure distal to the stenosis, and Pa is the mean aortic pressure at the tip of the guiding catheter during stable, steady state hyperemia.
FFRmyo was calculated offline as follows:
FFRmyo= Pd−Pra
Pa−Pra
where Pra is the mean right atrial pressure.
5/2.4 Statistical Analysis
All analyses were performed with Prism GraphPad 5.0 (GraphPad Software Inc., California, US). Summary descriptive statistics are reported as mean ± standard deviation, median (inter quartile range) or counts (%), as appropriate. Normal distribution was tested with the D’Agostino-Pearson omnibus k2 test. Unpaired t-test or Mann-Whitney test were used to compare two independent groups, as appropriate. To compare multiple groups one-way ANOVA or Kruskal-Wallis test were used, as appropriate. Correlation between variables was determined by Pearson- or Spearman correlation tests, as appropriate. Sensitivity, specificity, diagnostic accuracy, and optimal diagnostic cut-off value were defined from the calculated receiver operator characteristic curves, as appropriate. A probability value of p < 0.05 was considered statistically significant.
5/3 – Methods for Dose-response study 5/3.1 Study population
Patients with stable CAD undergoing routine diagnostic coronary angiography for a variety of indications were approached for participation between April and November of 2014. All patients had documented coronary atherosclerosis, but the measurements
were performed in vessels free of any stenosis with more than 20% diameter reduction.
Each subject provided written informed consent as approved by the institutional ethics committee.
5/3.2 Intracoronary Doppler velocity measurement
Following standard diagnostic coronary angiography, 200 µg of intracoronary nitroglycerin was administered to minimize epicardial vasomotor tone. Then a 0.014”
Doppler wire (FloWire, Volcano Corporation, San Diego, California, USA) was introduced via a 6 Fr guiding catheter into the target coronary artery and positioned under fluoroscopy to obtain an optimal and stable flow velocity signal. In all patients, the guide wire was manipulated to place the Doppler sensor facing the oncoming coronary flow.
First, resting Doppler velocity was measured and recorded for at least 1 minute to ensure a steady-state baseline. Next, Doppler velocity was measured and recorded for at least 1 minute after an 8mL intracoronary bolus administration of arterial blood, saline at room temperature, contrast medium (iodixanol 270 mg/mL), 9 escalating doses of adenosine (4, 12, 20, 60, 100, 160, 200, 300, and 500 µg), and finally a mixture of 200 µg of adenosine plus contrast medium. For the sake of this protocol, the adenosine solution prepared by the pharmacy contained 100 µg/mL and the dilutions were adjusted to reach 8 mL for all injections. In order to obtain optimal flow velocity tracings, we elected not to flush the 0, 60, 100, 160, 200, 300, and 500 e after an 8mL r guiding catheter into the target coronary artery and ximately 1.5 to 2 seconds). At the end of the measurements performed after administration of contrast material the remaining contrast was removed from the catheter prior to the next injection.
After each intracoronary administration, no further injection was performed for 2 minutes to allow the Doppler velocity to return to its baseline value. Hemodynamic parameters of heart rate and mean aortic pressure were recorded for each Doppler velocity measurement. AV-block was defined as at least one P wave, not followed by QRS. In case of AV-block, heart rate was defined in the post-block phase. Figure 8 depicts a typical Doppler velocity tracing and indicates the indices measured for each intracoronary bolus. We defined the plateau hyperemic period as the time during which
flow velocity reached at least 95% of its maximum. The time needed to come back to baseline was defined by the return to less than 10% above the starting value.
Figure 8 – Example of a typical Doppler velocity tracing. The figure illustrates, how the various measurements have been performed in the present study. First, resting Doppler velocity was measured and recorded for at least 1 minute to ensure a steady-state baseline. Next, the predefined medium was injected heart rhythm and hemodynamic parameters of heart rate and mean aortic pressure were recorded for each Doppler velocity measurement. In order to obtain optimal flow velocity tracings, we elected not to flush the ‘dead space’. This allowed to minimizing the duration of interruption of the aortic pressure signal (approximately 1.5 to 2 seconds). After each intracoronary administration, no further injection was performed for 2 minutes to allow the Doppler velocity to return to its baseline value.
5/3.3 Model for FFR dependence on adenosine dose
The following simulation was applied to investigate, whether the potential deviations of measured maximal flow (Qmax) from true maximal flow can have any clinically relevant impact on the measured FFR value. Mathematical background of the simulation is described below.
To translate the intracoronary adenosine dose into its effect on FFR, a model based on standard coronary physiology linked the degree of hyperemia to the relative distal
Adenosine(IC(200(µg((
(((
(Maximal(hyperemia(
Time(to(return(to(baseline((