Non-invasive Characterization of Coronary Artery Atherosclerotic Plaques
Doctoral Dissertation
Mihály Károlyi
Doctoral School of Basic Medical Sciences Semmelweis University
Supervisors: Dr. Pál Maurovich-Horvat Ph.D.
Dr. Béla Merkely D.Sc.
Official reviewers: Dr. Lívia Jánoskúti Ph.D.
Dr. Attila Thury Ph.D.
Head of the Final Examination Committee:
Dr. Viktor Bérczi D.Sc.
Members of the Final Examination Committee:
Dr. Attila Doros Ph.D.
Dr. László Sallai Ph.D.
Budapest, 2015
Table of Contents
Abbreviations ... 4
1. Introduction ... 5
1.1 Natural history of atherosclerosis and concept of the vulnerable plaque ... 6
1.2 Imaging of coronary atherosclerotic plaque with CT ... 11
1.3 Imaging of coronary atherosclerotic plaque with MRI ... 12
2 Objectives ... 14
2.1 Histopathological correlates of the napkin-ring sign in CT ... 14
2.2 Plaque visualization with advanced image reconstruction ... 14
2.3 Effect of image reconstruction on automated plaque assessment ... 14
2.4 Characterization of coronary atherosclerotic plaque with MRI ... 14
3 Methods ... 15
3.1 Ex vivo hearts ... 15
3.2 Specimen preparation ... 16
3.3 CT Protocol ... 16
3.4 CT image reconstruction ... 17
3.5 MRI Protocol ... 18
3.6 Histopathology ... 20
3.7 Co-registration of the images (CT, MRI, histology) ... 21
3.8 CT analysis ... 22
3.8.1 Features associated with the napkin-ring sign ... 22
3.8.2 Image quality of different reconstruction techniques ... 22
3.8.2.1 Qualitative image analysis ... 23
3.8.2.2 Quantitative image analysis ... 23
3.8.3 Automated plaque assessment ... 24
3.9 MRI image analysis ... 25
3.10 Statistical analysis ... 28
3.10.1 Napkin-ring sign ... 28
3.10.2 Image quality ... 29
3.10.3 Automated plaque assessment ... 29
3.10.4 MRI ... 30
4 Results ... 31
4.1 Histopathological correlates of the napkin-ring sign plaque in CT ... 31
4.1.1 Histological characteristics of the napkin-ring sign ... 31
4.1.2 Histologic features corresponding to the napkin-ring sign ... 33
4.1.3 Other features associated with the napkin-ring sign ... 35
4.1.4 Interobserver-agreement ... 36
4.2 Impact of CT image reconstruction on coronary plaque visualization ... 37
4.2.1 Qualitative image analysis ... 37
4.2.2 Quantitative image analysis ... 42
4.3 Automated plaque assessment with coronary CTA and image reconstruction .... 44
4.3.1 Feasibility of automatic vessel-wall delineation for plaque assessment ... 46
4.3.2 Impact of iterative reconstruction on automated vessel-wall delineation ... 46
4.3.3 Regional agreement of vessel-wall boundary correction ... 49
4.3.4 Benefit of MBIR for automated vessel-wall delineation ... 51
4.3.5 Estimated time saving for automated plaque assessment ... 52
4.4 Characterization and classification of atherosclerotic plaque with MRI ... 53
5 Discussion ... 60
5.1 Coronary plaque visualization with CT angiography ... 60
5.1.1 Histopathological correlates of the napkin-ring sign ... 60
5.1.2 Coronary plaque visualization with FBPR, ASIR, and MBIR technique ... 63
5.1.3 Effect of image reconstruction technique on automated plaque detection .... 64
5.2 Coronary plaque assesment with MRI ... 66
5.3 Strenghts and limitations ... 69
6 Conclusions ... 72
7 Summary ... 73
8 Összefoglalás ... 74
9 References ... 75
10 Publications ... 91
10.1 Publications closely related to the present thesis ... 91
10.2 Publications not related to the present thesis ... 91
11 Acknowledgements ... 93
Appendix (Paper 1-4) ... 94
Abbreviations
3D 3 Dimensional
ACS Acute Coronary Syndrome
AHA American Heart Association
ASIR Adaptive Statistical Iterative Reconstruction
CA Lipid-Rich Necrotic Core Area
CABG Coronary Artery Bypass Grafting
CAD Coronary Artery Disease
CI Confidence Interval
CNR Contrast-to-Noise Ratio
CT Computed Tomography
CTA Computed Tomography Angiography
FBPR Filtered Backprojection Reconstruction
FOV Field of View
HU Hounsfield Unit
ICC Intraclass Correlation Coefficient
IIAM International Institute for the Advancement of Medicine
IQ Image Quality
IVUS Intravascular Ultrasound
kV Kilovolt
LA Luminal Area
LAD Left Anterior Descending Coronary Artery
LCX Left Circumflex Coronary Artery
LRNC Lipid-Rich Necrotic Core
mAs Milliampere-second
MBIR Model-Based Iterative Reconstruction
mmHg Millimeter of Mercury
MRI Magnetic Resonance Imaging
NcA Non-core Plaque Area
NRS Napkin-Ring Sign
OCT Optical Coherence Tomography
PB Plaque Burden
PCI Percutaneous Coronary Intervention
RCA Right Coronary Artery
RF Radiofrequency
ROI Regions of Interest
T Tesla
TCFA Thin-Cap Fibroatheroma
TE Time of Echo
TPA Total Plaque Area
TR Time of Repetition
UTE Ultra-Short Echo Time
VA Vessel Area
1. Introduction
Coronary atherosclerosis related cardiac events remain the leading cause of morbidity and mortality worldwide (1). Most acute coronary events can be linked to the rupture of a coronary atherosclerotic plaque, resulting in the formation of a luminal thrombus and possible occlusion of the vessel (2). Similar atherosclerotic lesions are also present in individuals who did not experience acute cardiovascular event (3). Autopsy studies have revealed features specific to plaques vulnerable to rupture such as increased plaque dimensions, a large lipid-rich necrotic core and a thin fibrotic cap separating the necrotic core from the vessel lumen (4-6). To date invasive techniques such as intravascular ultrasound (IVUS) and optical coherence tomography (OCT) are the clinical gold standards to study plaque morphology associated with acute coronary events (7,8). IVUS permits not only invasive imaging of the entire arterial wall with high spatial and temporal resolution, discriminating plaque components, but both accurate and highly reproducible detection and cross-sectional quantification of coronary atherosclerotic plaque burden (9,10). OCT is an optical analogue of IVUS allowing for high-resolution tomographic intra-arterial visualization of the coronaries and it has also been validated for characterizing various plaque components as compared to histology (11). However, these techniques are not appropriate for large- scale screening or serial follow-up studies. Thus, significant interest exists in the development of non-invasive imaging techniques to characterize atherosclerotic lesions, assess their risk for rupture and further complications. Furthermore, over-time change in atherosclerotic plaque burden represents a potential surrogate endpoint indicating the efficacy of novel anti-atherosclerotic drugs, underlining the potential of non-invasive techniques in follow-up of patient treatment (9).
1.1 Natural history of atherosclerosis and concept of the vulnerable plaque
Atherosclerosis is as a chronic inflammatory disease that incubates over decades and affects the global arterial vasculature. Complex interactions between cellular factors and molecular messengers both in the vessel wall and blood are required for its evolution.
Vascular injury and endothelial dysfunction are considered as the triggers for atherosclerotic inflammatory cell activation. Their appearance promotes the infiltration, accumulation and modification of lipoproteins in the vessel wall. The various combinations of these lipoproteins with extracellular matrix components (collagen, proteoglycans), smooth muscle cells, inflammatory cells (macrophages, T lymphocytes), calcium and new blood vessels (angiogenesis) results in the buildup of an atherosclerotic plaque (12).
The conversion of chronic atherosclerotic lesions to complicated thrombotic plaques happens often suddenly without any prior warning symptoms of the patient. Therefore the mechanisms leading to such complications have been studied extensively in the past years. Early investigations hypothesized, that ST-segment elevation acute coronary syndrome (ACS) results from a progressive, high-grade luminal narrowing of the coronary artery, which is complicated by a small platelet thrombi occluding the vessel completely and arresting myocardial blood supply. Accordingly, myocardial infarction with no ST-segment elevation would result from a transient or incomplete occlusion of a critical lesion in the culprit coronary artery. Current diagnostic approaches of atherosclerotic lesions are generally based on these concepts. Invasive catheterization visualizes the arterial luminal narrowing directly, while other diagnostic techniques (e.g., stress tests, perfusion imaging) evaluate ischemia related to fixed stenotic lesions.
Treatment strategies as percutaneous coronary intervention (PCI) and coronary artery bypass grafting (CABG) also target these stenotic lesions (12).
Recent clinical and pathological observations have challenged these commonly ingrown notions (12-15). According to serial angiographic studies, plaques at the site of the culprit lesion deemed responsible for future myocardial infarction usually do not cause flow-limiting stenosis. The Prospective Natural-History Study of Coronary
Atherosclerosis (PROSPECT) investigated and followed-up for 3 years near 700 patients who underwent three-vessel coronary angiography and IVUS imaging after percutaneous coronary intervention due to ACS. Surprisingly, only about 50% of subsequent events arose from stenotic plaques that might have warranted interventionists at the time of PCI (16). Also, angiographic control after thrombolytic therapy of the occluding thrombus often reveals a non-stenotic underlying lesion in the artery. Recent studies with computed tomography imaging, which allows the visualization of the arterial wall beyond luminal narrowing, have particularly evaluated the characteristics of such lesions. Outward expansion of the arterial wall (positive remodeling) and plaque with little of no calcification has been associated with ACS (17,18). These lesions also lie usually proximal to the location of the maximal luminal stenosis, which is the target of conventional revascularization therapies (19).
These observations explain the fact that myocardial infarction or sudden cardiac death is often the first sign of coronary atherosclerosis, while culprit lesions stay hidden and do not cause prior angina pectoris for the patient. In line with these observations the Clinical Utilizing Revascularization and Aggressive Drug Evaluation (COURAGE) trial found that medical therapy is equally preventive for future acute coronary events as invasive revascularization procedures (20). This assembly of clinical findings turned researchers attention to the early identification of silent lesions at increased risk of acute coronary events and proposed the concept of the vulnerable (21).
The term vulnerable or high-risk plaque is generally accepted for lesions at increased risk of thrombosis (or recurrent thrombosis) and rapid stenosis progression (22).
Autopsy studies were extensively performed to reveal the specific characteristics of such lesions (5,13,15). Their findings underscored the clinical observation, that luminal narrowing occurs relatively late in the atherogenesis process, when plaque evolution outstrips the capability of the artery for compensatory expansion (23). This results in a substantial burden of atheromatosus plaque outward the lumen preventing stenosis and obscuring the clinical signs of ischemia for the patient (12).
Different forms of atherosclerotic lesions are presented in Figure 1. Histopathological features of an advance atherosclerotic plaque (thin-cap fibroatheroma) are shown in Figure 2, while Figure 3 summarizes the stages of plaque evolution.
Figure 1 – Different presentations of coronary atherosclerosis.
Cross-sectional images of plaques at the proximal left anterior descending artery.
Upper image represents a positively remodelled excentric fibroatheroma with thrombus formation provoken by the fibrous cap rupture. Middle image shows the healed plaque rupture resulting in a more fibrous lesion. Strata represents the buried fibrous cap from prior disruption. Progressive fibrosis and calcification may be present. These lesions narrow the lumen and may cause stable ischemic symptomes to the patient.
Bottom image represents a proteoglycan rich plaque eroded at the intimal surface, causing occlusive thrombus (12). Typically three types of atherosclerotic plaque morphologies are associated with acute coronary syndromes: plaque rupture, plaque erosion and calcified nodule (12,13). The rupture of a thin, inflamed cap covering a lipid-rich, necrotic center of a plaque, termed as “thin-cap fibroatheromas” (TCFA) is responsible for the majority of fatal coronary events. The fibrous cap separates the
thrombogenic material enriched in the lipid core and the latent coagulant factors of the blood compartment (12). Fibrous cap thickness under 50-65 µm was identified as the cut-off indicating plaques causing fatal ruptures (13,24,25).
Figure 2 – Histopathological images of a thin-cap fibroatheroma.
The intact fibroatheroma plaque was reveled in a 61-year-old male, who died suddenly in ischemic stroke and had a history of coronary artery disease. The plaque was located in the proximal left anterior descending coronary artery and resulted in 50% cross- sectional luminal narrowing. Note the large necrotic core (*) seperated with a thin fibrous cap (red arrow) from the vessel lumen (L). The core is surrounded with prominent fibrotic tissue (closed arrows) and a sheet calcification (open arrows).
Additional machrophage infiltration (blue arrow) is present within the plaque (unpublished data).
Thrombosis-prone plaques are also generally larger, have significant size of lipid-rich necrotic cores and show punctuate or spotty calcification (18,26). Abundant inflammatory cell accumulation was also discovered as characteristic for high-risk lesions. Macrophages and their mediators (matrix-metalloproteinase enzymes) are hold responsible for the disruption of collagen, which stabilizes the fibrous cap and prevents plaque rupture (12,27,28). The superficial erosion of atheromatosus plaques triggers 20-25% of fatal acute coronary syndromes (13). Endothelial cell desquamation due to programmed cell death, oxidative stress and hypochlorous acid initiated apoptosis associated with inflammatory cells could contribute to plaque erosion (29,30). Intimal erosion of a calcified nodule protruding into the lumen and intraplaque hemorrhage may be responsible for only a small proportion of acute coronary syndromes (13).
Importantly, compelling evidence suggest that plaque rupture and thrombus formation are frequent events that are instrumental in plaque evolution and luminal stenosis
*
* L
L
development (13,31). Thus, a ruptured atherosclerotic plaque and a formatted thrombus typically do not cause coronary events (13,21). Numerous healed plaque ruptures are essential for the development of a high-grade luminal stenosis of the coronaries.
Autopsy studies revealed plaque rupture up to 8-11% in the coronary arteries of patients who died of noncardiac causes and had no history of ischemic heart disease (13,32,33).
While plaque ruptures were found up to 16-31% in patients who died of noncardiac causes, but had relevant cardiovascular risk factors (13,31,34). All of the above thoughts strongly suggest that an acute coronary event results as the combination of various factors. Conjunction of certain atherosclerotic plaque characteristics, flow dynamics deviation, intrinsic fibrinolytic and hemostatic dysfunction, neurohormonal dysregulation and external triggers are essential for the initiation of an acute coronary syndrome (13). Additional serial imaging data might contribute to a better understanding of important morphological plaque changes over time.
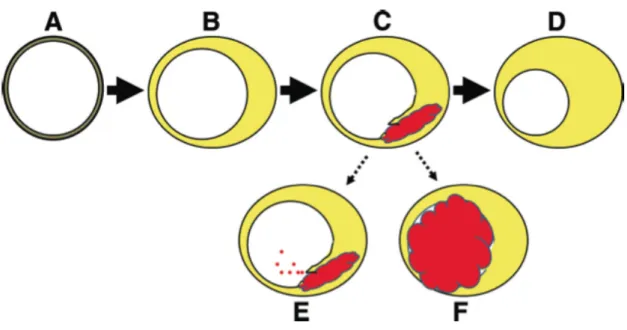
Figure 3 – Evolution of atherosclerotic plaque.
A: normal coronary wall. B: atherosclerotic plaque accumulation with external vascular remodeling and minimal luminal narrowing. C: Plaque rupture with hemorrhage resulting in intramural thrombus. D: Healing of rupture resulting in plaque growth (in the vast majority of the cases). E: Distal embolization of thrombus material (it may cause symptoms or asymptomatic microinfarctions). F: Plaque rupture in coincidence with a thrombosis-conductive state resulting in thrombosis and occlusion of the artery (it may trigger an acute coronary syndrome) (13).
1.2 Imaging of coronary atherosclerotic plaque with CT
Owing to simultaneous data acquisition in numerous parallel slices with sub-second gantry rotation time and data reconstruction with ECG-correlated partial algorithms, coronary computed tomography angiography (CTA) allows for detailed visualization of the moving heart and coronary arteries (35). Thus, it has emerged in the past decade as a powerful tool to detect coronary artery stenosis with excellent sensitivity and good specificity when compared to invasive angiography (17,36,37). Moreover coronary CTA does not only provide data about the luminal narrowing of the coronary artery tree, but also allows the vessel wall to be imaged with high spatial resolution, accordingly permits the characterization of coronary atherosclerotic plaques (38). Current clinical practice of coronary CTA differentiates simply calcified, non-calcified and partially calcified (mixed) atherosclerotic lesions. Although coronary CTA has been shown to be highly accurate in detection of calcified plaque, various studies have demonstrated limitations in visualization of non-calcified plaque (39,40). Yet, growing body of evidence suggests that based on the different computed tomography (CT) attenuation of coronary plaque components, non-calcified plaques can be further distinguished to fibrotic and lipid-rich lesions (17,41). Still, owing to a substantial overlap of the CT numbers of the various plaque types, a reliable differentiation of plaques is not possible with sufficient accuracy (42). Recently, several small studies suggested that a certain morphological pattern on CT, a hyperdense ring-like structure surrounding a hypodense center, described as “napkin-ring” sign (NRS), is associated with advanced coronary plaque as defined by the Amerocan Heart Association (AHA) classification (43-45).
Previous studies have shown that the napkin-ring sign in coronary CTA offers a high specificity and positive predictive value to detect lipid-rich plaques, yet the sensitivity of this sign to detect advanced plaque is rather low (43,46,47). This can be related to the various histological characteristics of advanced coronary atherosclerotic lesions resulting in nondescript delineation of the NRS in coronary CT angiography.
Limited detection and characterization of non-calcified coronary atherosclerotic plaques can be further linked to the difficulty to establish outer and inner plaque boundary due to the limited contrast resolution of the CT images, which may have been influenced by
quantum noise (38). Further problem related to image noise is the hampered applicability of automated tools for quantitative coronary CTA assessments, which software packages are available from all CT vendors and several software companies.
Automated algorithms have been shown to provide stenosis degree and plaque volume measurements at least as good as manual measurements when compared to gold standard invasive techniques as IVUS (42,48) and they may even reduce inter-/intra- reader variability for the non-calcified plaque quantification, especially for less experienced observers (49). However they are rarely used in clinical practice, as a large portion of automatically fitted boundaries must be manually corrected, which is time consuming and makes reading complicated (42).
Currently, most CT imaging studies have been reconstructed by using the filtered backprojection reconstruction (FBPR) technique. An adaptive statistical iterative reconstruction (ASIR) algorithm was developed to help reduce the quantum noise associated with standard convolution reconstruction algorithms (50,51). Most recently, an algorithm called model-based iterative reconstruction (MBIR) was introduced representing a latest advancement in the field of reconstruction techniques (52). ASIR is a hybrid method, which updates iterative reconstruction technique on FBPR, and MBIR is a raw data based 3-dimensional image reconstruction method, which increases point spread function and thus image resolution. In general, iterative reconstruction techniques have been found to yield lower noise than the FBPR technique (53). Thus, iterative reconstruction techniques may improve the visualization of coronary artery atherosclerotic plaques and have a significant benefit above standard image reconstruction when using automated tools to assess quantitative plaque parameters.
1.3 Imaging of coronary atherosclerotic plaque with MRI
The experience with magnetic resonance imaging (MRI) characterization of carotid artery plaque is now extensive (54). Owing to its excellent soft tissue contrast, MRI is able to differentiate atherosclerotic plaque components, thus detect carotid lipid content, hemorrhage, neovascularization and fibrous cap thickness (55-59). Recently, ultra-short echo time (UTE) MRI has been used to detect and quantify plaque calcification in
carotids (60,61). MRI characterization of coronary plaque, however, is in its nascency.
Unlike MRI of the carotids, MRI of the coronary wall currently lacks the spatial resolution needed for the detailed characterization of plaque morphology. High-field MRI systems have been introduced to overcome these difficulties and potentiate high- resolution imaging in human use, however only limited number (approx. 40) of these devices are available worldwide, mostly used for research purposes (62). The challenges with high-field MRI imaging of cardiac structures are magnetic inhomogeneity and specific absorption rate constraints with commercial available high-field at 7T (62).
MRI systems are not regularly equipped with required body radiofrequency (RF) transmit coils or surface RF receive coils (62). However, several groups have shown the feasibility of human cardiac imaging with 7T-units, moreover successful imaging of the coronary arteries in vivo (62-67). Although these achievements are promising for further clinical use of coronary MRI in the future, the ability of high-resolution MRI to accurately characterize human coronary atherosclerotic plaque remains poorly defined.
Only one study to date has examined the correlation between human coronary artery plaque by MRI and histology (68) and this study was hindered by the absence of a sequence to specifically detect plaque calcification.
2 Objectives
2.1 Histopathological correlates of the napkin-ring sign in CT
Our purpose was to identify histological characteristics of advanced coronary atherosclerotic plaques that promote or interfere with the delineation of the napkin-ring sign in coronary CT angiography.
2.2 Plaque visualization with advanced image reconstruction
We aimed to compare the qualitative and quantitative image quality (IQ) parameters of coronary CTA images regarding atherosclerotic plaque visualization in human coronaries with images reconstructed with standard filtered backprojection reconstruction (FBPR), adaptive statistical iterative reconstruction (ASIR) and model- based iterative reconstruction (MBIR) techniques.
2.3 Effect of image reconstruction on automated plaque assessment We aimed to determine the effect of iterative reconstruction algorithms in comparison to FBPR regarding the need for manual corrections of the automatically fitted vessel- wall boundaries. A reduction of the number of necessary boundary corrections would translate directly into an improved feasibility and potentially into a wider clinical applicability of automated tools for plaque assessment in coronary CTA.
2.4 Characterization of coronary atherosclerotic plaque with MRI We sought to use high-resolution MRI with T1, T2, and UTE sequences to visualize human coronary atherosclerotic plaques. Furthermore, we aimed to characterize coronary plaques to distinguish potentially vulnerable lipid-rich plaques from more stable fibrocalcific plaques with a high degree of accuracy. In addition, our goal was to assess the capability of MRI to classify human coronary atherosclerotic lesions with T1, T2, and UTE technique as compared to the histopathological plaque classification.
3 Methods
An ex vivo experimental setup has been established for the imaging of human coronary atherosclerotic plaques (69). Multimodal imaging techniques (CT and MRI) were used to assess atherosclerotic plaque parameters and compared to co-registered histological data. All procedures were performed in accordance with the local and federal regulations and the Declaration of Helsinki. Approval of the local Ethics Committee was obtained.
3.1 Ex vivo hearts
The human donor hearts were retrieved through the International Institute for the Advancement of Medicine (IIAM). IIAM is a non-profit oriented organization, which facilitates the recovery and placement of donated non-transplantable human organs and tissues with researchers. The donor hearts went through transplantation evaluation, however, the organs deemed unusable or unable to be transplanted mainly due to significant coronary artery disease (CAD).
The donor inclusion criteria according to our protocol were male gender, age between 40 and 70 years, and proven CAD. To minimize the prevalence of coronary segments with chronic total occlusion and severe calcification, donors with long standing diabetes mellitus and/or chronic renal failure were excluded from the study. The maximum warm ischemia time was 6 hours and the maximum cold ischemia time was 15 hours. The fresh donor hearts were transported to our institution in histidine tryptophan- ketoglutarate or University of Wisconsin solution and packed in wet ice. Seven isolated donor hearts (mean age: 53 years, range: 42 – 61 years) were acquired and investigated.
The cause of death was stroke in six cases and in one case the cause of death was non- natural (suicide). CAD was proven in all donor hearts either with catheter coronary angiography or based on the donor’s medical history.
3.2 Specimen preparation
As a first step, the ascending aorta was removed in order to provide access to the coronary artery ostia. The right and the left coronary arteries were selectively cannulated with plastic luers. The luers were secured in the coronary arteries by ligating the ostial parts from the outer surface of the coronary. After implanting the luers in the coronary arteries, a balloon was placed in the left ventricle and inflated with saline to regain the physiological shape of the ventricle. The following steps were performed on the heart submerged in saline bath. The coronaries were flushed with saline to remove superficial thrombus and air bubbles. As the next step plastic tubes filled with methylcellulose based iodinated contrast agent were attached under water to the luers.
The loose ends of the plastic tubes were sealed with a T-port valve. The heart was positioned in the center of a Styrofoam box filled with canola oil to simulate the epicardial adipose tissue compartment. For the MRI analysis formalin pre-fixation was implemented on the specimens. The ostium of the left anterior descending coronary artery (LAD) was selectively cannulated with a catheter with a plastic luer connector, which was connected to a pressure-perfusion system. Buffered neutral formalin solution (10%) was infused at 130 mmHg for 30 min for tissue fixation. A block of myocardium – including the LAD and its proximal side branches – was then excised from the heart for MRI.
3.3 CT Protocol
Methylcellulose based contrast agent (approximately 5-10 ml) was injected in the coronary arteries. To achieve an intra-luminal contrast enhancement similar to in vivo CT angiography of the coronary arteries methylcellulose (Methocel, DOW Chemical Company, Midland, MI, USA) with 3% iopamidol contrast agent (Isovue 370, Bracco Diagnostics, Milan, Italy) was used. Typically, with this procedure attenuation within the vessel lumen was achieved similar to in vivo studies. CT data acquisitions were performed with a 64-detector row CT scanner (High-Definition, GE Discovery, CT
750HD, Milwaukee, WI, USA) using the following parameters: 64 mm×0.625 mm collimation; 0.35 s rotation time; tube voltage of 120 kV; tube current of 500 mAs.
3.4 CT image reconstruction
The raw data were reconstructed by FBPR, an adaptive statistical iterative reconstruction (ASIR), and a model-based iterative reconstruction (MBIR) algorithm.
FBPR represents the image reconstruction algorithm, which has been used widely during the last years. This method is a discrete implementation of inverse solution of continuous Radon problem so that it can use pre-calculated mathematical solution for an implementation with multiple steps of discretization and approximation (70). As a result, FBPR is easy to implement and fast. However it is still an approximated solution.
In contrast, iterative reconstruction techniques represent an approach where based on true system model (optics or/and geometry) the error between measurements and reconstructed image is minimized (71). In comparison to FBPR, iterative reconstruction algorithms are able to simulate the true X-ray path, in which X-ray photons originate from their location at a focal spot to the detector through the scanned object. The residual error between this forward projection and the scanner-acquired raw projection data is backprojected to update the image, which renders the reconstructed image as the optimum image for the given raw data and system model. Furthermore, iterative reconstruction techniques are able to incorporate noise statistical information of raw projection data and measured electric noise to achieve de-noised images in the final solution with regularization term (71).
Overall, iterative reconstruction algorithms can be classified regarding their extent of implementing information from FBPR. While there are several hybrid iterative algorithms, which include some extent data from FBPR such as ASIR, full iterative reconstruction algorithms, such as MBIR are not yet available in daily clinical practice.
Specifically, ASIR predominantly focuses on the modeling of the statistical behavior of incident photons and electric noise (so called statistical modeling) and is limited to a number of iterations. It compares image data to a noise model to improve image quality
(72). A blending factor of 40% was chosen for ASIR based on the recommendation from the vendor. Image reconstruction was performed at the workstations of our department’s console.
MBIR is a full model-based iterative reconstruction algorithm that implements data from modeling the actual detector response function, the focal spot size, and the system geometry (so called system optics modeling) along with statistical behavior of incident photons and electric noise (so called statistical modeling) (52,72,73). This algorithm is more computer-intensive due to multiple iterations from raw data based image reconstruction and so far not available for coronary CTA. Therefore, an ex vivo setting was chosen and a prototype version of this algorithm was applied at the research department of the vendor (GE Healthcare, Milwaukee, WI, USA).
All images were reconstructed at 0.625 mm slice thickness, 0.4 mm slice increment, and full field of view with FBPR, ASIR, and MBIR techniques by using soft-tissue kernel.
All reconstructed CT images were sent to an offline workstation for further analysis.
3.5 MRI Protocol
Magnetic resonance images were acquired on a 9.4T horizontal bore magnetic resonance scanner (Biospec, Bruker, Billerica, MA, USA) using transmit-receive birdcage coil. The specimens were immersed in a fluorocarbon-matching medium with the same magnetic susceptibility as tissue but no proton MRI signal, thus providing a signal and artifact free background (Fomblin, Ausimont, NJ, USA). Specimens were imaged with T1, T2 and UTE sequences. T1-weighted imaging was achieved with a 3 dimensional (3D) gradient echo sequence using the following parameters: field of view (FOV) 48x36x64mm3, image matrix 192x144x256 (0.250mm isotropic resolution), TR
= 30ms, TE = 2.5ms, flip angle 45 degrees, fat suppression, 1 average. T2-weighted imaging was performed using a 2 dimensional (2D) fast spin echo sequence with the following parameters: FOV 40x30mm2, image matrix 256x192 (in plane resolution 0.156 mm), slice thickness 0.4 mm, TR = 3000 ms, TE = 40 ms, echo train 16, 16 averages. UTE imaging was performed using a 3D radial sequence with the following parameters: FOV 51x26x60 mm3, image matrix 192x192x192
(resolution 0.267x0.133x0.312 mm3) projections 75546, TR = 8 ms, TE = 20 µs, fat suppression, 1 average.
3.6 Histopathology
The histological processing and analysis was performed at a pathology institute specialized in cardiovascular histopathology (CV Path Laboratory, Maryland, MD, USA). The coronary specimens were embedded en bloc in paraffin. Cross-sections were acquired in 1-mm increments (6µm slice thickness) and Movat’s pentachrome staining was used according to the standard techniques (74). Images were digitalized using a high-resolution camera attached to a microscope connected to a PC workstation and converted into high-resolution TIFF images. An experienced pathologist blinded to the CT and MRI data analyzed the histological sections. Main plaque components such as lipid-rich necrotic core and calcification were reported. Further classification of the coronary plaques was performed according to the histological criteria established by the AHA (4). Each cross-section was classified according to the AHA classification and early and advanced lesions were distinguished.
For the assessment of the napkin-ring sign, all plaques that were previously classified as advanced were further analyzed regarding the presence or absence of a lipid-rich necrotic core (LRNC), intraplaque hemorrhage, intraplaque microvessels, macrophage infiltration and calcifications. The latter characteristics were stratified as being related or unrelated to the lipid/necrotic core. Calcifications were subdivided into micro- calcifications (punctate calcification of smooth muscle cells, macrophages, or extracellular matrix, maximum diameter <50 µm), spotty (coalescent calcification, maximum diameter 50-1000 µm) and sheet calcifications (plate calcification, maximum diameter >1000 µm) (75). All cuts that were subsequently digitalized were further analyzed using dedicated software and manual contouring (ImageJ 1.44o, National Institutes of Health, Bethesda, MD, USA).
Vessel area (VA) was defined as the area inside the external elastic lamina.
Furthermore, the lumen area (LA) and the area of the lipid/necrotic core (CA) were measured. From this data, the total plaque area (TPA) was calculated as TPA = VA – LA. The area of non-core plaque was calculated as NcA = TPA – CA. The plaque burden (PB) was calculated using the following formula: PB = (TPA / VA) * 100. We also assessed the thickness of the fibrous cap, which was measured at its thinnest part.
Histologic features representing the atherosclerotic plaque such as size and area of the necrotic core and area of non-core plaque as well as the presence of calcification, hemorrhage and macrophages are further referred to as histologic plaque features.
Variables associated with the plaque such as the vessel area, the lumen area, plaque burden and distance of the plaque from the ostium are further referred to as associated plaque features.
3.7 Co-registration of the images (CT, MRI, histology)
All images were co-registered using a freeware Dicom reader (OsiriX, version 3.6.1, Geneva, Switzerland) by an experienced investigator, who was not participating in further image analysis.
A multiplanar reconstruction technique was used to generate CT images perpendicular to the vessel centerline to match the position of the histological cuts prepared in 1-mm increments. The cross-sectional and rotational position of the slices were identified by distance measurements from the distal end of the plastic cannulas and verified by using fiducial markers such as side branches, bifurcations and features of vessel wall morphology (e.g.: plaque shape, calcification pattern, orientations of the myocardium and the pericardial adipose tissue layer).
The cross-sectional images were co-registered between FBPR, ASIR, and MBIR similarly by using the distance from the plastic luer as a fixed starting point.
Furthermore, plaque burden profiles were generated for each vessel and compared between the different reconstruction algorithms to guarantee perfect alignment of each coronary cross-section in the co-registered dataset.
Manual co-registration of the T1, T2, and UTE MRI data with the CT images and histological slides was performed by using multi-planar reformats of the MRI images perpendicular to the vessel centerline prepared in 1-mm increments to match to the histological slides. Anatomical features such as distance from the coronary ostia, presence of side-branches or vessel bifurcation, vessel size and shape, and plaque morphology were used to warrant the rigid co-registration.
3.8 CT analysis
3.8.1 Features associated with the napkin-ring sign
As the most advanced, model-based image reconstruction technique is available mostly in the research phase, the dataset used for plaque feature assessment was reconstructed using ASIR technique. The purpose of this sub-study was to define features of advanced atherosclerotic plaques that promote or interfere with the delineation of the NRS in coronary CT angiography, thus, only cross-sections containing advanced plaques as classified by histology were used. The corresponding CT images were reviewed in consensus by two radiologists with 6 and 10 years of experience in coronary CT angiography. All reading was performed using a fixed window setting [700 Hounsfield Units (HU) width, 200 HU level]. Based on the CT appearance, it was specified whether a napkin-ring sign could be identified within the plaque. The NRS was defined by a low-attenuation plaque core surrounded by a circumferential area of higher attenuation (45). Additionally, we measured the attenuation of the non-calcified plaque portion of all plaques using an in-house program developed in Matlab. For this purpose, the outer circumference of the vessel and the lumen were manually traced and the median density of the pixels within the plaque was calculated. In plaques with a positive NRS, we also measured the median density of the central hypodense area and the peripheral hyperdense ring.
3.8.2 Image quality of different reconstruction techniques
Image analysis was performed at a commercially available workstation (Advantage Windows 4.2; GE Healthcare, Milwaukee, WI, USA) by two experienced observer blinded to the image review results. The three image sets, obtained with reconstruction techniques FBPR, ASIR, and MBIR in each patient, were displayed side by side with a preset soft tissue window (window width, 200 HU; window level, 700 HU).
3.8.2.1 Qualitative image analysis
The two reviewers were asked to grade the overall image quality on a four-point scale:
1 = excellent; 2 = good (minor artifacts); 3 = moderate (considerable artifacts but diagnostic quality); 4 = poor, non-diagnostic. Regarding calcification and blooming artifacts, both readers were asked to rate if there is calcification or not. If present, a three-point scale was used to qualify blooming artifacts: 0 = no blooming; 1 = blooming but lumen clearly visualized; 2 = blooming, no lumen visible. Image noise was defined as overall graininess or mottle in the coronary artery. It was graded on a four-point scale: 1 = no image noise; 2 = average noise; 3 = above average noise; 4 = severe noise.
Image sharpness was evaluated on a five-point scale: 0 = extremely poor, no definable lumen; 1 = poor, severe streaking comprising more than 50% of the vessel lumen;
2 = fair, vessel walls may show mild streaking or blurring, but a defined lumen is identifiable; 3 = good, coronary walls may be blurred but lumen is clearly discernible and separate from the surrounding fat; 4 = excellent, coronary walls are sharp and well- defined with no blurring. Such an assessment scheme was used in a previous study of coronary lumen analysis at CT (76,77).
3.8.2.2 Quantitative image analysis
We obtained mean CT attenuation values (in Hounsfield units) for the peri-coronary fat and coronary artery by manually placing circular regions of interest (ROIs) at the same image level. The attenuation of the coronary artery was recorded from a single drawn ROI that was as large as the vessel lumen. For each protocol, image noise was measured as the standard deviation of the pixel values from a circular or ovoid ROI drawn in a homogeneous region of the peri-coronary fat. For all measurements, the size, shape, and position of the ROIs were kept constant among the three protocols by applying a copy and paste function at the workstation. The attenuation of the peri-coronary fat was recorded as the measurement of one ROI placed in the peri-coronary area to the coronary lumen. Areas of focal changes in parenchymal attenuation and prominent artifacts, if any, were carefully avoided. For each of the three reconstructions, the
contrast-to-noise ratio (CNR) relative to peri-coronary fat for the coronary artery was calculated by using the following equation: CNR = (HUlumen – HUfat) / SDlumen, where HUlumen and HUfat are the mean CT numbers of the coronary artery lumen and the peri- coronary adipose tissue, respectively. SDlumen represents the standard deviation of luminal CT number.
3.8.3 Automated plaque assessment
For each vessel reconstructed by three different algorithms (FBPR, ASIR, MBIR), a separated 3D dataset was generated. All images were anonymized regarding the applied reconstruction algorithm and vessel origin. All 3D datasets were transferred to a dedicated offline workstation (Vitrea Advanced Cardiac Solutions, Vital Images, Minnetonka, MN, USA), which allowed automated vessel segmentation and quantification of coronary artery components (49,78).
The starting point for the luminal centerline was manually set at the proximal ending of the vessel by a coronary CTA reader in the 3D dataset and visually verified. Afterwards, the software performed the automatic vessel segmentation and fitted the inner and outer vessel-wall boundaries. The automatically fitted boundaries were reviewed by an experienced coronary CTA reader on cross-sectional images with 0.5 mm increments. If the boundaries did not follow the anatomical structures, the inner and/or outer vessel- wall boundary was manually corrected. The proximal 40 mm of each vessel (left anterior descending [LAD], left circumflex [LCX], right coronary [RCA] artery) starting from the plastic luer was included in the assessment, plus the left main (LM) which was counted as part of the LAD. All measurements were exported for further processing.
The primary endpoint was the percentage of cross-sections where a manual correction of the automatically fitted vessel-wall boundaries (inner or outer) was necessary to perform. Secondary endpoints were the following: 1.) Percentage of cross-sections that required corrections of only the inner vessel-wall boundary; 2.) Percentage of cross- sections that required corrections of only the outer vessel-wall boundary; 3.) Benefit of MBIR over FBPR (or over ASIR), which was defined as cross-sections that needed any
corrections on FBPR (or ASIR) but not in MBIR, as compared to cross-sections, which showed no difference between MBIR and FBPR (or ASIR). The latter group contained cross-sections which have been or which have not been corrected in both image reconstruction algorithms (MBIR and FBPR; MBIR and ASIR).
The reproducibility of the primary endpoint was confirmed in a random subset (33% of the entire cohort). The vessel assessment including the boundary delineation was performed twice with a time gap of two weeks. A high correlation was observed with respect to the percentage of corrected cross-sections per vessel between the two assessments (intraclass correlation coefficient: 0.99). Also, an excellent regional agreement was achieved comparing which individual cross-sections were corrected the first and second time (kappa: 0.86).
3.9 MRI image analysis
Prior to data analysis a 5-point image quality Likert-type scale was used to assess the quality of the UTE images (57). UTE images with a clearly definable lumen, coronary wall and adventitial boundary, and with no artifacts were graded as 5; those with minor artifacts were rated as 4; grade 3 was assigned to images where the wall structures were easily identifiable, but the lumen and outer boundaries were partially obscured. Non- diagnostic images were assigned a grade 2 if only the arterial wall was distinct, and grade 1 if no structures were visible. Two independent, experienced cardiac imaging specialists rated the IQ.
Three independent observers blinded to the histological plaque classification performed plaque classification. In cases of disagreement a consensus was reached in a subsequent reading. The MRI signal and contrast characteristics used to identify the relevant plaque components are shown in Table 1. Areas of plaque showing signal hypointensity on the T1 but not on the UTE images were classified as calcified. Areas showing signal hypointensity on the T2 images were classified as lipid-rich necrotic core. Hemorrhage was identified by hyperintensity on the T1 and UTE images and regions that were isointense on all sequences were classified as fibrotic, Table 1. Signal intensities were interpreted with the adjacent myocardium as a reference.
Table 1 – Predicted signal intensities of plaque components by MRI.
Ca = calcification, Hypo = hypointense, Iso = isointense, Hyper = hyperintense
* Results in the local accumulation of the fluorocarbon matching medium
The used MRI classification system (Table 2) was based on the one that has been proposed by Cai et al. for carotids (79), but was adopted to include the assessment of plaque calcification using the UTE technique (60,61). Type I and II lesions were grouped together (I-II lesions) and defined by slight thickening of the arterial wall with near normal wall thickness. Type III plaque was defined by eccentric wall thickening.
Type IV and V lesions were grouped together, as per the Cai classification, but were further subclassified by UTE MRI as being either non-calcified IV-VA or calcified IV- VB. The presence of a surface defect and/or luminal thrombus (type VI plaque) is challenging to detect accurately ex vivo. Thus, we did not include a separate category for these plaques in our classification scheme. Type VII lesions (completely calcified plaque) were included in the analysis but where not encountered. Type VIII lesions were defined as per Cai et al as highly fibrotic, but could be further subclassified by UTE MRI as being either non-calcified VIIIA or calcified VIIIB.
Ca LRNC Fibrotic Hemorrhage Tissue Tear/
Disruption*
T1 Hypo Iso Iso Hyper Hypo
T2 Hypo Hypo Iso Hyper/Hypo Hypo
UTE Iso Iso Iso Hyper Hypo
Table 2 – Scheme for classification of atherosclerotic plaques with MRI (4,59).
AHA: American Heart Association Conventional AHA
classification (4)
Modified AHA classification for MRI (59)
Modified AHA classification for MRI adopted for UTE imaging Type I: initial lesion with
foam cells Type I-II: near normal
wall thickness, no calcification
Type I-II: near normal wall thickness, no calcification
Type II: fatty streak with multiple foam cell layers Type III: preatheroma with extracellular lipid pools
Type III: diffuse intimal thickening or small eccentric plaque with no calcification
Type III: diffuse intimal thickening or small eccentric plaque without calcification
Type IV: atheroma with a confluent extracellular lipid
core Type IV-V: plaque with a
lipid or necrotic core surrounded by fibrous tissue with possible calcification
Type IV-VA: plaque with lipid or necrotic core surrounded by fibrous tissue without calcium
Type V: fibroatheroma
Type IV-VB: plaque with lipid or necrotic core surrounded by fibrous tissue with calcium
Type VI: complex plaque with possible surface defect, hemorrhage or thrombus
Type VI: complex plaque with possible surface defect, hemorrhage or thrombus
Type VI: complex plaque with possible surface defect, hemorrhage or thrombus
Type VII: calcified plaque Type VII: calcified plaque Type VII: calcified plaque
Type VIII: fibrotic plaque without lipid core
Type VIII: fibrotic plaque without lipid core and with
possible small
calcifications
Type VIIIA: fibrotic plaque without lipid core and without calcification Type VIIIB: fibrotic plaque without lipid core and with calcification
3.10 Statistical analysis
Continuous variables are reported as mean (standard deviation) or median [interquartile range] and categorical by percentage (counts). Statistical analysis was performed using commercially available software (SAS, version 9.2 SAS Institute Inc., Cary, NC, USA).
A p-value of <0.05 was considered significant.
3.10.1 Napkin-ring sign
In univariate analysis, we tested which parameters derived from histology were significantly different between sections with and without NRS in CT. Wilcoxon signed- rank test and Fishers exact test were used to assess differences within continuous and categorical variables. All variables which showed a difference at a significance level of p<0.01 were included in multivariate analysis. We fitted two different logistic regression models, one for associated variables and one for histologic variables. Non- significant variables were removed stepwise from the initial models. The remaining significant variables from both models (associated and histologic) were combined in a final multivariate logistic regression model. We derived from these models the c- statistic, which is equal to the area under the curve. To estimate the probability of NRS appearance in dependency of the necrotic core size, we fitted a univariate logistic regression model where the necrotic size served as the predictor.
To assess the inter-observer variability of the measurements in the histology sections, the measurements were repeated by a second reader in a subset of 30 randomly chosen histology slices. The agreement between the two readers was evaluated using Pearson correlation coefficients and calculation of relative differences. A paired t-test was performed to assess whether the difference varied significantly from zero.
To determine inter-observer variability for the detection of the napkin-ring sign, an independent reader assessed a random subset of 100 co-registered coronary CTA images for the presence of the napkin-ring sign. The inter-observer agreement was evaluated using Cohen’s kappa statistics that was interpreted as follows: A κ value
greater than 0.80 corresponded to an excellent agreement, a κ value of 0.61-0.80 good inter-observer agreement, and a κ value of 0.41-0.60 moderate agreement (80).
3.10.2 Image quality
The observer-agreements regarding qualitative parameters (i.e. presence of calcifications, image quality, image noise score, sharpness) between readers and readouts were analyzed by using weighted kappa. The Mantel-Haenszel Chi2-test was used to compare categorical parameters between the reconstruction techniques and between images with and without calcifications.
The inter- and intra-reader agreement between quantitative parameters (i.e. luminal CT number, image noise, CNR) was assessed using Pearson’s correlation coefficient.
Comparisons of quantitative parameters between reconstruction techniques was carried out using ANalysis Of VAriances, t-test for related samples was used for pairwise comparisons. Spearman’s correlation analysis was used to correlate image noise as assessed quantitatively with the qualitative image noise score.
3.10.3 Automated plaque assessment
Chi-square test was used for categorical and t-test for continuous variables compared between cross-sections with versus those without any boundary corrections.
The percentage of cross-sections with boundary corrections per vessel was compared between FBPR, ASIR and MBIR using a paired Wilcoxon Rank-sum test. To assess the regional agreement of performing boundary corrections, Cohen’s kappa statistics was calculated between FBPR, ASIR, and MBIR.
To assess the association of co-variates to the benefit of MBIR over FBPR (or ASIR) multivariate logistic regression analysis was applied. As co-variates, minimal luminal diameter, plaque area and burden as well as the extent of calcification were included in the model, as derived from MBIR datasets. The extent of calcification was defined based on relative plaque volumes: no calcification equaled to 0% of plaque volume
≥180 HU, moderate calcification to 1-24% of plaque volume ≥180 HU, severe calcification to ≥25% of plaque volume ≥180 HU (81).
The intra-reader reproducibility was determined for the primary endpoint; the assessment was repeated with a time gap of two weeks in a random sub-set (n=9 vessels) of vessels reconstructed with FBPR, ASIR, or MBIR. The reproducibility was assessed using intraclass correlation coefficient (ICC) and Cohen’s kappa statistics.
3.10.4 MRI
Continuous variables with normal distributions are expressed as mean ± standard deviation, while categorical variables are given as counts and percentages.
Inter-observer agreement for image quality rating was assessed using Spearman’s rank correlation. Inter-observer agreement for plaque classification was determined by using kappa statistic as reported previously (82). Using histology as the gold standard, the sensitivity, specificity, positive, and negative predictive values (plus binominal 95%
confidence intervals) of MRI for the detection of calcium and lipid-rich necrotic core were calculated. The agreement between MRI classification and the gold standard histology was calculated using weighted kappa.
4 Results
4.1 Histopathological correlates of the napkin-ring sign plaque in CT
4.1.1 Histological characteristics of the napkin-ring sign
Based on the histopathological evaluation, advanced plaques (types IV-VI) were present in 139 (22.7%) of 611 cross-sections, while early lesions were found in 472 slices (77.3%). Among the advanced lesions 33 (23.7%) demonstrated an NRS in coronary CTA, whereas no NRS was found in 106 slices (76.3%), see Table 3 and Figures 4 and 5. However, NRS was also found in 5 of the 472 slices (1.1%) classified as early lesions.
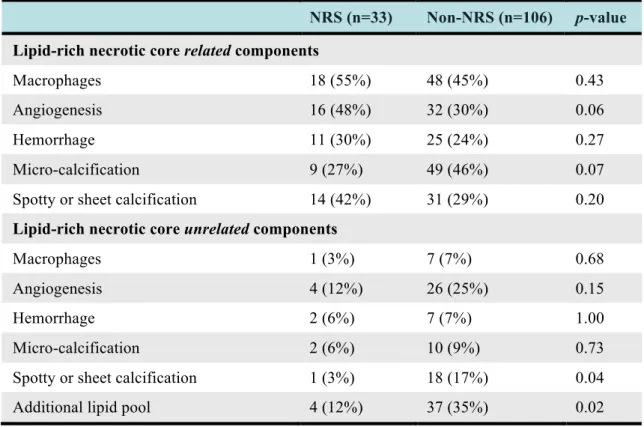
Table 3 – Distribution of histologic features in plaques with positive and negative NRS on coronary CT angiography.
NRS (n=33) Non-NRS (n=106) p-value Lipid-rich necrotic core related components
Macrophages 18 (55%) 48 (45%) 0.43
Angiogenesis 16 (48%) 32 (30%) 0.06
Hemorrhage 11 (30%) 25 (24%) 0.27
Micro-calcification 9 (27%) 49 (46%) 0.07
Spotty or sheet calcification 14 (42%) 31 (29%) 0.20
Lipid-rich necrotic core unrelated components
Macrophages 1 (3%) 7 (7%) 0.68
Angiogenesis 4 (12%) 26 (25%) 0.15
Hemorrhage 2 (6%) 7 (7%) 1.00
Micro-calcification 2 (6%) 10 (9%) 0.73
Spotty or sheet calcification 1 (3%) 18 (17%) 0.04
Additional lipid pool 4 (12%) 37 (35%) 0.02
The napkin-ring sign was most commonly observed in the right coronary artery (55%) followed by the left-circumflex artery (30%) and the left anterior descending artery (15%). In contrast, plaques without NRS were evenly spread among the 3 arteries. The median density of the non-calcified plaque portion was 61.8 HU [48.4-70.1 HU] for plaques with an NRS and 65.9 HU [49.3-87.7 HU] for plaques without NRS (p=0.10).
In plaques with a positive NRS, the median HU of the central hypodense area was 48.1 HU [33.4-61.6 HU], whereas the rim showed a median density of 68.2 HU [52.3-76.5 HU]. The difference between the density values was significant (p<0.001).
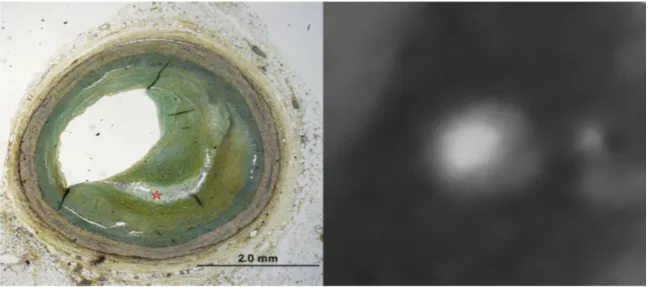
Figure 4 – (Late) fibroatheroma as classified by histology.
Note the large necrotic core (*) in the center of the plaque in the histology image (left image), which correlates with the hypodense center of the plaque (*) in CT (right image). The core is surrounded by prominent fibrotic tissue (open arrows), which appears as a hyperdense ring around the core in CT. Thus the plaque has a ring-like appearance in coronary CTA which was coined as napkin-ring sign. Additionally neovascularization is present within the plaque (closed arrow).
Figure 5 – (Early) fibroatheroma as classified by histology.
Note the small lipid core in the histology image (left image). Due to the small size, the lipid core (*) did not appear as a napkin-ring sign in coronary CTA.
4.1.2 Histologic features corresponding to the napkin-ring sign
The frequency of histologic plaque features and their relation to the presence or absence of NRS on CT is summarized in Table 3.
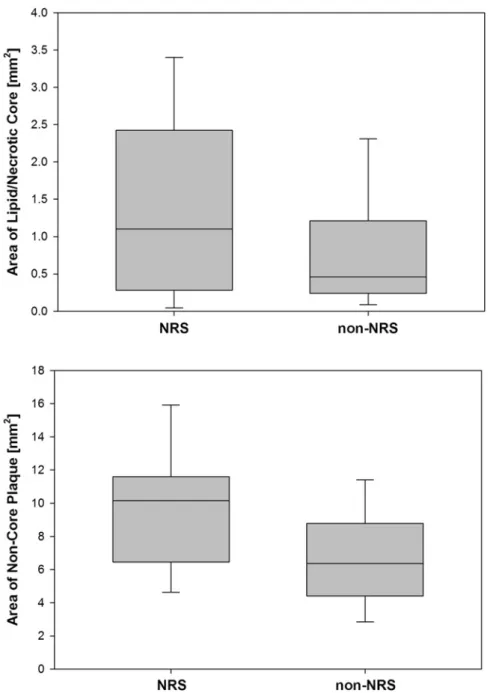
The area of the necrotic core was more than twice as large in plaques with NRS as compared to those without NRS (median 1.1 mm2 vs. 0.5 mm2, p=0.05, Figure 6).
Similarly, the area of non-core plaque was significantly larger in plaques with NRS as compared to those without (median 10.2 mm2 vs. 6.4 mm2, p<0.001, Figure 6).
The thickness of the fibrous cap was not different for plaques with and without NRS (median 0.4 mm vs. 0.3 mm, p=0.15). Microvessels within the plaque, indicative of angiogenesis tended to be more frequent in plaques exhibiting the NRS sign (48% vs. 30%, p=0.06), while microcalcifications tended to be more common in plaques without an NRS (27% vs. 46%, p=0.07). The presence of macrophages, hemorrhage, and calcifications (independent of whether they were spotty or sheet-like) in close proximity to the lipid core was not associated with the NRS. Additional lipid pools, smaller than the main core, were more common in plaques without an NRS (35%
vs. 12%, p=0.02) Histologic plaque features distant from the core were generally not associated with the NRS except for core-unrelated spotty and sheet calcifications, which were more commonly detected in the absence of an NRS (3% vs. 17%, p=0.04).
In multivariate adjusted analysis the area of the necrotic core [OR: 1.70 (95% CI: 1.12- 2.57 per increase by one mm2, p=0.01] and the area of the non-core plaque [OR: 1.24 (95% CI: 1.11-1.40) per increase by one mm2, p<0.01] remained as independent predictors of the NRS. In contrast, the presence of additional smaller lipid pools independently reduced the probability of the appearance of the NRS [OR: 0.22 (95%
CI: 0.07-0.75)].
Figure 6 – Areas of the lipid/necrotic core and the non-core plaque as measured in histology in plaques with presence and absence of the napkin-ring sign in coronary CTA.
Although there is a substantial overlap, the mean size of the core was significantly larger in plaques with positive NRS. Note that the vast majority of cores in plaques without the NRS had an area below 1 mm2, which is deemed a crucial size often found in rupture-prone lesions. Plaques with a positive NRS in coronary CT angiography also had a significantly higher non-core plaque area as compared to plaques without the NRS.
4.1.3 Other features associated with the napkin-ring sign
Plaques exhibiting a NRS on CT were located more proximally as compared to those without NRS (median distance from ostium 19.0 mm vs. 31.0 mm, respectively;
p=0.02). Also, the vessel area was larger at the site of the plaque (median 17.1 mm2 vs.
12.9 mm2, p=0.02) and plaque area itself was larger (median 11.5 mm2 vs. 7.5 mm2, p<0.001) in plaques with NRS than in plaques without NRS. Interestingly, the lumen area was not different between plaques with and without NRS (median 2.6 mm2 vs. 3.1 mm2, p=0.58). As a result, plaque burden was significantly larger in plaques with NRS as compared to those without NRS (80% vs. 69%, p<0.001).
In multivariate adjusted analysis both vessel area [OR: 0.84 (95% CI: 0.75-0.94) per 1 mm2 increase, p<0.01)] and plaque area [OR: 1.74 (95% CI: 1.36-2.21) per 1 mm2 increase, p<0.0001] remained independent predictors for the delineation of the NRS in CT. Plaque burden was not included in this analysis as it was co-linear and inferior to the combination of vessel and plaque area.
When adjusting for both histologic and associated features the area of the necrotic core area, the area of the non-core plaque, and the vessel area remained independent predictors for the appearance of the NRS with the area of the necrotic core being the strongest predictor (OR 1.91; 95% CI: 1.23-2.98). The combined model reached a c- statistic of 0.816, Table 4.
Table 4 – Independent predictors of the napkin-ring sign.
4.1.4 Interobserver-agreement
We found a very good correlation between the measurements for the vessel area, lumen area and the area of the necrotic core (r=0.998, 0.994, and 0.997 respectively) in histology. Measurements for necrotic core area and vessel area were significantly different between the two readers (p<0.05), however, the mean difference between the measurements was 1.9% (0.3±0.5 mm2) for the vessel area and 2.9% (0.04±0.08 mm2) for the area of the necrotic core. No difference was found between the two readers for the lumen area (p=0.61).
The interobserver agreement between the two CT readers to detect the napkin ring sign was excellent (Cohen’s kappa=0.86; 95% CI: 0.76-0.96).
Independent predictors OR (95%CI) p-value
Vessel area [per mm2] 0.88 (0.78-0.99) 0.03 Area of non-core plaque [mm2] 1.60 (1.24-2.05) 0.0002 Area of lipid and/or necrotic core [mm2] 1.91 (1.23-2.98) 0.004 Presence of additional lipid cores 0.36 (0.10-1.25) 0.11
4.2 Impact of CT image reconstruction on coronary plaque visualization
A total of 1125 images were used for this sub-analysis derived from three datasets reconstructed with FBPR, ASIR, and MBIR yielding 375 triplets of co-registered image sets. All of these were included in image quality analysis.
4.2.1 Qualitative image analysis
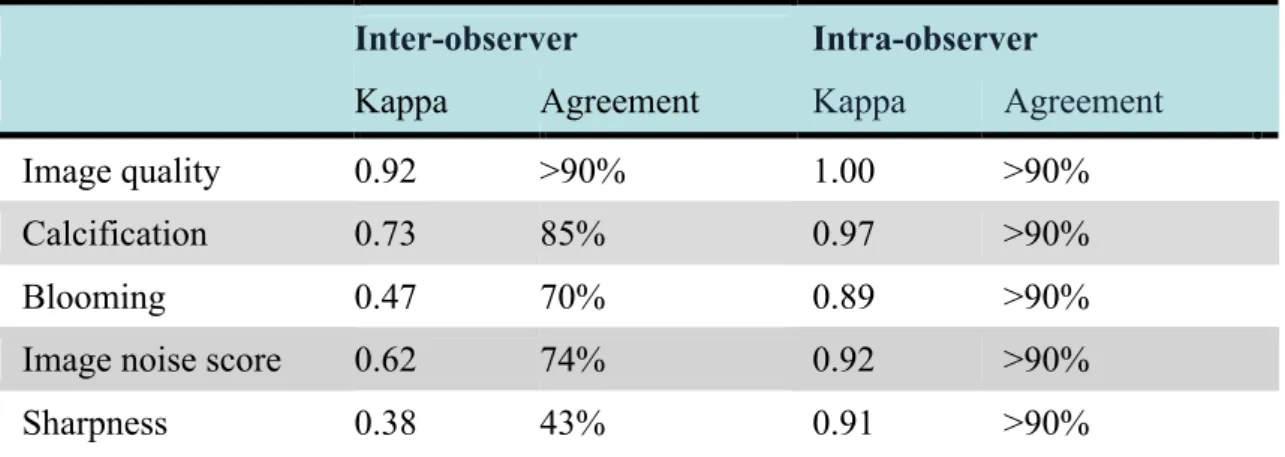
Kappa-values indicated good to excellent inter- and intraobserver agreement regarding qualitative parameters except for image sharpness (κ=0.38), Table 5. Although both readers had full agreement only in 43% of the cases regarding image sharpness, both were only a single category apart using a 5-point Likert scale in 54% of the cases.
Table 5 – Inter- and intra-observer agreement for qualitative parameters.
Inter-observer Intra-observer
Kappa Agreement Kappa Agreement
Image quality 0.92 >90% 1.00 >90%
Calcification 0.73 85% 0.97 >90%
Blooming 0.47 70% 0.89 >90%
Image noise score 0.62 74% 0.92 >90%
Sharpness 0.38 43% 0.91 >90%
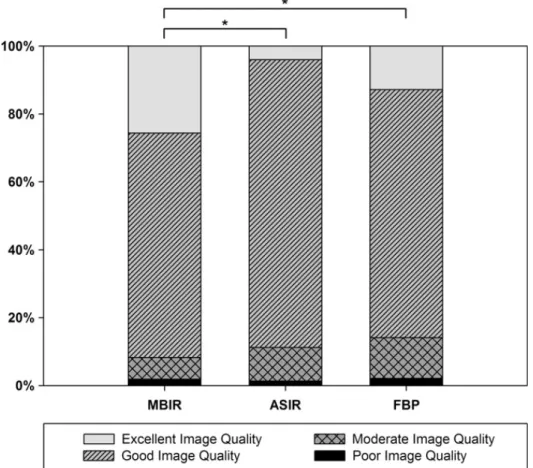
Overall image quality was classified to be good or excellent in 274 (73.1%) and 48 (12.8%) images using FBPR, 318 (84.8%) and 15 (4.0%) images using ASIR, and 248 (66.1%) and 96 (25.6%) using MBIR, Figure 7. Image quality was significantly better with MBIR than with ASIR (p<0.001) or FBPR (p<0.001). ASIR and FBPR reconstruction techniques yielded similar image quality (p=0.17).
Calcifications were observed in 369/1125 images (32.8%), no significant differences were discovered among the three reconstruction algorithms (FBPR, 33.9%; ASIR,
32.8%; MBIR, 31.7%; p = 0.53). Independent of the CT image reconstruction technique, image quality was significantly (p<0.001) worse if calcification was present.
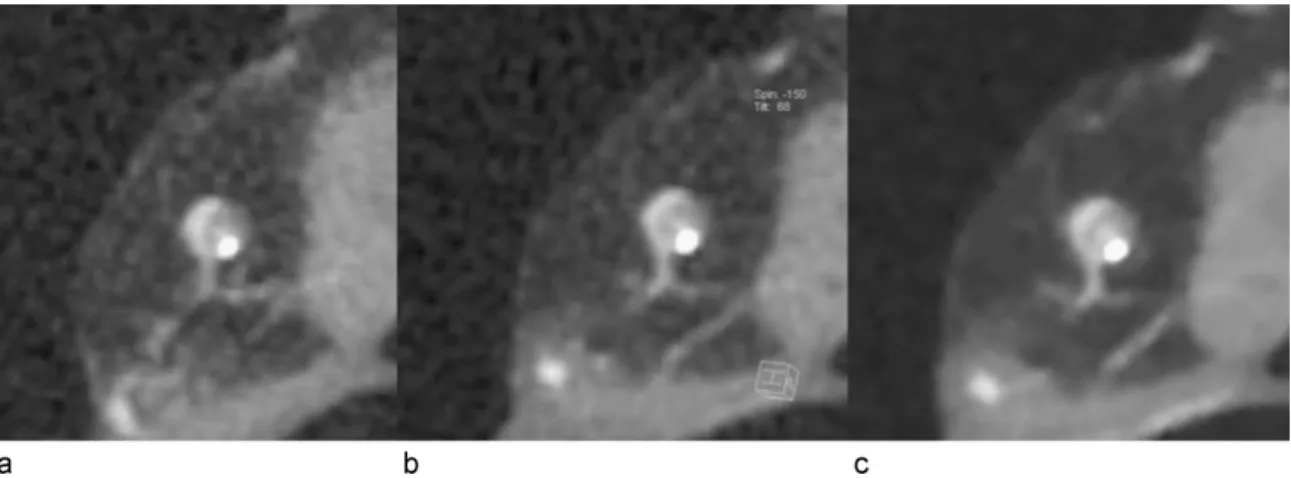
Regarding images with presence of calcifications, 87/369 images (23.6%) were considered to show no blooming, 267/369 images (72.4%) were considered to have blooming artifacts but allowing luminal visualization, and 15/369 images (4.1%) were considered to have blooming artifacts rendering luminal visualization impossible. No differences among FBRR, ASIR, and MBIR were revealed (p=0.95), Figure 8a–c.
Figure 7 – Overall image quality as assessed by qualitative analysis.
Image quality was significantly better with MBIR than with ASIR (*p<0.001) or FBPR (*p<0.001). ASIR and FBPR reconstruction techniques yielded similar image quality (p=0.17).
Figure 8 – Cross-sectional CT images of a partially calcified atherosclerotic plaque.
CT images reconstructed with (a) FBPR, (b) ASIR, and (c) MBIR technique. There is no difference in blooming of calcified component of the coronary artery plaque in the three different reconstruction modes.
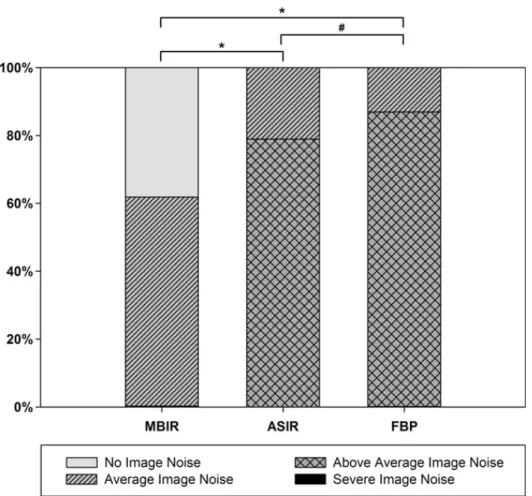
Regarding image noise score the majority of images were rated to be of score 3, using in 325 images (86.7%) reconstructed with FBPR, and 296 (78.9%) images reconstructed with ASIR. Regarding the reconstruction technique of MBIR, images were most frequently classified to be of image noise score 2 representing 231 (61.6%) of the cases.
Image noise was significantly lower by ASIR as compared to FBPR (p<0.01) and was further reduced by MBIR as compared to ASIR (p<0.001, Figure 9).