G E N E T I C S
Myeloid Tribbles 1 induces early atherosclerosis via enhanced foam cell expansion
Jessica M. Johnston1, Adrienn Angyal1, Robert C. Bauer2,3, Stephen Hamby4, S. Kim Suvarna1, Kajus Baidžajevas1, Zoltan Hegedus5,6, T. Neil Dear7, Martin Turner8, The Cardiogenics Consortium*, Heather L. Wilson1, Alison H. Goodall4, Daniel J. Rader3, Carol C. Shoulders9†, Sheila E. Francis1, Endre Kiss-Toth1†
Macrophages drive atherosclerotic plaque progression and rupture; hence, attenuating their atherosclerosis- inducing properties holds promise for reducing coronary heart disease (CHD). Recent studies in mouse models have demonstrated that Tribbles 1 (Trib1) regulates macrophage phenotype and shows that Trib1 deficiency increases plasma cholesterol and triglyceride levels, suggesting that reduced TRIB1 expression mediates the strong genetic association between the TRIB1 locus and increased CHD risk in man. However, we report here that myeloid-specific Trib1 (mTrib1) deficiency reduces early atheroma formation and that mTrib1 transgene expression increases atherogenesis. Mechanistically, mTrib1 increased macrophage lipid accumulation and the expression of a critical receptor (OLR1), promoting oxidized low-density lipoprotein uptake and the formation of lipid-laden foam cells. As TRIB1 and OLR1 RNA levels were also strongly correlated in human macrophages, we suggest that a conserved, TRIB1-mediated mechanism drives foam cell formation in atherosclerotic plaque and that inhibiting mTRIB1 could be used therapeutically to reduce CHD.
INTRODUCTION
Atherosclerosis, a progressive disease of arterial blood vessels and the main underlying cause of stroke, myocardial infarction, and cardiac death (1), is initiated by the conversion of plaque macro- phages to cholesterol-laden foam cells (2) in the arterial intima (3). In the early-stage atherosclerotic plaque, this transformation is induced by the uptake of both low density lipoprotein-cholesterol (LDL-C) and oxidized LDL (oxLDL) (2, 4), which may serve a beneficial purpose (3); but unrestrained, the crucial function of plaque macro- phages in resolving local inflammation is compromised, and the development of unstable, advanced lesions ensues (3). It has been shown that foamy macrophages are not only less effective in clear- ing apoptotic cells (5), they are also more prone to apoptosis (6), thus increasing secondary necrosis and the release of cellular compo- nents and lipids that ultimately form the necrotic core of advanced plaques. Hence, there have been investigations into the identities of macrophage- specific proteins that induce lipid accumulation. Thus, myeloid– lipoprotein lipase (LPL), for example, has been shown to enhance the retention of LDL-C and triglyceride-rich remnant par- ticles within the artery wall (7) and induce foam cell formation (8),
while the scavenger receptor, oxidized low-density lipoprotein re- ceptor 1 (OLR1) has been found to internalize oxLDL (9), promoting not only lipid accumulation and growth but also the survival of macrophage foam cells (10). Conversely, myeloid-ApoE expression has been shown to promote high-density lipoprotein (HDL)–mediated cholesterol efflux (11) and macrophage switching from a pro- inflammatory (M1) to an alternatively (M2) activated phenotype (12). However, substantial advances in the development of cardio- vascular disease (CVD) therapeutics await the identification of an apical regulator(s) that acts in a coordinated manner on the multiple downstream processes governing lipid accumulation, as well as atherogenicity of plaque- resident macrophages.
Tribbles 1 (Trib1) has been detected in murine plaque-resident macrophages (13), and variants at the TRIB1 locus have been associated with increased risk of hyperlipidemia and atherosclerotic disease in multiple populations (14, 15). However, no study had examined the macrophage-specific cellular processes dependent on myeloid-specific Trib1 (mTrib1) expression and how these tally with the assumed atheroprotective properties of this pseudokinase. At the whole-body level, one study has shown that Trib1-deficient mice have markedly reduced numbers of M2-like (F4/80+ MR+) macrophages in multiple organs, including adipose tissue (16). Hence, these studies strongly implicated that loss of macrophage-Trib1 expression within the arterial wall would lead to excessive atherosclerotic plaque inflammation and/or impair inflammation resolution and promote atheroma for- mation. Moreover, in hepatocytes, Trib1 suppresses very-low-density lipoprotein production and de novo lipogenesis (15), indicating that the association between variants at the TRIB1 locus and atherosclerotic disease (14, 15) relates to loss of TRIB1 activity.
In the current study, we found that contrary to expectations, myeloid- specific knockout (KO) of Trib1 is atheroprotective, while mTrib1 expression is detrimental. In brief, Trib1 increased OLR1 RNA and protein expression, oxLDL uptake, foamy macrophage forma- tion, and atherosclerotic burden in two distinct mouse models of human disease. The expression of these two genes, as well as those of LPL and SCARB1 (which mediates selective HDL-cholesterol uptake
1Department of Infection, Immunity and Cardiovascular Disease, University of Sheffield, Beech Hill Road, Sheffield S10 2RX, UK. 2Division of Cardiology, Depart- ment of Medicine, Columbia University Medical Center, New York, NY 10032, USA.
3Perelman School of Medicine at the University of Pennsylvania and Children’s Hospital of Philadelphia, Philadelphia, PA 19104-5158, USA. 4Department of Cardio- vascular Sciences, University of Leicester and NIHR Cardiovascular Biomedical Research Unit, Glenfield Hospital, Leicester, UK. 5Institute of Biophysics, Biological Research Centre, Hungarian Academy of Sciences, Temesvari korut 62, Szeged H-6726, Hungary. 6Departments of Biochemistry and Medical Chemistry, University of Pecs, Medical School, Szigeti ut 12, Pecs H-7624, Hungary. 7Division of Biomedical Services, University of Leicester, Leicester, UK. 8Laboratory of Lymphocyte Signalling and Development, The Babraham Institute, Babraham Research Campus, Cambridge CB22 3AT, UK. 9Centre for Endocrinology, William Harvey Research Institute, Queen Mary University of London and the Barts and the London School of Medicine and Dentistry, London EC1M 6BQ, UK.
*Membership of the Cardiogenics Consortium appears in the Supplementary Materials.
†Corresponding author. Email: c.shoulders@qmul.ac.uk (C.C.S.); e.kiss-toth@sheffield.
ac.uk (E.K.-T.)
Copyright © 2019 The Authors, some rights reserved;
exclusive licensee American Association for the Advancement of Science. No claim to original U.S. Government Works. Distributed under a Creative Commons Attribution License 4.0 (CC BY).
on November 21, 2019http://advances.sciencemag.org/Downloaded from
(17)), is also tightly linked in human macrophages. Collectively, our studies reveal an unexpected beneficial effect for selectively silenc- ing Trib1 in arterial plaque macrophages.
RESULTS
Myeloid Trib1 increases atherosclerosis burden
Immunostaining of human coronary atheromas from patients undergoing endarterectomies detected Trib1 in the arterial wall, including in 42.79 (± 2.31)% of CD68+ macrophages (Fig. 1A). We therefore examined the impact of macrophage Trib1 expression on atherogenesis by creating mice expressing low, wild-type (WT), and elevated levels of myeloid Trib1 as outlined in Fig. 1 (B to F). Although previous studies have demonstrated that global Trib1 KO significantly increases perinatal lethality (16), Trib1-floxed mice and myeloid- specific Trib1 KO (Trib1mKO) mice were fully viable and bred normally (fig. S1, A to D). mTrib1 transgenic (overexpressing, Trib1mTg) mice were also fully viable and bred normally. mTrib1 RNA levels were substantially lower in Trib1mKO than in floxed WT littermates, as judged by reverse transcription–quantitative polymerase chain reaction (RT-qPCR) assays performed on bone marrow–derived macrophages (BMDMs) prepared from these animals (Fig. 1G). As judged by enhanced green fluorescent protein (eGFP) expression, the bicistronic Trib1 transgene was expressed in 78.43 ± 2.33% and 65.58 ± 0.92% of blood monocytes and peritoneal macrophages, respectively (Fig. 1G), and overall, the transgene increased BMDM Trib1 RNA levels by 2.49 ± 0.43 (SEM) fold (Fig. 1G, bottom right).
Consistent with previous findings (18), the transgene was also ex- pressed in neutrophils, which form a minor component of the immune cell population within very early-stage atherosclerotic lesions (19).
Thus, we detected eGFP in 53.88 ± 2.41% and 34.93 ± 2.96% of Trib1mTg blood and bone marrow CD11b+/Ly6C−/Ly6G+ cells, respectively, compared to 25.95 ± 3.16% and 12.42 ± 2.01% in their CD11b+/Ly6C+/Ly6G− monocyte counterparts (fig. S1, E to I).
However, in marked contrast to the reported full-body Trib1 KO mouse (16), Trib1mKO mice were not afflicted by reduced numbers of total, or individual, white blood cells (Fig. 1H) or by reduced macrophage numbers in their adipose tissue (F4/80+, fig. S2A), liver (F4/80+, fig. S2B), or spleen (F4/80+ and CD206+, fig. S2C). Similar to Trib1mKO mice, Trib1mTg mice displayed no gross abnormalities and had WT numbers of white blood cells (Fig. 1H). In addition, the sizes of their adipocytes (fig. S2A), liver (fig. S2B), and splenic (fig.
S2C) macrophage populations were unaltered.
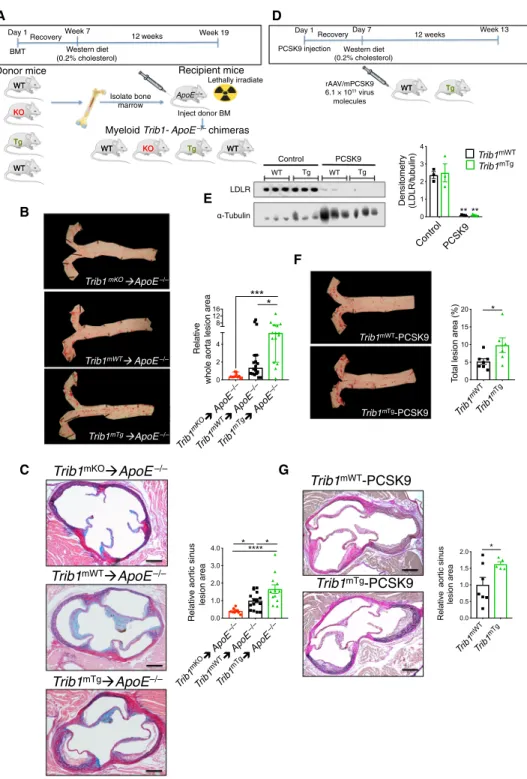
To address the contribution of mTrib1 in early atherosclerosis, we first transplanted bone marrow cells from the Trib1mKO and Trib1mTg mice and their respective controls (i.e., non-CRE, floxed KO, and Tg alleles) into 12- to 13-week-old lethally irradiated male ApoE−/− mice (Fig. 2A). Thus, all recipient mice received ApoE+/+– bone marrow cells to mitigate the previously described effects of total ablation of this apolipoprotein on both classical/proinflammatory (M1) and alternative/anti-inflammatory (M2) polarization (12) and to provide them with a physiologically important source of APOE to aid normalization of plasma cholesterol levels and of the lipoprotein profile in this otherwise extreme hyperlipidemic mouse model of human atherosclerosis (12, 20). In short, this experiment allowed modeling of early atherogenesis in a setting more akin to the human disease. Following a 7-week recovery period, the chimeric mice were fed a Western diet containing 0.2% cholesterol for 12 weeks.
At sacrifice, and consistent with expectations of the study design,
the chimeric mice had relatively low plasma cholesterol levels for a mouse model of human atherosclerosis (fig. S3A).
Unexpectedly, we found less atherosclerosis in the thoracic aorta of Trib1mKO➔ApoE−/− chimeras than in the control WT mice (Fig. 2B and fig. S4A). Conversely, there was a significantly higher atheroma burden in the Trib1mTg➔ApoE−/− mice (Fig. 2B and fig. S4A). Simi- larly, the lesions in the aortic sinus were, on average, smaller in the Trib1mKO➔ApoE−/− mice and larger in the Trib1mTg➔ApoE−/−
mice (Fig. 2C and fig. S4B). However, the collagen contents of the Trib1mKO➔ApoE−/− and Trib1mTg➔ApoE−/− in these “early-stage”
plaques and their clinical pathology were comparable to those of the chimeric Trib1mWT➔ApoE−/− mice (fig. S4C). In short, we found that mTrib1 expression increased the atherosclerotic burden of ApoE−/− mice, despite having little impact on plasma LDL-cholesterol levels (fig. S3A).
To confirm that mTrib1 accelerates the development of athero- sclerosis (Fig. 2, B and C), we created an LDL receptor (Ldlr) knock- down model of human atherosclerosis (21) to induce hyperlipidemia and atherosclerosis in otherwise WT mice (21). Specifically, mice were injected with an adeno-associated virus (rAAV8) encoding for proprotein convertase subtilisin/kexin 9 (Fig. 2D), which previous studies have shown lowers both hepatic and extrahepatic surface cell expression of the Ldlr (22). Following feeding a Western diet for 12 weeks, this intervention produced comparable, highly significant reductions in LDLR protein levels in the Trib1mTg and Trib1mWT mice (Fig. 2E) and a similar degree of hyperlipidemia (fig. S3B).
However, despite this and consistent with mTrib1 expression in- creasing atheroma formation in ApoE−/− mice, Trib1mTg injected with rAAV8-Pcsk9 developed a significantly higher atherosclerotic burden in their aorta and aortic sinus than their similarly injected Trib1mWT mice (Fig. 2, F and G).
Myeloid Trib1 increases macrophage/foam cell size in the atherosclerotic plaque
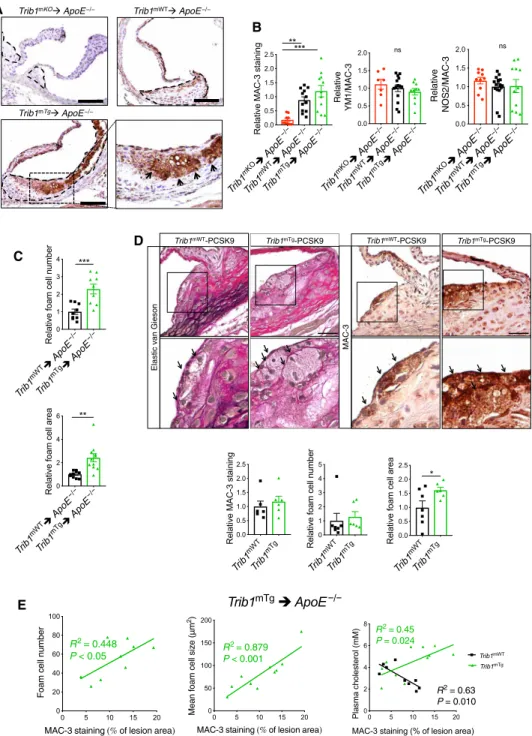
Next, we investigated the macrophage content and phenotype in the atherosclerotic plaque in each mouse model. This revealed that the aortic sinus lesions of Trib1mKO➔ApoE−/− mice contained a much smaller MAC-3+ immunoreactive area than the chimeric Trib1mWT➔ApoE−/− mice, while on average, the Trib1mTg➔ApoE−/−
atheromas contained a marginally larger stained area (Fig. 3, A and B).
However, there was no preferential loss of YM1+ macrophages in the Trib1mKO➔ApoE−/− lesions (Fig. 3B), consistent with the finding that M2 polarization of Trib1-deficient BMDMs isolated from whole- body Trib1mKO mice are compromised to a similar extent as M1 polarization (23). In addition, we could not attribute the proatherogenic activity of myeloid Trib1 expression to a preferential increase in the proinflammatory macrophage (NOS2+) content of Trib1mTg➔ApoE−/−
plaque (Fig. 3B, right). Rather, the increased atherosclerosis in the Trib1mTg➔ApoE−/− chimeras was attributable to a doubling of foam cell numbers (cells with characteristic foamy appearance and MAC-3+ (fig. S4D), and on average, these cells were also larger (Fig. 3, A and C, and fig. S4D). While the Trib1mWT-Pcsk9 atheromas had a similar- sized macrophage population (Fig. 3D), the size of the plaque-resident foam cells in the transgenic animals was larger (Fig. 3D).
In the Trib1mTg➔ApoE−/− chimeras, there was a stronger cor- relation between the mean foam cell size and the percentage of aortic sinus stained by MAC-3 than between MAC-3+ staining and foam cell numbers (Fig. 3E), and we could not ascribe the observed increase in plaque-foam cell numbers on the effects of mTrib1 expression on
on November 21, 2019http://advances.sciencemag.org/Downloaded from
P
i ii i iii
Trib1 locus
Exon 1 Exon 2 Exon 3
SA
FRT IRES GFP pA loxP
Neo pA loxP FRT STOP Trib1 mRNA
Rosa26 locus
Exon 1 Exon 2 Exon 3
SA FRT
IRES LacZ pA loxP
Neo pA
FRT loxP loxP
loxP loxP
tm1a
tm1c mRNA
mRNA
Exon 1 loxP Exon 3
tm1d mRNA
Exon 1 Exon 2 Exon 3
Exon 1 Exon 2 Exon 3
SA
FRT
IRES GFP pA
loxP FRT
Trib1 mRNA
Human atheroma 40
45 50
% TRIB1/CD68
Trib1 mWT
Trib1 mTg 0 1 2 3 4 5
Relative Trib1 RNA levels *
GFP-negativeGFP-positive
0 20 40 60 80 100
% Blood monocytes ****
BMDMs Monocytes
Macrophages
Trib1
mWT
Trib1
mTg 0 2 4 6
White blood cell count (×109/liter) ns
Trib1
mWT
Trib1
mTg 0 20 40 60 80
Lympocytes (%)
Trib1 mWT
Trib1mTg
0 5 10 15
Monocytes, eosinophils, & basophils (%)
Trib1mWTTrib1mTg
0 10 20 30
Neutrophils (%)
Trib1
mWT
Trib1
mKO 0 1 2 3 4 5
White blood cell count (×109/liter) ns
Trib1
mWT
Trib1
mKO 0 20 40 60 80 100
Lymphocytes (%)
Trib1 mWT
Trib1 mKO 0 5 10 15 20
Monocytes, eosinophils, & basophils (%)
Trib1
mWT
Trib1
mKO 0 5 10 15 20 25
Neutrophils (%)
A B
C
D
E
F G
H
Trib1 mWT
Trb1 mTg 0 5 10 15
Macrophages (% of peritoneal cells) Trib1
mWT Trib1
mKO 0.000 0.001 0.002 0.003 0.004 0.005
Relative Trib1 RNA levels
**
BMDMs
Fig. 1. Generation and characterization of myeloid-specific Trib1 mouse strains. (A) Representative immunohistochemistry image of human atherosclerotic plaque (P). Red, TRIB1; brown, CD68+. (ii) Magnification (×40) of boxed area. Arrowhead highlights a double-positive cell. Quantification (mean ± SD) of three patient samples. (iii) Isotype control (scale bar, 50 m). (B) Targeting construct used to produce the null, conditional-ready/floxed (tm1c) and conditional-null (tm1d) Trib1 alleles. Predicted transcripts below. FRT, flippase recognition target; SA, splice acceptor; pA, polyadenylation motif; IRES, internal ribosome entry site; LacZ,
-galactosidase; Neo, neomycin resistance gene. (C) Trib1mWT allele following removal of the “gene-trap” cassette. (D) Conditional-null Trib1 allele was produced by crossing tm1c and Cre-expressing mice. (E) Construct used to produce Trib1mWT and Trib1mTransgenic (Tg) mice. (F) Cre-mediated excision of the STOP cassette produces a bicistronic Trib1-eGFP transcript. Bent arrow, indicates transcription from endogenous Rosa26 promoter. (G) Trib1 RNA (relative to Actb) in BMDMs from homozygous tm1c (i.e., Trib1mWT) and Trib1mKO mice (n = 3 per group). eGFP expression in monocytes of three Trib1mTg mice and peritoneal macrophages from specified mice (n = 3 per group). Trib1 RNA levels (relative to Trib1mWT) in BMDMs of Trib1mTg (n = 5 to 7 per group). (H) Blood cell counts of mixed-gender Trib1mKO (top) and Trib1mTg (bottom) and their respective WT littermates (n = 5 to 6 per group). Data are means ± SEM. Significances were determined by Student’s t test, *P < 0.05, **P < 0.01, and
****P < 0.0001. ns, non-significant.
on November 21, 2019http://advances.sciencemag.org/Downloaded from
Isolate bone
marrow ApoE
Lethally irradiate
Inject donor BM
WT KO Tg WT
KO
Tg WT WT
Donor mice Recipient mice
Myeloid Trib1- ApoE−/− chimeras
BMT
Day 1 Week 7
Recovery 12weeks Week 19
Western diet (0.2% cholesterol)
Tg rAAV/mPCSK9 WT
6.1 × 10¹¹ virus molecules PCSK9 injection
Day 1 Day 7
Recovery Week 13
Western diet (0.2% cholesterol)
12 weeks
Trib1 mWT
Trib1 mTg 0 5 10 15 20
Total lesion area (%) *
Trib1 mKO
ApoE –/–
Trib1 mWT
ApoE –/–
Trib1 mTg
ApoE –/–
0 2 4 128 16
****
Relative whole aorta lesion area
Trib1mTg ApoE–/–
Trib1mWT ApoE–/–
Trib1mKO ApoE–/– Trib1mWT-PCSK9
Trib1mTg-PCSK9 A
LDLR WT
Control PCSK9
-Tubulin
WT
Tg Tg
Control PCSK9
0 1 2 3 4
Densitometry (LDLR/t
ubulin) Trib1mWT
Trib1mTg
** **
Trib1
mWT
Trib1
mTg 0.0 0.5 1.0 1.5 2.0
Relative aortic sinus lesion area
*
Trib1 mKO
ApoE –/–
Trib 1mWT
ApoE –/–
Trib1 mTg
ApoE –/–
0.0 1.0 2.0 3.0 4.0
Relative aortic sinus lesion area
*****
*
B
C
D
E
F
G
Trib1mWT ApoE–/–
Trib1mKO ApoE–/–
Trib1mTg ApoE–/–
Trib1mWT-PCSK9
Trib1mTg-PCSK9
−/−
WT KO Tg WT
KO
Tg WT
WT WT Tg
Fig. 2. Myeloid-specific Trib1 expression increases atherosclerosis burden in two murine models of human atherosclerosis. (A) Schematic of the bone marrow transplant experiment. Bone marrow cells from myeloid-specific Trib1 KO and transgenic (Tg) mice and their respective WT controls were transplanted into ApoE−/− recipients. (B) Representative en face Oil Red O staining of thoracic aortas (week 19) from specified chimeras. Lesion areas were calculated as percentages of the total surface area of the whole aorta and normalized (median, ±95% confidence interval) to Trib1mWT; n = 10 to 18 per group. (C) Rep- resentative images of Elastic van Gieson–stained aortic sinus lesions. Quantification relative to WT (n = 10 to 16 mice per group). (D) Second model of human atherosclerosis. rAAV/mPCSK9, recombinant adenovirus–produced murine proprotein convertase subtilisin/kexin 9. (E) LDLR protein in liver samples from specified mice was quantified by Western blotting (n = 3 per group). (F) Representative en face Oil Red O staining of thoracic aortas from specified mice. Lesion areas were calculated as percentages of the total surface areas of the whole aorta (n = 6 to 7 per group). (G) Representative images of Elastic van Gieson–stained aortic sinus lesions of specified mice and quantification, relative to WT (n = 5 to 7 per group). Scale bars, 200 m (C and G). Data are means ± SEM. Sig- nificance was determined by one-way (B and C) or two-way analysis of variance (ANOVA) (E) or Student’s t test (F and G). *P < 0.05, **P < 0.01, ***P < 0.001, and
****P < 0.0001.
on November 21, 2019http://advances.sciencemag.org/Downloaded from
blood cholesterol levels (Fig. 3E), HDL-C levels, or the nonsignificant rise in LDL-C (fig. S3). While the Trib1mWT➔ApoE−/− chimeras with the highest plasma cholesterol, HDL-C, and LDL-C concentrations had the lowest amount of MAC-3+ staining in their aortic sinus lesions, the inverse was true for the Trib1mTg➔ApoE−/− chimeras
(Fig. 3E, right, and fig. S3). Thus, collectively, these data indicate that increased macrophage lipid uptake/storage was the prominent driving force for the observed foam cell expansion besetting the early stage of the atherosclerotic process in these and the Trib1mTg- Pcsk9 mice.
Trib1mKO ApoE−/− Trib1mWT ApoE−/−
Trib1mTg ApoE−/−
Elastic van Gieson
Trib1mWT-PCSK9 Trib1mTg-PCSK9
MAC-3
Trib1mTg-PCSK9 Trib1mWT-PCSK9
Trib1 mWT
ApoE
−/−
Trib1 mTg
ApoE
−/−
0 1 2 3 4
Relative foam cell number
***
Trib1 mWT
ApoE
−/−
Trib1 mTg
ApoE
−/−
0 2 4 6
Relative foam cell area
**
Trib1 mWT
Trib1 mTg 0.0 0.5 1.0 1.5 2.0 2.5
Relative MAC-3 staining
Trib1 mWT
Trib1 mTg 0 1 2 3 4 5
Relative foam cell number
Trib1 mWT
Trib1 mTg 0.0 0.5 1.0 1.5 2.0 2.5
Relative foam cell area
* Trib1
mKO ApoE
−/−
Trib1 mWT
ApoE
−/−
Trib1 mTg
ApoE
−/−
0.0 0.5 1.0 1.5 2.0 2.5
Relative MAC-3 staining
*****
Trib1 mKO
ApoE
−/−
Trib1mWT ApoE
−/−
Trib1mTg ApoE
−/−
0.0 0.5 1.0 1.5 2.0
Relative YM1/MAC-3
ns
Trib1
mKO
ApoE
−/−
Trib1
mWT
ApoE
−/−
Trib1
mTg
ApoE
−/−
0.0 0.5 1.0 1.5 2.0
Relative NOS2/MAC-3
ns
0 5 10 15 20
0 50 100 150 200
MAC-3 staining of lesion area Mean foam cell size (m2)
R2= 0.879 P < 0.001
0 5 10 15 20
0 20 40 60 80 100
MAC-3 staining of lesion area
Foam cell number
R2= 0.448 P < 0.05
0 5 10 15 20
0 2 4 6 8
MAC-3 staining (% of lesion area)
Plasma cholesterol (mM)
R2= 0.45 P = 0.024
Trib1mTg Trib1mWT
R2= 0.63 P = 0.010
A
B
C D
E Trib1mTg ApoE−/−
Fig. 3. Myeloid-Trib1 induces foam cell expansion. (A) MAC-3 staining (brown) of representative cross sections of the aortic sinus from specified mice (scale bars, 100 m). Dashed lines indicate lesion boundaries. Arrows highlight foam cells in the boxed region (40-fold magnification). (B) Staining of aortic sinus lesions from specified chimeric mice with specified antibodies: MAC-3 (n = 9 to 12 per group) and double-positive YM1/MAC-3 (n = 7 to 14 per group) and NOS2/MAC-3 (n = 10 to 16 per group) cells. (C) Quantification of relative foam cell numbers (top) and size (bottom) in aortic sinus lesions of specified chimeras. n = 10 to 16 per group. (D) Representative images (scale bars, 30 m) of Elastic van Gieson– and MAC-3–stained aortic sinus lesions from specified mice injected with rAAV/mPCSK9 (n = 9 to 11 per group). Arrows in mag- nified (×40) images of boxed area highlight foam cells. Quantification of MAC-3 staining and foam cell numbers and sizes (n = 6 to 7 per group). (E) Correlation between MAC-3 staining (x axis) in aortic sinus lesions of specified chimeric mice and foam cell numbers (left), foam cell size (middle), and plasma cholesterol levels (right). MAC-3 staining expressed as percentage (%) of total aortic sinus lesion area. R2, Pearson correlation coefficient. In (B) to (D), data (means ± SEM) are expressed relative to WT. Sta- tistical differences were determined by one-way ANOVA (B) or Student’s t test (C and D). *P < 0.05, **P < 0.01, and ***P < 0.001.
on November 21, 2019http://advances.sciencemag.org/Downloaded from
Myeloid TRIB1 expression induces OLR1 expression in both mouse and man
To identify potential cellular mechanisms by which mTrib1 enhances foam cell expansion, we analyzed the gene expression characteristics of human TRIB1High monocytes and TRIB1High monocyte-derived macrophages (MDMs) using the microarray RNA data produced in the Cardiogenics Transcriptomic Study (CTS) (24). In this dataset, involving samples from 758 individuals, TRIB1 RNA levels were, on average, higher in monocytes than in MDMs (Fig. 4A, top) but, as is evident from the analyses of RNA levels in 596 paired samples, there was no correlation between TRIB1 RNA levels in these two cell types (Fig. 4A, bottom). Moreover, genes differentially expressed in TRIB1High versus TRIB1Low monocytes were enriched for different sets of “DAVID” Gene Ontology cluster terms (tables S1 and S2) than those characterizing the more lipid-based transcriptome of TRIB1High MDM (Fig. 4, B and C, and table S3).
The Cardiogenics Transcriptomic data strongly suggested that the mTRIB1-induced foam cell phenotype stemmed from increased oxLDL uptake rather than changes in LDLR and scavenger receptor class B type 1 [which mediates selective HDL-cholesterol uptake and efferocytosis (17)] expression (Fig. 4C) or reductions in ABCG1- and ABCA1-mediated cholesterol efflux (Fig. 4B). Notably, OLR1 was the fourth most differentially expressed gene in the TRIB1High human MDMs and the most highly altered scavenger receptor in these cells (Fig. 4C). We therefore examined the effect of mTrib1 transgene expression on the expression of this oxLDL receptor (9).
This revealed that Trib1mTg BMDMs contained more Olr1 RNA but fewer Scarb1 transcripts (Fig. 4D) than their Trib1mWT counterparts, indicating that the increased numbers of OLR1 and reduced numbers of SCARB1 transcripts in human TRIB1High MDMs are causally re- lated to the increased number of TRIB1 transcripts in these cells.
The reciprocal relationship between OLR1 and SCARB1 RNA levels in TRIB1High MDMs was also recapitulated in interferon- (IFN-)/
lipopolysaccharide (LPS), interleukin-4 (IL-4)–polarized (fig. S5A) and fatty acid–polarized MDM samples but not in HDL-polarized MDMs (fig. S5B and table S4). Rather, HDL-polarized MDMs con- tained OLR1 and SCARB1 RNA levels indistinguishable from those of nonpolarized MDMs (fig S5, A and B, and table S4), indicating that Trib1 induces Olr1 expression and foam cell formation via a non- HDL uptake–mediated mechanism. Last, to substantiate the evidence for causal TRIB1 involvement in OLR1 expression, we stained BMDMs for OLR1 protein. OLR1 was detected in twice as many Trib1mTg cells than their WT counterparts (Fig. 4E), consistent with the Western blotting analysis of whole BMDM cell lysates (Fig. 4F).
mTrib1-induced OLR1 expression in plaque macrophages increases atherosclerotic burden
To corroborate the evidence for causal mOLR1 involvement in plaque- resident macrophage foam cells expansion, we quantified OLR1 expression in the aortic sinus lesions of our mouse models using an OLR1 antibody that recognizes the cell surface–expressed form of this oxLDL receptor, as well as the proteolytically cleaved (soluble) extracellular form (9). The antibody detected OLR1 in MAC-3+ cells and in acellular areas of the mouse aortic sinus lesions, including in regions adjacent to plaque macrophages (Fig. 5A). Moreover, as ex- pected from the known expression and regulation of this scavenger receptor in endothelial cells (9), significant amounts of OLR1 was also detected in the nonmacrophage (i.e., MAC-3−) cell population at the plaque surface of the more hyperlipidemic model of human
atherosclerosis (Fig. 5A and fig. S3). Last, confirming the causal in- volvement of mTRIB1 in mOLR1 expression (Fig. 4, D to F), Fig. 5A shows that the anti-OLR1 antibody detected OLR1 in more of the plaque macrophages of Trib1mTg➔ApoE−/− mice than in those of the Trib1mWT➔ApoE−/− control animals (33.89 ± 6.56% versus 16.18 ± 4.05%); a result which was replicated in the Trib1mTg-Pcsk9 and Trib1mWT-Pcsk9 mice (29.35 ± 7.42% versus 10.38 ± 3.36%) (Fig. 5A).
To mechanistically validate the contribution of mTrib1-induced Olr1 expression to foam cell expansion, we incubated nonpolarized BMDMs with oxLDL for 24 hours. This led to marked rises in the intra- cellular levels of both total cholesterol (2.71 ± 0.24–fold, P = 0.0091) and unesterified cholesterol (5.81 ± 0.83–fold, P = 0.0049) in the Trib1mTg BMDMs but not in their WT counterparts (Fig. 5B). In addition, as judged by Oil Red O staining, oxLDL transformed nearly three times as many Trib1mTg BMDMs into foam cells than Trib1mWT cells (P < 0.0001, Fig. 5C), as evidenced by the very visible increase in neutral lipid accumulation in these cells upon exposure to oxLDL.
In contrast to the profound effects of oxLDL on cholesterol accu- mulation in unpolarized Trib1mTg BMDMs, we observed no impair- ment of HDL-mediated cholesterol efflux (Fig. 5D), consistent with the observation that neither Abca1 nor Abcg1 RNA levels are re- duced in these BMDMs (Fig. 5D) and that the Trib1mTg➔ApoE−/−
chimeras have higher, rather than lower, HDL-C levels than their WT peers (fig. S3). Thus, collectively, our results suggest that Trib1- induced foam cell expansion in early-stage atherosclerotic plaque arises from increased cholesterol/neutral lipid uptake and retention rather than reduced HDL-mediated cholesterol efflux.
DISCUSSION
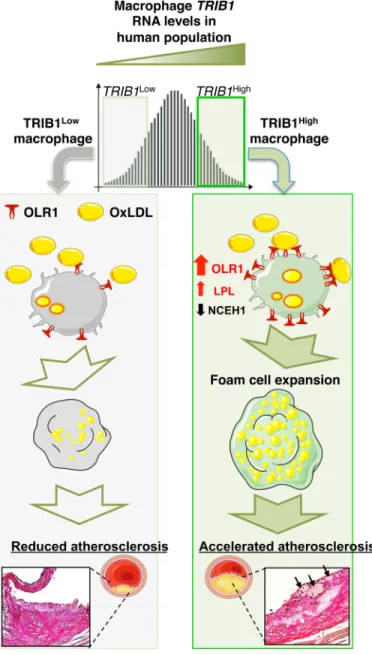
Despite the success in establishing that hepatic Trib1 expression affects the regulation of multiple cellular processes modulating blood cholesterol and triglyceride levels (15), the influence of global-KO of Trib1 on shaping the phenotype of macrophages (16), and the finding that variants at the TRIB1 locus are associated with and in- creased coronary heart disease (CHD) risk (14), the contribution of Trib1 on atherogenesis remains to be addressed. Here, we demon- strate that there is a wide distribution of TRIB1 RNA levels in human MDMs and that genetically engineered changes in mTrib1 expression in mouse models of early-stage human atherosclerosis markedly affect the size of developing plaques and the morphological and functional properties of plaque macrophages (Fig. 6). In summary, we have confirmed the proatherogenic impact of myeloid TRIB1 in two distinct in vivo models of human atherosclerosis.
In the experiments reported here, we provide evidence that mTrib1 transgene expression may reduce vascular cell exposure to oxLDL given that it increased the size and lipid contents of plaque- resident foam cells in two independent models of early-stage ath- erosclerosis by increasing mOLR1 expression and oxLDL uptake.
Notably, in the less hyperlipidemic of these two transgenic models, we could also discern a very strong positive correlation between plaque macrophage numbers and plasma cholesterol/LDL-C levels, implying that in early-stage atherosclerosis, mTrib1High macrophages (in marked contrast to Trib1-deficient macrophages) are uniquely equipped to increase plaque macrophage numbers in response to lipid excess and hence foam cell and fatty streak formation.
Recent studies have established that oxLDL accumulates steadily in both early-stage (growing) and mature-stage (yellow plaque without
on November 21, 2019http://advances.sciencemag.org/Downloaded from
Monocytes Macrophages
8 9 10 11 12
Expression human of TRIB1
Signal intensity (arbitrary units)
P < 0.0001
9 10 11
8.5 9.0 9.5 10.0 10.5
Monocytes
Macrophages
ns LPL
NCEH1ABHD5HADHBACA T1 PTGS1PLTP
ABCA1ABCG1LXRAPPARGLDLR
−0.5 0.0 0.5 1.0 1.5
Log2FC relative to TRIB1lowMDMs 6 × 10⁻¹¹ 0.033 2 × 10⁻¹⁴ 5 × 10⁻⁹ 2 × 10⁻⁸ 1 × 10⁻¹⁰ 2 × 10⁻²⁰ 1 × 10⁻⁹ 0.141 0.352 3 × 10⁻⁶ 0.6
Trib1
mWT
Trib1
mTg 0.0 0.5 1.0 1.5 2.0 2.5
Relative RNA levels **
Trib1
mWT
Trib1
mTg 0.0 0.5 1.0 1.5
Relative RNA levels
**
Trib1
mWT
Trib1
mTg 0.0 0.5 1.0 1.5 2.0
Relative RNA levels *
Trib1
mWT
Trib1
mTg 0 1 2 3 4
Relative RNA levels *
Orl1 Scarb1
Lpl Nceh1
Trib1mTg
IgG
Trib1mWT
OLR1
Trib1
mWT
Trib1
mTg 0 20 40 60 80
% OLR1/DAPI
*
OLR1 -Tubulin
Trib1mWT Trib1mTg
Trib1
mWT
Trib1
mTg 0.0 0.5 1.0 1.5
Densitometry (OLR1/
tubulin)
**
A B
C
D
E
F
Fig. 4. Myeloid TRIB1 induces reciprocal changes in oxLDL and HDL receptor expression in human and mouse macrophages. (A) TRIB1 RNA levels in monocytes and MDMs of CTS participants (24). Correlation (R2 < 0.001, P = 0.47) was performed on 596 paired monocyte and MDM samples. (B) MDM (n = 596) and monocytes (n = 758) were ranked according to TRIB1 RNA contents and gene expression values in the top and bottom quartiles compared. Log2 fold changes (FC) of specified RNAs in TRIB1High (n = 149) versus TRIB1Low (n = 149) MDM, with associated P values. (C) FC and P values for differential expression of RNAs encoding representative scavenger receptors, including CD36, which mediates (ox)-phospholipid and long-chain fatty acid uptake (39), the acetylated-LDL scavenging receptor (40), and macrophage scavenger receptor (40). Comparisons are between TRIB1High versus TRIB1Low MDMs and between TRIB1High (n = 191) versus TRIB1Low (n = 191) monocytes. (D) RT-qPCR quantification of RNA (mean ± SEM) in BMDM prepared from specified mice (n = 5 to 9 per group). (E) Immunocytochemistry of nonpolarized Trib1mWT and Trib1mTg BMDMs. OLR1 (red), nuclei counterstained with 4′,6-diamidino-2-phenylindole (DAPI) (blue). Scale bar, 50 m. Quantifications performed on BMDMs prepared from four to five mice per group. (F) Western blot analysis of OLR1 in Trib1mWT and Trib1mTg BMDMs (n = 3 to 5 per group). In (D) to (F), significance was determined by Student’s t test; *P < 0.05, and **P < 0.01.
on November 21, 2019http://advances.sciencemag.org/Downloaded from
Trib1
mWT
Trib1
mTg 0 2 4 6
Relative OLR1/MAC-3
*
Trib1
mWT
ApoE
−/−
Trib1
mTg
ApoE
−/−
0 1 2 3 4
Relative OLR1/MAC-3
* A
B
− +
0 50 100 150
Total cholesterol (ng/1.5 × 105 cells)(ng/1.5 × 105 cells) (ng/1.5 × 105 cells) oxLDL
**
− +
0 20 40 60 80 100
Free cholesterol
oxLDL
**
− +
0 10 20 30 40
Cholesteryl esters
oxLDL
P = 0.12
− +
0 1 2 3 4
TC/CE
Trib1mWT Trib1mTg
oxLDL
P = 0.06 Trib1mWTTrib1mTg
oxLDL
− +
− +
0 10 20 30 40
ORO-positive cells (%)
Trib1mWT Trib1mTg
*
****
oxLDL
****
− HDL
0 5 10 15
% Cholesterol efflux
Trib1mWT Trib1mTg
Trib1mWTTrib1mTg
0.0 0.5 1.0 1.52.0 2.5
Relative RNA levels
Abca1
Trib1mWTTrib1mTg
0 1 2 3 4 5
Relative RNA levels
Abcg1
C
D
DAPIMAC-3 OLR1
Trib1mTg ApoE−/−
Trib1mWT ApoE−/−
DAPIMAC-3 OLR1
Trib1mWT-PCSK9 Trib1mTg-PCSK9
Fig. 5. Myeloid-Trib1 increases ORL1 expression, cholesterol uptake, and neutral lipid accumulation. (A) Representative images (scale bars, 25 m) of aortic sinus lesions from specified mice and enlarged images. Dashed lines indicate boundaries of lesions. MAC-3 (green), OLR1 (red), and nuclei counter stained with DAPI (blue).
Arrows indicate OLR1-positive macrophages. Arrowheads indicate assumed acellular OLR1. Quantification: Trib1mWT➔ApoE−/− and Trib1mTg➔ApoE−/− chimeras, nine per group; mTrib1-PCSK9, five to six per group (mean ± SEM). (B) Intracellular total cholesterol, un esterified cholesterol, and cholesteryl ester contents of Trib1mTg and Trib1mWT bone marrow cells differentiated into macrophages and incubated with oxLDL (25 g/ml) for 24 hours (n = 4 per group). (C) Representative images of BMDMs stained with Oil Red O (scale bar, 50 m). Quantification was performed on three fields of view per sample. (D) Quantification of cholesterol efflux from cholesterol-loaded BMDMs to human HDL (n = 8 to 9 per group). RT-qPCR quantification of Abca1 and Abcg1 RNA in nonpolarized BMDMs prepared from specified mice (n = 7 to 8 per group). Data are means ± SEM. Significance determined by Student’s t test (A and D, bottom panels) or two-way ANOVA with Sidak’s multiple comparisons posttest (B to D) *P < 0.05,
**P < 0.01, and ****P < 0.001.
on November 21, 2019http://advances.sciencemag.org/Downloaded from
a necrotic core) human coronary plaques but that, in more advanced vulnerable plaques (yellow plaques with a necrotic core), this lipo- protein is removed either by metabolism or replacement with other substances, including cell debris (2). These in vivo data dovetail well
with the early in vitro work, which showed that while oxLDL pro- motes macrophage growth and survival in a dose-dependent manner, beyond a certain lipid concentration, cell death ensues, albeit by an unknown mechanism (10). Thus, a critical question to consider is whether mTRIB1-induced OLR1 expression serves an (athero-) protective role in human atherosclerosis, for example, by reducing the exposure of plaque-resident vascular cells (where this disease is initiated) to oxLDL. This lipoprotein is a well-described activator of endothelial cell OLR1 expression with the totality of the data indi- cating that this activation culminates in arterial endothelium dys- function (9). That said, the endothelium is activated by numerous factors, including blood flow, hypertension, and inflammation (25), which over the life span of an individual may attenuate (and even erase) the potential atheroprotective effect arising from an mTRIB1- mediated reduction in the exposure of endothelial cells to oxLDL.
By contrast, the effects of an mTRIB1-induced increase in OLR1 expression will directly bear on atherosclerotic disease progression.
Notably, it has been shown that mice overexpressing Olr1 on an ApoE KO background develop markedly more atherosclerosis than their nontransgenic littermates (26) and that Olr1 deficiency on an Ldlr KO background reduces the atherogenic burden conferred by 18 weeks of a 4% cholesterol/10% cocoa butter diet (27). With spe- cific reference to the macrophage component of atheromas, Schaeffer and colleagues (28) have shown that cytokine-induced up-regulation of OLR1 increased OxLDL internalization by >40%, suggesting that (in line with our data presented in fig. S5), in inflamed micro- environments, where proinflammatory cytokines are relatively abun- dant (such as in atherosclerotic lesions), increased OLR1 expression could play a substantial role in up-regulating oxLDL uptake and atheroma formation. Supporting this contention, we show here that the TRIB1-induced increase in OLR1 expression increased the uptake of oxLDL and lipid accumulation in plaque macrophages, which in vitro (10) and in vivo (9) studies have indicated, all other things being equal, will accelerate the formation of foam cells, foam cell apoptosis/necrosis, and the development of more advanced, complex lesions.
On the basis of the strong evidence of a causal link between hyper lipidemia and CHD (29) and the demonstration that ablating hepatic TRIB1 expression increased plasma levels of cholesterol, LDL-C, and triglyceride (15), the implication was, which seemed to be entirely consistent with results from genome-wide association studies (GWAS) (14), that increasing TRIB1 would be atheroprotective.
Silencing TRIB1 expression in macrophages, however, turns out to be atheroprotective, as judged by analyses of the aortas and aortic sinuses from Trib1mKO➔ApoE−/− chimeric mice, after a 12-week Western dietary regime. This counter intuitive result, which fits well with our in vitro and in vivo analysis of the consequences of mTrib1High expres- sion on foam cell expansion, suggests moving forward that developing a therapy to specifically silence Trib1 expression in macrophages would provide clinical benefit beyond that of lipid-lowering medications, although full realization of this benefit may require its adoption at an early stage of atherogenesis. More generally, our study also demon- strates that mechanistic probing of GWAS signals is not only warranted, but also critical, to identify both the totality and directionality of disease risk factors, even when, as was the case for TRIB1, the associ- ation between a genetic variant(s), disease risk and a major disease- risk factor (plasma lipids) appeared congruent. Hence, we acknowledge that a limitation of the current study is that we have not addressed whether changes in vascular cell TRIB1 expression might affect
Fig. 6. Model summarizing the proposed effects of differences in mTRIB1 expression on foam cell expansion in early-stage atherosclerosis. Factors up- regulating mTRIB1 expression in human MDMs and plaque macrophages simulta- neously increase cholesterol and neutral lipid uptake, with no compensatory rise in cholesterol efflux. Schematic recognizes that increased OLR1 expression increases the probability of this scavenger receptor assembling as a hexamer made up of three homodimers on the macrophage cell surface and that this configuration leads to a marked increase in its affinity for oxLDL (9) and hence OLR1-mediated uptake of oxLDL lipids. In the setting of no compensatory rise in HDL-mediated cholesterol efflux, accelerated foam cell expansion and increased atheroma burden ensue, highlighting the therapeutic potential of inhibiting macrophage Trib1 expression to block the gene expression changes that both promote macrophage cholesterol uptake and cholesteryl ester formation accumulation and prevent the increased hydrolysis of the accumulated cholesteryl ester and thus the up-regulation of the reverse cholesterol transport pathway to mediate the removal of cholesterol from the arterial wall.
on November 21, 2019http://advances.sciencemag.org/Downloaded from