Prognostic impact of DNA ploidy and protein
expression of enhancer of zeste homologue 2 (EZH2) in synovial sarcoma
PhD thesis
Dr. Yi-Che William Chang Chien Pathological Sciences Doctoral School
Semmelweis University
Supervisor: Dr. Zoltán Sápi M.D., Ph.D., D.Sc., professor Official reviewers:
Dr. Erika Tóth M.D., Ph.D., consultant pathologist Dr. Tamás Terebessy M.D., Ph.D., lecturer
Head of the final examination committee:
Dr. Zsuzsa Schaff M.D., Ph.D., D.Sc., professor Members of the final examination committee:
Dr. Áron Lazáry M.D., Ph.D., research and development manager Dr. Katalin Borka M.D., Ph.D., assistant professor
Budapest, 2013
2
Table of Contents
I. Introduction ... 6
I.1 Clinical findings ... 6
I.2 Pathology features ... 7
I.3 Immunophenotype and differential diagnosis... 10
I.4 Cytogenetic characteristics ... 12
I.4.1 The SYT protein functions as a transcriptional coactivator ... 12
I.4.2 The SSX proteins function as transcriptional corepressors... 13
I.4.3 The SYT-SSX fusion protein in synovial sarcoma... 14
I.4.4 Molecular biology of Enhancer of zeste homologue 2 (EZH2) ... 17
I.5 Possible origin of tumor cells ... 19
I.6 Therapeutic strategy ... 21
II. Objective ... 23
III. Materials and Methods ... 24
III.1 Clinical data, tissue specimens and microarrays ... 24
III.2 Image cytometry ... 25
III.3 Metaphase high-resolution comparative genomic hybridization ... 27
III.4 Immunohistochemistry ... 29
III.5 Scoring criteria ... 29
III.6 Analysis of EZH2 mRNA expression ... 30
III.7 Statistical analysis... 32
3
IV. Results ... 33
IV.1 Significant differences among aneuploid, simple diploid and complex diploid groups ... 33
IV.2 High expression of EZH2 and high abundance of H3K27me3 in PDSS ... 39
IV.3 EZH2 as a potential prognostic marker in synovial sarcoma ... 43
V. Discussion ... 45
V.1 Possible mechanisms of EZH2 overexpression ... 48
V.1.1 MYC is upregulated in PDSS ... 48
V.1.2 Hypoxia induced HIF1α up-regulates EZH2 ... 48
V.1.3 Translocation-associated fusion proteins up-regulate EZH2 ... 49
V.1.4 microRNA associates EZH2 overexpression ... 49
V.2 Genetic deregulation by EZH2 ... 49
V.3 EZH2 overexpression not always associates with H3K27me3 ... 51
V.3.1 Formation of Tumor-specific PRC ... 52
V.3.2 Akt-mediated inhibitory phosphorylation ... 52
V.3.3 Cyclin-dependent kinase associated regulation ... 53
VI. Conclusions ... 57
VII. Summary ... 58
VIII. Bibliography... 61
IX. Publication records ... 77
IX.1 Publications related to the theme ... 77
IX.2 Publications not related to the theme ... 78
X. Acknowledgements ... 79
4
The list of Abbreviation
BPSS, Biphasic synovial sarcoma
CDK1, cyclin dependent kinase 1
Dc, Complex dipoid
DCC, deleted in colorectal cancer
DI, DNA index
DNMT, DNA Methyltransferase
DOG-1, discovered on GIST-1
Ds, Simple diploid
DZNep, 3-deazaneplanocin
EED, embryonic ectoderm development
EGR1, early growth response 1
EZH2, Enhancer of zeste homologue 2
FFPE, formalin-fixed and paraffin embedded
FGFR2, fibroblast growth factor receptor 2
FISH, Fluorescence in situ hybridization
GIST, gastrointestinal stromal tumor
H3K27me3, Trimethyl-histone H3 (Lys27)
HAT, histone acetyltransferase
HDAC, Histone deacetylase
HR-CGH, High resolution-comparative genomic hybridization
IOD, Integrated optical density
JARID2, jumonji, AT rich interactive domain 2
KRAB, Kruppel-associated box
5
LHX4, LIM-homeobox protein
lincRNA, large interventing noncoding RNA
MPSS, Monophasic synovial sarcoma
PcG, Polycomb group
PDSS, Poorly differentiated synovial sarcoma
PRC, Polycomb repressor complex
qRT-PCR, Quantitative real time- polymerase chain reaction
SCI, single cell interpretation
SH2-binding motifs, Src homology 2 binding motif
SH3-binding motifs (Src homology 3 binding motif
siRNA, Small interfering RNA
SLI, stemline interpretation
SNH, SYT N-terminal homology
SS, Synovial sarcoma
SSXRD, SSX repressive domain
SUZ12, suppressor of zeste 12
TF, transcription factors
TLE1, transducer-like enhancer of split 1
UTR, untranslated region
VEGF, vascular endothelial growth factor
YY1, Yin-Yang 1
6
I. Introduction
I.1 Clinical findings
Synovial sarcoma, an aggressive soft tissue tumor with high rate of local recurrence and distant metastasis is currently hypothesized to originate from mesenchymal stem cells [1]. It occurs most commonly in young patients, representing about 10% of soft tissue sarcomas in all age groups and about 15-20% in adolescents. It is most prevalent in adolescents and young adults between 15 and 40 years of age with mean age of 34 years. 40% of them were under age 30 when diagnosis was made. Males are affected slightly more often than females (1.2:1). Despite the name, synovial sarcomas do not arise from or differentiate toward the synovium; they are extremely rare to be found within the joint cavities; with more than 80% of the cases arising in deep soft tissues around large joints or tendons [2]. However, any body part, including retroperitoneum, mediastinum, thoracic wall, head and neck region even visceral organs cannot be spared from this tumor indicating non-synovial origin; hence, the traditional term ‘synovial’ is a misnomer. The most common presentation is a palpable, deep-seated swelling mass with or without pain, mild movement limitation can be encountered. The clinical progression is usually slow and sometimes may be ignored the malignant nature of the tumor and consequently delay the diagnosis and therapy.
Additionally, the clinical differential diagnosis can be hematoma, arthritis or bursitis.
Few studies have reported synovial sarcoma arising from the field of previous therapeutic irradiation and the site of prosthesis implantation [3, 4]. The characteristic radiological finding is the presence of multiple small radiopacities representing calcification or, rarely, ossification which can be found approximately 15~20% of the
7
cases (Figure 1). Computed tomography can be used to assess the involvement and extension of the tumor.
Figure 1. Synovial sarcoma originating in (A) popliteal fossa and (B) plantar region with calcification [5].
I.2 Pathology features
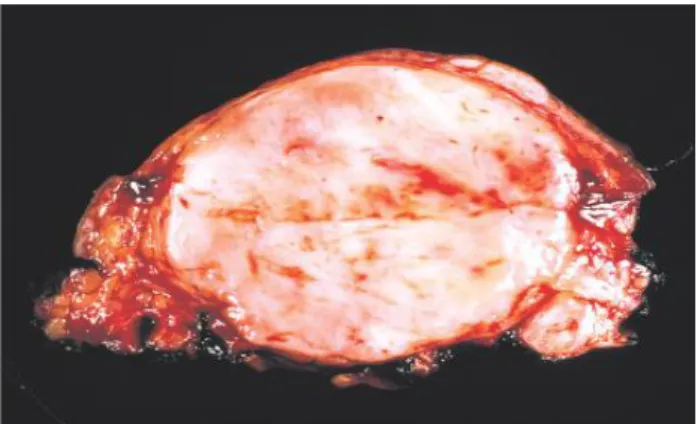
Grossly when slow growing, the lesion usually has circumscribed, lobular border with compressing the adjacent tissue. Cystic change and calcification can be found. In some cases, especially poorly differentiated subtype, fast growth can be expected, usually with fleshy, variegated surface and shaggy border; frequently with areas of hemorrhage and necrosis (Figure 2).
8
Figure 2. Gross feature of poorly differentiated synovial sarcoma with fleshy cut-surface and focal hemorrhage.
Histologically, synovial sarcomas are composed of 2 unique cellular components:
spindle cells and epithelioid cells with varying proportions. Morphologically, they can display biphasic (BPSS) monophasic (MPSS), and poorly differentiated (PDSS) patterns (Figure 3) among which, MPSS can also be divided into monophasic fibrous and monophasic epithelial, respectively representing two extremes of morphologic spectrum of BPSS.
Figure 3. Histology of (A) biphasic, (B) monophasic and (C) poorly differentiated subtypes of synovial sarcoma.
The epithelioid component can have glandular, solid and papillary pattern and the spindle component usually has fascicular configuration. The BPSS and MPSS usually show bland nuclei and scanty mitotic activity. The background can show hyalinized or myxoid changes, calcification and mast cells can be numerous. PDSS, which accounts
9
for approximately 10% of all cases, is defined by high cellularity, high nuclear grade, and high mitotic activity, as well as areas of necrosis. Its morphology is typically dominated by small round cells or rhabdoid-like cells similar to undifferentiated embryonic cells, and its clinical course tends to be aggressive with early recurrence and metastasis [2, 5].
10
I.3 Immunophenotype and differential diagnosis
Both epithelioid and focal spindle components of synovial sarcomas show cytokeratin positivity, particularly CK7 and 19; additionally EMA, BCL-2, CD99 and S-100 protein may also show focal positivity although none of them is specific. A novel marker: transducer-like enhancer of split 1 (TLE1), a member of the TLE gene family encoding a transcriptional corepressor in Wnt/ -catenin signaling pathway, which is necessary for epithelial and neuronal differentiation, has been found in gene expression profiling studies to be significantly overexpressed in synovial sarcomas [6]. In 91 out of 94 molecularly confirmed synovial sarcomas showed intranuclear positivity by immunohistochemical detection, therefore, it can serve as a useful diagnostic marker [6].
Due to its ubiquitous presence and the morphology resemblance of other much more common spindle cell tumors or carcinomas; the diagnosis of synovial sarcoma can be challenging; especially those within the retroperitoneal region and gastrointestinal tract; the differential diagnosis is wide. Mainly, gastrointestinal stromal tumor (GIST), myogenic tumors, solitary fibrous tumor, inflammatory myofibroblastic tumor, and neurogenic tumor should be considered. Probably the most important differential diagnosis is GIST, especially CD117-negative cases, since it shares morphological similarities with synovial sarcoma. Membranous or intracytoplasmic “discovered on GIST-1” (DOG-1) positivity in the former and diffuse intranuclear TLE1 positivity in the latter should tell the difference. Blunt ends and wavy nuclei with S-100 protein positivity are typical for neurogenic tumors; however, differentiating from malignant peripheral nerve sheath tumor (MPNST) can be challenging. Immunostaining for TLE1 and cytokeratin 7/19 can solve the difficult cases, since, according to the literature, the MPNST shows only focal weak TLE1 positivity instead of diffuse and strong ones seen
11
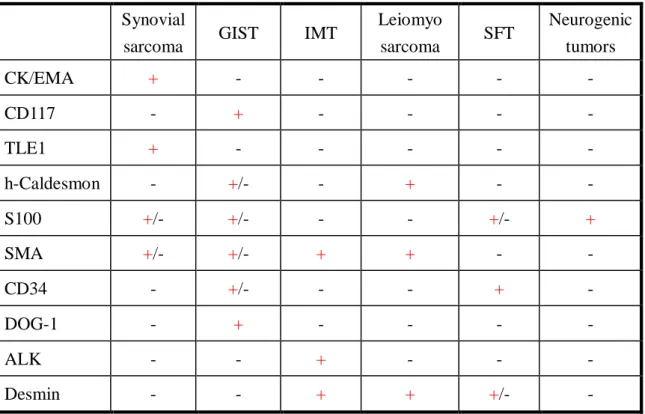
in synovial sarcoma, and it is usually cytokeratin 7/19 negative [7]. Focal area staghorn vascular structures may simulate a solitary fibrous tumor. CD34 is usually negative in synovial sarcoma. Interpreting the results with caution is important to avoid the diagnostic pitfalls, for example, mast cells within the synovial sarcoma may positively stain for CD117. The characteristic immunophenotype of these tumors is summarized in Table 1.
Table 1. Immunophenotype of the most common spindle cell tumors in the abdominal cavity.
Synovial
sarcoma GIST IMT Leiomyo
sarcoma SFT Neurogenic tumors
CK/EMA + - - - - -
CD117 - + - - - -
TLE1 + - - - - -
h-Caldesmon - +/- - + - -
S100 +/- +/- - - +/- +
SMA +/- +/- + + - -
CD34 - +/- - - + -
DOG-1 - + - - - -
ALK - - + - - -
Desmin - - + + +/- -
(GIST: gastrointestinal stromal tumor; IMT: inflammatory myofibroblastic pseudotumor; SFT: solitary fibrous tumor)
Of course exceptions occur; we have also reported a case of metastatic gastrointestinal synovial sarcoma with desmin positivity simulating myogenic tumor [8].
Therefore, the final diagnosis was established by fluorescence in situ hybridization (FISH), and real time-polymerase chain reaction (RT-PCR) to detect the tumor-specific t(X;18) translocation, which can be found in both epithelioid and spindle cell
12
components, which serve as gold standards for the confirmative diagnosis (Figure 4).
Figure 4. (a) Fluorescent in situ hybridization (FISH) contained mixture of probe labeled SYT gene. The arrows showed break apart of the gene indicating translocation. (b) Real-time PCR (RT-PCR) revealed the amplification of SYT-SSX1 gene (black), ABL gene (red) was used as internal control.
I.4 Cytogenetic characteristics
Synovial sarcoma is also a well-known “translocation-associated tumor” with characteristic balanced translocation between SSX located on chromosomes X and SYT on chromosome 18, t(X;18) (p11.2;q11.2), represented in more than 95% of the cases [9]. Due to their intranuclear locations and lack of DNA binding domains. SYT and SSX are thought to bind to other chromatin remodeling complexes or transcription factors to be transported in to nuclei where they exert their functions [10].
I.4.1 SYT protein functions as a transcriptional coactivator
The SYT gene, which is located on chromosome 18q11 and encodes a 387 amino acid protein, is ubiquitously expressed in human cells. It contains an SNH domain (SYT N-terminal homology domain) at the N-terminal region and interacts with SWI/SNF ATPase-associated chromatin remodeling complex (Figure 5) [11]. The SNH domain also interacts with transcription factors such as AF10, ATF2, histone acetyltransferase p300, and also histone deacetylase compressor SIN3A [12]. Their interactions with
13
SNH domain are mutually exclusive. However, the transcription factor such as AF10 alone can also directly interacts with SWI/SNF chromatin remodeling complex [13].
Therefore SYT, together with DNA binding proteins such as AF10, may exert its transcriptional coactivator function epigenetically through the recruitment of chromatin modification complexes such as SWI/SNF.
Additionally, the SYT gene also contains three SH2-binding motifs (Src homology 2 binding motif), one SH3-binding motif (Src homology 3 binding motif), and a C-terminal QPGY domain rich in glutamine, proline, glycine, and tyrosine [14]. The SH2-and SH3-binding motifs are thought to mediate protein-protein interactions in signal transduction whereas the QPGY domain was responsible for transcriptional activation [15].
I.4.2 SSX protein functions as transcriptional corepressor
In contrast to SYT gene, which is expressed ubiquitously, members of the SSX gene family, are immunogenic antigens expressed in testis and many malignant tumors, hence the name ‘‘cancer testis antigen”; although they can also been found in thyroid glands in low level as well [16].
The N-terminus of all SSX proteins exhibits extensive homology to the so-called
“Kruppel-associated box” (KRAB) (Figure 5) which is involved in transcriptional repression [17]. In the C-terminus locates a stronger suppressive “SSX repression domain” (SSXRD) which shows high similarity across the SSX family [18]; while the 44 amino acid region immediately upstream of SSXRD exhibits high degree of diversity among the SSX family called divergent domain (DD) [18]. The SSXRD interacts with LIM-homeobox protein (LHX4), a transcription protein, and polycomb group complex (PcG) [19]. Therefore SSX, together with DNA binding proteins such as LHX4, may
14
exert its transcriptional corepressor function epigenetically through the recruitment of PcG-related chromatin modifiers.
I.4.3 SYT-SSX fusion protein in synovial sarcoma
The translocation juxtaposes the 5-SYT (N-terminal) gene from chromosome 18 to either of three highly homologous genes at Xp11: 3-SSX1, 3-SSX2 or, rarely, 3-SSX4 (C-terminal) [20, 21]. From a large sample analysis for the presence of SYT-SSX fusion; two thirds revealed an SYT-SSX1 fusion and one third an SYT-SSX2 [9] and only few cases showed SYT-SSX4 [22]. Since the SSX gene family encompasses at least 9 members, encoding 188 amino acid proteins with high degree of sequences homologies; the preference of SSX1, SSX2 and SSX4 fusion, instead of other members may due to not only the genomic architectural differences, but also the transforming potential of the encoded proteins [10, 23, 24].
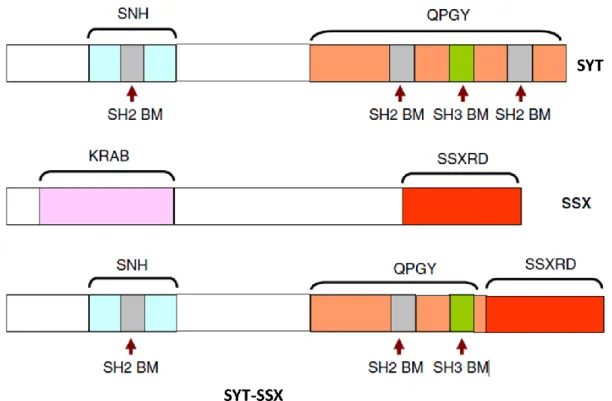
The SYT-SSX fusion protein, which retains almost the entire SYT including entire SNH and most part QPGY domains, except the last eight amino acids, which are replaced by the last 78 amino acids of SSX containing SSXRD domain (Figure 5).
15
Figure 5. Proteins involved in synovial sarcoma t(X;18) translocation: the SYT-SSX fusion protein, which retains almost the entire (5-end) SYT except the last eight amino acids, which are replaced by the last 78 amino acids of SSX (3-end). (SNH: SYT N-terminal homology domain; QPGY: glutamine-, proline-, glycine-, and tyrosine-rich domain; SH2 BM: Src homology 2 binding motif; SH3 BM : Src homology 3 binding motif; KRAB: Kruppel-associated box; SSXRD: SSX repression domain) [25].
Due to their intranuclear localization and lack of a chromatin binding domain in both SYT and SSX proteins, this chimeric protein is thought to function as a transcriptional regulator modifying gene expression by associating with sequence-specific DNA-binding proteins mentioned before [9]. The predicted outcome is general alteration of cellular programming, both activation and silencing of target genes, once SYT-SSX is expressed. The bone marrow-derived mesenchymal stem cells and myoblasts transduced with SYT-SSX fusion gene showed high degree similarity of gene expression profiles with the synovial sarcoma cells such as fgfr2, a major inducer of neurogenesis during development [26] and knockdown of this gene abrogated the
16
growth in both transduced mesenchymal stem cells and synovial sarcoma cells and attenuated their neuronal phenotypes revealing the persistent effect of SYT-SSX function throughout the life of cancer [27].
Early literature has demonstrated that constitutive expression of human SYT-SSX1 fusion gene in mouse fibroblast promoted growth rate in cell culture, increased anchorage-independent growth in soft agar, and formation of tumors with appearance similar to human synovial sarcoma when injected the transformed fibroblasts into nude mice indicated the oncogenic nature of SYT-SSX fusion protein although its oncogenic activity was reported to be much weaker compared with other traditional oncogene such as RAS [16]. Furthermore, lack of the N-terminal 181 amino acids of the fusion protein and overexpression of wild-type SYT alone were both fail to induce transformation in culture also imply that both SYT- and SSX- derived regions are needed for transformation [16]. It has also been shown that SYT-SSX fusion protein may suppress tumor suppressor genes such as DCC and EGR1 which may partly contribute to the ongogenesis [16, 22]. It is widely accepted SYT-SSX fusion protein exerts its oncogenic property by epigenetically deregulating the target gene expression within the nucleus.
Several studies using microarray-based transcriptional profiling and immunologic detection have revealed several possible target genes overexpressed as mRNA and protein levels by the fusion protein including growth factor such as IGF2 [28], growth factor receptors, components regulating cycle and survival such as Cyclin D1, BCL-2, EGFR, TLE and Her-2/neu and many others [29-32]. It has been documented that the SYT-SSX fusion protein up-regulated cyclin D1 protein level by inhibiting ubiquitin-dependent degradation and promoted proliferation [31]. However, the whole picture for the detailed molecular pathway deregulation is still under investigation.
17
I.4.4 Molecular biology of Enhancer of zeste homologue 2 (EZH2)
EZH2 is a member of the polycomb group (PcG) protein family which consists of epigenetic transcriptional repressors participating in cell cycle regulation, DNA damage repair, cell differentiation, senescence, and apoptosis [33].
PcG family members are arranged into multimeric polycomb repressive complexes (PRC), PRC1 and PRC2. EZH2 interacts with other units, “embryonic ectoderm development” (EED) and “suppressor of zeste 12” (SUZ12) to be functionally active and serve as the core members and catalytic units of PRC2. EZH2 acts as a histone methyltransferase through its SET domain and targeting the N-terminal tail of histone 3 and producing a characteristic trimethylated H3-Lys27 (H3K27me3) mark. It shows high expression in cells possessing embryonic gene expression signature, while its amount declines through maturation and differentiation [34, 35].
PRC2 can be recruited to the binding site of the target genes by PRC-associated transcription factors (e,g, YY1), DNA binding proteins (e.g. Jarid2), lincRNA or direct interaction with short transcripts produced from CpG islands [36-39]. H3K27me3 produced by PRC2 is recognized by PRC1 which, in turn, monoubiquitylates lysine 119 of histone H2A to prevent RNA polymerase II-dependent transcriptional elongation and lead to silencing of the downstream genes. However, recent data revealed a more complex mechanism of gene repression that PRC1 and PRC2 share similar but not entirely overlapping patterns of gene occupancy [40, 41], indicating a possibility of PRC2-independent PRC1 recruitment and gene repression.
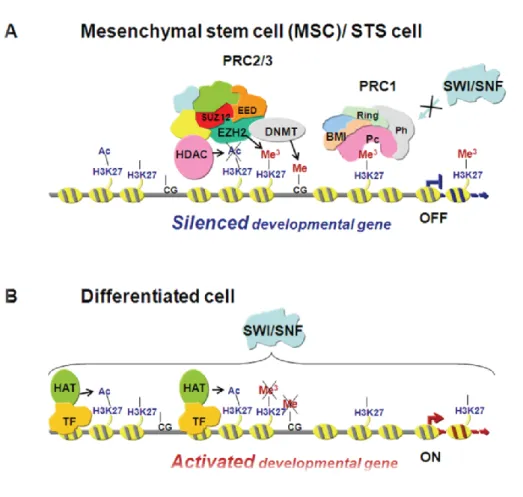
PRC2 also interacts with other repressive epigenetic modifiers such as histone deacetylases (HDAC) and DNA methyltransferases (DNMT), which further promote chromatin condensation. (Figure 6) [42-44].
18
Figure 6. Schematic representation of transcriptional gene repression by EZH2. (A) EZH2 interacts with SUZ12 and EED in the initiation of gene repression. During differentiation (B) the expression of EZH2 decreases and H3K27 becomes hypomethylated and the SWI/SNF complex facilitates the binding of tissue specific transcription factors (TF) and histone acetyltransferase (HAT) to allow initiation of transcription [35].
PcG regulation is also well known to be involved not only in the maintenance of stem cell signature, but also in tumor development [33]. In mouse model; induced- overexpression of EZH2 in mammary epithelial cells may lead to epithelial hyperplasia [45]. Abnormal overexpression of EZH2 has been reported in a wide variety of tumor types including carcinomas, lymphomas, cutaneous melanoma, and soft tissue sarcomas [46]. Recent literature has been proved EZH2 is a useful auxiliary marker to discriminate between benign and malignant liver tumors [47]. High expression of EZH2
19
is generally associated with advanced stages of tumor progression, aggressive tumor behavior, and dismal clinical outcome [42]. Intriguing hypotheses have recently been formulated on the collaboration between EZH2 and SYT-SSX. Among which, SYT has been described to interact with transcription-enhancing trithorax group proteins such as the SWI/SNF chromatin remodeling complexes via its SNH domain, while SSX has been shown to bind with the transcription-silencing PcG proteins such as EZH2 via its SSXRD domain. SYT-SSX is hypothesized to bring together these oppositely acting protein complexes, allowing each to exert their function, causing genetic deregulation and contributing to sarcomagenesis [10, 22]. Interestingly; the binding of PRC1 hinders the access of other chromatin remodeling complexes such as SWI/SNF, that may have transcription-enhancing functions (Figure 6) [48], which implies, at least partly, that out of the antagonistic partners of SYT-SSX in synovial sarcoma, PcG may ultimately dominate over SWI/SNF [22, 35]. On the other hand, recent literature also indicates that SWI/SNF can also oppose the evict PcG [23, 24] implying the controversial underlying biochemical mechanisms. Identification of possible target genes influenced by this epigenetic deregulation has begun, but much effort is still needed to elucidate the pathomechanism in full detail [49].
I.5 Possible origin of tumor cells
Due to the uncertainty of its origin; synovial sarcoma is still among category of so-called “tumors of uncertain differentiation” in the latest edition of “World Health Organization Classification of Tumors” [2].
Research has found that synovial sarcoma cells possessed stem cell-like traits expressing stem cell-associated genes such as Sox2, Oct4, Nanog, they formed sarcospheres during cell culture and the abilities to differentiate into osteocytes and
20
chondrocytes [1]. After silencing the expression by small interrupting RNA, the sarcospheres become adherent monolayer; they also showed later mesenchymal lineage-specific genes (e.g. Sox9, Runx-2 and PPARγ)and adipose tissue differentiation indicating synovial sarcoma may be a mesenchymal stem cell tumor [1]. Expression of SYT-SSX fusion gene in bone marrow-derived mesenchymal stem cells showed not only
up-regulation of genes related to neuronal development but also disrupted its normal differentiation such as adipogenesis [1, 27, 32] implying the fusion protein may exert certain degree of pressure toward neuronal differentiation in mesenchymal stem cells and induces oncogenesis through stimulation of lineage commitment and simultaneous prevention of terminal differentiation.
In transgenic mouse model; tumor developed mimicking synovial sarcoma in myoblasts but not in more differentiated myocytes when transduced and expressed SYT-SSX fusion gene [50]. All these indicate that distinct cell populations at different
developmental stages in the mesenchymal lineage hierarchy may serve as the cell of origin for synovial sarcomas.
The recent gene expression profiling study comparing human pluripotent stem cell and human mesenchymal stem cell induced by SYT-SSX revealed striking differences;
the former showed mainly up-regulated genes and the later both up- and down- regulated genes could be observed and only less than half of the up-regulated genes were overlapping between these two groups indicating the cell context is important in synovial sarcoma tumor biology [51].
At the present moment, only mouse model showed weakly transforming activity of the fusion gene [16]; no fusion gene-based model of synovial sarcoma has been established so far using human mesenchymal stem cells [32, 52]. It is possible that mouse mesenchymal cells in culture are prone to have auto-transformation or the
21
microenvironment may also plays a role in vivo [52]. Since the fusion gene in soft tissue sarcomas mostly disrupts differentiation, the “2nd-hit” is expected to target the genes involved in proliferation and apoptosis checkpoints such as p53 [53]. Hence, it is possible that the expression of SYT-SSX fusion genes in human mesenchymal stem cells per se is insufficient for synovial sarcoma initiation and secondary oncogenic hits will be needed to achieve the full transformation [52, 54]. This hypothesis is further supported by the overexpression of MDM2, CDK4 and suppression of INK4/ARF, Bim are commonly found in synovial sarcomas [5, 27, 55].
I.6 Therapeutic strategy
Surgery remains the gold standard for synovial sarcoma management. Wide surgical excision with margins of 1 cm or more or margins involving fascia is crucial for local control of the tumor, for the tumors located at the extremity; limb-sparing procedures are preferred to amputation for the functional consideration. When the tumor is located in the large joints where wide excision is not achievable, adjunctive radiotherapy can be applied additional to local excision [56]. Synovial sarcoma is a relatively chemosensitive tumor. As to the other soft tissue tumors, only two chemotherapeutic agents, doxorubicin and ifosfamide showed complete or partial response [57-59].
Doxorubicin, the drug used in standard single agent chemotherapy protocols for the treatment results in only up to 25% response rates. Together with the ifosfamide, has not dramatically improved the overall 5-year survival rate higher than 50% [60].
Nevertheless, chemotherapy is still the choice for palliation for patients with metastases to improve the life qualities. Since the fusion protein-induced genetic deregulation plays a main role in synovial sarcoma. A charming aspect is the potential usage of target
22
therapy; with or without chemotherapy to maximize the treatment effect. This will be described more detail in the discussion session.
23
II. Objectives
Since synovial sarcomas are invariably high-grade tumors with 5-year overall survival rate varied between 36 to 76% depending on relatively poorly-defined criteria such as age, tumor size, mitoses, proportion of poorly differentiated areas and the resectability of tumors [5]. It has also been documented that aneuploidy DNA content is associated with adverse clinical course; however, it only explained partly since the majority (67%) of the cases was diploid which also plays a role in the prognostic variability [61]. In the other hand, regarding the karyotype, some research groups found tumors with complex karyotype had dismal clinical outcome whereas the others found no differences [55, 62].
Furthermore, although it is well documented that high EZH2 expression was shown to be generally associated with poor prognosis in soft tissue sarcomas [63], neither differential expression of EZH2 in the various histological subtypes of synovial sarcoma nor the association of EZH2 with H3K27me3, tumor behavior, and clinical parameters has been investigated in this particular tumor type in the recent literatures. Therefore, the goals of our project are as follow:
1. To investigate the DNA ploidy using image cytometry with fine-tune interpretation and correlates the result with high-resolution comparative genomic hybridization (HR-CGH) and clinical outcome.
2. To investigate the utility of EZH2 as a diagnostic marker in synovial sarcomas by comparing its expression (both in mRNA and protein levels) cross the histological subtypes, the molecular features and clinical data.
3. To elucidate the functional correlation between EZH2 and its epigenetic mark, H3K27me3.
24
4. To investigate the impact of EZH2 expression, along with H3K27me3 and Ki-67, on overall survival based on Kaplan-Meier curve.
III. Materials and Methods
III.1 Clinical data, tissue specimens and microarray
Fifty-five synovial sarcoma cases were selected for our study including 6 PDSS, 39 MPSS, and 10 BPSS fixed in 10% formalin and embedded in paraffin. From these, 9 cases fresh frozen samples containing 2 PDSS, 4 MPSS and 3 BPSS were also available for HR-CGH analysis. Tumor tissues were selected from the archives of the 1st Department of Pathology and Experimental Cancer Research, Semmelweis University, Budapest, Hungary, from the years between 1996 and 2009, and sampled by an expert soft tissue pathologist (Z.S.). Only primary tumors without preoperative chemo- or radiotherapy were chosen to avoid the post-therapeutic immunophenotypic changes.
Clinical data (age, gender, tumor location, tumor size, presence or absence of metastases and the type of the fusion gene) were obtained from the institutional records. The numbers of male and female patients were 31 and 24, respectively. Age younger than 25 years was recorded in 8 cases, while 47 patients were older than 25 years. The mean age was 47 (range, 18-79). The tumor was located on the periphery in 39 cases and centrally in 16 cases. Tumors were larger than 5 cm in 14 cases. Distant metastasis was present in 31 cases. There were 35 cases associated with SYT-SSX1 fusion gene and 20 cases with SYT-SSX2 (Table 2). All patients’ information was coded, with complete clinical data available only for physicians involved in the treatment of these patients. The researches were conducted in concordance with the institutional ethical guidelines. Pathological diagnoses were made according to the World Health Organization (WHO) classification
25
[2], and confirmed by either FISH or RT-PCR for the fusion genes. Clinical follow-up data were also available for 32 cases (time after operation: 8-162 months). We used the same samples to construct tissue microarrays (TMAs) containing duplicates of 6-mm cores. In the specimens selected for HR-CGH analysis, the proportion of tumor cells were estimated after hematoxylin-eosin staining of tissue sections preceding to DNA extraction to assure in all cases the tumor cells comprised at least 85% of the total tissue areas.
III.2 Image cytometry
DNA smear for image cytometry was performed on 55 synovial sarcoma cases.
From the formalin-fixed and paraffin-embedded (FFPE) samples, the nuclei were isolated before the smears were prepared. Three 50μm sections were cut from each paraffin block. The sections were deparaffinized in xylene and rehydrated in a series of decreasing concentration of ethanol. The tissue was digested in Carlsberg’s solution (0, 1% Sigma protease XXIV; 0,1M Tris buffer; 0, 07M NaCl; pH 7, 2) for 45 min at 37°C in thermomixer. After filtration, the nuclear extract was washed in distilled water, the nuclei were fixed in 70% ethanol and dropped on glass slide to prepare a smear. We used DNA staining kit acc. (Merck, Darmstadt, Germany) for the Feulgen stain, consisting of applying HCl to the isolated nuclei for 10 minutes in a water bath and transferred into Schiff's reagent at room temperature for at least 50 minutes and then squashed in acetocarmine. DNA image data processing was carried out using a regular microscope with an image–sensing scanner connected to a regular personal computer with dedicated software installed (CYDOK R, Fa. Hilgers, Königswinter, Germany).
40x objective and an interference filter (565±10nm) were used. We used lymphocytes and granulocytes as reference cells. The tumor and reference cells were differentiated
26
based on their shape, size and the nuclear stain, respectively. At least 30 reference cells and 200 diagnostic tumor cells were analyzed on each smear. The integrated optical density (IOD) of Feulgen-stained reference cells was used as an internal standard for the normal diploid DNA content and it was also used to rescale into c-values. A diploid cell presents with a DNA amount of 2c, meaning two complements of each chromosome; a tetraploid cell contains four chromosomes of each number (4c), respectively. To define the aneuploidy we used the interpretations introduced by Haroske et al. [64]. The identification of DNA-aneuploidy can be confirmed by two fundamental procedures:
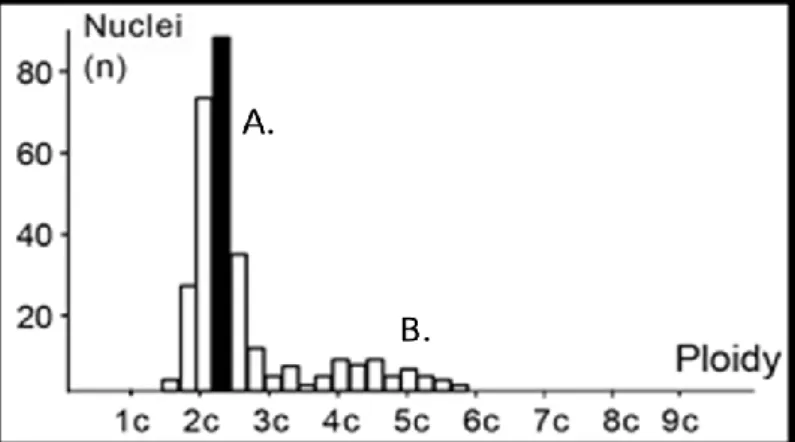
stemline interpretation (SLI) and single cell interpretation (SCI). Ploidy grade (highest peak of DNA histogram) of the stemlines characterizes the method of SLI whereas cells with a DNA amount of more than 5c as limiting value (5c exceeding events) are recorded by SCI (Figure 7). A DNA index (DI) is given for the stemlines based on the modal DNA amount of cell cycle during the G1 phase [65].
Figure 7. Illustration of histogram with stemline (A) and single cell (B) interpretations.
DNA aneuploidy is assumed when cells with a DNA content more than 2 times of G1 phase of the reference cell fraction are detected. In tissues without polyploidization, 5c-exceeding events are sufficient for classification. The coefficient of variation of the reference cells was between 3% and 5%. Having measured the reference and tumor cells
27
separately; image analysis histograms were generated. DI of 1 corresponds to the 2c diploid DNA content. Between DI of 0.9 and 1.1 (range between 1.8 and 2.2 for c-value) the sample is considered to be diploid. Outside this range the tumor is regarded as aneuploid. For the diploid group, we further stratified as “Simple Diploid (Ds)” without 5c exceeding events and “Complex Diploid (Dc)” in which tumor had a diploid stemline but contained any cell among 5c exceeding events by SCI method.
III.3 Metaphase high-resolution comparative genomic hybridization
We had 9 cases of synovial sarcoma, with fresh frozen tissue samples, available for HR-CGH analysis. DNA was extracted with a standard salting out method according to Miller et al. [66]. Hybridization was performed based on the standard protocol [67].
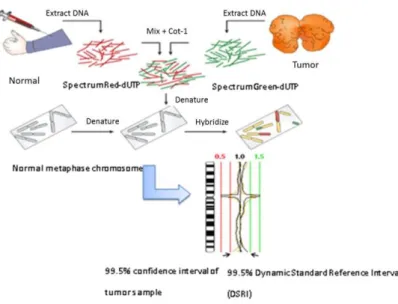
Briefly, sex-matched normal and tumor DNAs were labeled with SpectrumRed-dUTP and SpectrumGreen-dUTP, respectively, by using nick translation kit (Vysis, Downers Grove, IL, USA). Hybridization was performed in a moist chamber at 37°C for 3 days in the presence of an access of unlabeled Human Cot-1 DNA (Vysis) to suppress repetitive DNA sequences. The metaphases were captured with epifluorescence microscope (Nikon Eclipse E600) equipped with a monochrome CCD camera, and were analyzed using LUCIA CGH-Advanced Statistics 1.5.0 software (Laboratory Imaging Ltd, Prague, Czech Republic). At least 15 karyotypes were analyzed in each case. Ratio profiles were evaluated by Dynamic Standard Reference Interval (DSRI) based on an average of CGH analyses using 16 normal DNAs instead of conventionally fixed thresholds. The gains and losses were detected by comparing the 99.5%
confidence interval of the mean ratio profiles of the test samples with the 99.5% DSRI (Figure 8) [68].
28
Figure 8. Illustration of HR-CGH (Modified from figure of HR-CGH note, Chromosome Laboratory, Copenhagen, Denmark)
Negative and positive controls were included in each experiment as well. Two differentially labeled DNAs (normal test and normal reference) hybridized together served as a negative control. Positive control was created from the specimens with a known trisomy 21, and partial deletion of chromosome 17, del(17)(p13).
Heterochromatic regions in the centromeric and paracentromeric areas of the chromosomes, the short arm of the acrocentric chromosomes, and the Y heterochromatic as well as telomeric regions were excluded for the evaluation in order to decrease the background noise, and increase the diagnostic threshold as well as the accuracy.
29
III.4 Immunohistochemistry
After preparing 4-µm sections from the formalin-fixed, paraffin-embedded TMAs, sections were deparaffinized in xylene and rehydrated in a descending ethanol series.
Antigen retrieval was achieved by using either Bond Epitope Retrieval Solution 1 (pH~6) or Bond Epitope Retrieval Solution 2 (pH~9) (Leica Microsystems, Wetzlar, Germany) at 99–100°C for 20–30 minutes. Monoclonal mouse anti-EZH2 (1:25, clone 11, BD Biosciences, USA), monoclonal rabbit anti-trimethyl-Histone H3 Lys27 (1:200, clone C36B11, Cell Signaling Technology, USA), and monoclonal mouse anti-Ki-67 (1:50, clone MIB-1; Dako, Denmark) antibodies were applied on the slides.
Immunohistochemical staining was performed on a Leica BOND-MAX™ autostainer (Leica Microsystems, Berlin, Germany), and peroxidase/DAB Bond™ Polymer Refine Detection System (Leica Microsystems) was used for visualization.
III.5 Scoring criteria
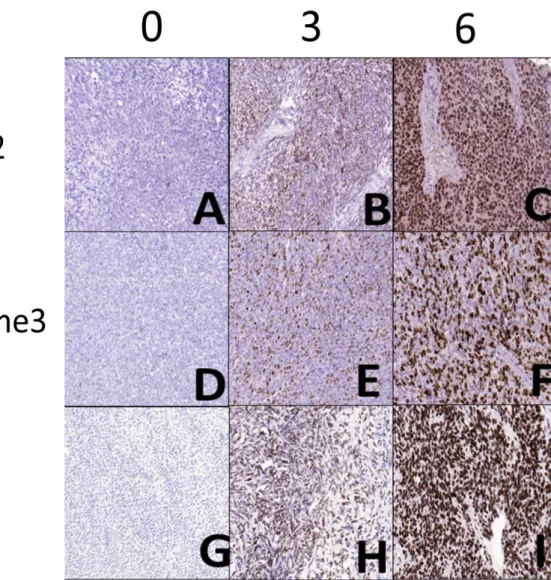
To assess the immunohistochemical labeling of EZH2, H3K27me3, and Ki-67, immunostained slides were evaluated under a 10x magnification objective. “Nuclear staining intensity” was scored as follows: 0, no visible staining; 1, weak; 2, moderate; 3, strong. Higher score was chosen if at least 30% of positive tumor cells showed stronger intensity.
To quantify the “extent” of immunostaining, the percentage of tumor cells with positive nuclear reaction was counted, and a score was assigned as follows: 0, no visible staining; 1, 1–50%; 2, 51–75%; 3, over 75%. Each core contained at least 100 tumor cells to be evaluated. The two scores were summed to yield a final score ranging from 0 to 6. Fields of view representative of scores 0, 3, and 6 are shown in Figure 9. A total score ≤ 3 was defined as low and ≥ 4 as high.
30
Figure 9. Photomicrographs representing the scores 0, 3, and 6 for EZH2 (A, B and C), H3K27me3 (D, E and F), and Ki-67 (G, H and I) immunostaning.
III.6 Analysis of EZH2 mRNA expression
For EZH2 gene expression analysis, total RNA was isolated from formalin-fixed, paraffin-embedded blocks of synovial sarcoma tissue by using RecoverAll™ Total Nucleic Acid Isolation Kit (Ambion, Austin, USA) based on manufacturer’s instruction.
Briefly; after deparaffinization, protease was added with digestion buffer and incubated in 70〬C for 30 minutes followed by nucleic acid isolation by adding isolation additive followed by sequence of centrifugation and washing procedure. DNase was added and
31
followed by washing procedure. The RNA was eluted by adding elution solution at room temperature. Due to the RNA degradation, the quality of isolated RNA was adequate for gene expression analysis in 13 MPSS, 2 BPSS and 6 BPSS cases. cDNA was generated from 1 µg of total RNA using High Capacity cDNA Reverse Transcription Kit (Applied Biosystems, Foster City, USA), following the instructions of the supplier. Quantitative real-time PCR (qRT-PCR) was performed in a LightCycler 480 Real-Time PCR System (Roche Applied Science, Indianapolis, USA) by using ABI TaqMan Gene Expression Assay for human EZH2 gene (assay ID:
Hs01016789_m1; Applied Biosystems) according to the manufacturer’s protocol. The expression of EZH2 was normalized to endogenous human ribosomal protein S18 (assay ID: Hs02387368_g1; Applied Biosystems), and cDNA from lymph node served as calibrator. Results were obtained as “crossing point (Cp)” values. Expression levels were calculated by using the 2-ΔΔCp method.
32
III.7 Statistical analysis
Prism 4 software (GraphPad, USA), SigmaPlot and SigmaStat software packages (SPSS, version 11.0, IBM, USA) and the VassarStats website (www.vassarstats.net) were used for statistical analyses. Fisher’s exact test was used to examine whether the aneuploidy, complex diploid and simple diploid groups, regarding the prognosis, were significantly different. On the other hand, in order to compare the immunohistochemical scores of EZH2, H3K27me3 and Ki-67, Kruskal-Wallis test was used for the comparison of more than two groups, while pairwise comparison of non-Gaussian data sets was done by the Mann-Whitney test. Correlations were analyzed by the Spearman’s rank order correlation test (Spearman's rho, ρ) and coefficient of determination (R2). Kaplan-Meier curves were created based on the duration of survival after operation, and groups were compared with univariate analysis using the log-rank test. For all analyses, P values <0.05 were considered as statistically significant.
33
IV. Results
IV.1 Significant differences among aneuploid, simple diploid and complex diploid groups
The results of immunostaining and image cytometry are summarized in Table 2.
From our 55 synovial sarcoma cases; 10 cases (17.9%) were aneuploid by image cytometry, and the mean DI was 1.40 (Figure 10). Among those; all six cases of PDSS were found aneuploid.
34
(gender: M: male; F: female; size: 0, <5cm; 1, ≥5cm; location: P, peripheral; C: central; end point: 1, deceased; 0, alive at the indicated time point (months post-operatively.);
A: aneuploid; Ds: simple diploid; Dc: complex diploid; NA: data not available.)
Sample ID Gender Age Size Location Subtype SSX DNA index Histogram EZH2 total score H3 total score Ki67 total score metastasis 2-ΔΔCp Follow up (month) End Point
1 M 30 0 P biphasic 1 1,08 Dc 0 0 0 no 0,15 162 0
2 M 37 1 P poorly differentiated 1 1,15 A 6 5 5 yes 2,53 12 1
3 F 35 1 P poorly differentiated 2 1,21 A 6 6 6 yes 1,11 8 1
4 M 66 0 P monophasic 2 0,96 Dc 2 2 0 no 0,18 NA NA
5 F 60 0 P monophasic 1 0,96 Dc 2 3 2 yes 0,36 NA NA
6 M 35 0 P monophasic 1 0,93 Ds 2 2 2 no 0,34 65 1
7 M 52 NA P monophasic 2 1,07 Ds 3 2 3 yes 0,35 60 0
8 M 79 0 P biphasic 1 0,95 Ds 4 4 4 yes NA 84 1
9 F 65 NA C monophasic 1 1 Ds 3 3 3 no NA NA NA
10 M 52 0 P poorly differentiated 2 1,64 A 5 6 5 yes 2,51 53 1
11 F 51 0 P monophasic 2 0,95 Ds 0 0 0 no 1,11 132 0
12 M 43 NA C monophasic 1 0,91 Ds 2 3 0 no NA NA NA
13 M 59 NA C monophasic 1 1,26 A 2 0 2 no NA NA NA
14 M 52 1 P monophasic 1 1,34 A 2 2 0 no 0 48 1
15 F 78 NA P monophasic 1 1,01 Ds 3 0 3 yes NA NA NA
16 F 21 0 P biphasic 1 1,06 Ds 2 2 3 yes 0 72 1
17 F 39 NA P monophasic 2 0,96 Ds 3 2 3 no NA NA NA
18 F 39 NA P monophasic 2 0,92 Ds 3 3 3 no NA NA NA
19 F 22 NA C biphasic 1 0,93 Ds 2 2 2 no 0 NA NA
20 M 52 0 C monophasic 1 0,97 Ds 3 2 2 yes NA NA NA
21 F 54 NA P monophasic 1 1 Ds 2 2 2 yes NA NA NA
22 M 46 1 P monophasic 2 0,98 Ds 3 2 1 no 0,68 18 1
23 M 68 NA P monophasic 2 0,96 Ds 0 2 1 no 0 74 0
24 F 36 NA P monophasic 1 0,93 Ds 2 3 3 yes NA NA NA
25 F 70 0 C monophasic 1 1,05 Ds 2 2 2 yes 0,46 NA NA
26 M 44 0 C monophasic 1 1,04 A 2 2 2 yes NA 36 0
27 M 52 0 P monophasic 1 0,98 Ds 0 0 1 no 0,08 39 0
28 M 44 0 P biphasic 1 1,19 Ds 2 2 1 no NA NA NA
29 M 31 1 P poorly differentiated 2 1,85 A 5 4 4 yes 0,56 22 1
30 F 74 0 C monophasic 2 0,95 Ds 0 2 0 no 0 72 0
31 F 66 0 C monophasic 2 0,94 Ds 2 2 3 no NA 60 0
32 F 24 1 C monophasic 2 0,9 Ds 2 2 0 yes NA 36 0
33 M 18 0 P monophasic 1 1,09 Ds 2 2 2 no NA 55 0
34 M 18 0 P monophasic 1 0,92 Ds 2 2 0 no NA 46 0
35 M 27 1 P monophasic 2 0,97 Ds 2 2 0 no NA 72 0
36 F 64 0 C monophasic 2 0,99 Ds 2 2 0 no NA 75 0
37 F 29 NA C biphasic 1 0,99 Ds 2 2 2 no NA NA NA
38 F 29 NA P biphasic 1 1 Dc 4 3 0 yes NA NA NA
39 F 36 NA P biphasic 1 1,08 Dc 3 3 0 yes NA NA NA
40 F 36 0 P biphasic 1 1,07 Dc 2 2 0 yes NA 61 1
41 M 44 NA C monophasic 1 1,04 Dc 2 3 2 yes NA NA NA
42 M 29 1 P poorly differentiated 1 1,17 A 6 6 5 yes 5,68 30 1
43 F 41 1 P biphasic 1 1,03 Dc 4 4 4 no NA 48 0
44 M 61 0 P monophasic 1 0,95 Dc 3 4 3 no NA 47 0
45 M 18 NA P monophasic 1 0,95 Ds 4 4 2 yes NA NA NA
46 F 42 1 C monophasic 2 1,02 Ds 4 3 2 yes NA 33 0
47 M 19 NA C monophasic 1 0,95 Ds 3 3 3 no NA NA NA
48 M 19 NA P monophasic 1 0,92 Ds 5 5 2 yes NA NA NA
49 M 33 1 P monophasic 2 1,03 Ds 4 2 3 no NA 48 0
50 M 65 1 C poorly differentiated 1 1,51 A 6 5 5 yes 2,12 15 1
51 M 65 0 P monophasic 1 1,6 A 3 3 3 yes NA 24 0
52 M 54 NA P monophasic 2 1,02 Ds 4 3 2 yes NA NA NA
53 F 75 0 P monophasic 1 0,95 Dc 3 2 3 yes 0,77 NA NA
54 M 67 1 P monophasic 2 0,94 Dc 4 2 2 no NA 36 0
55 F 55 1 P monophasic 2 1,03 Dc 3 2 3 no NA 24 0
35
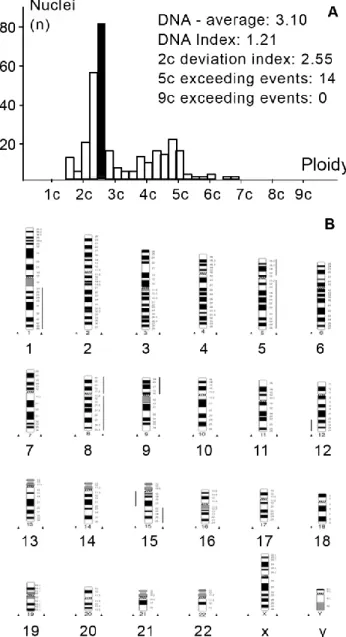
Figure 10. Representative DNA histogram (A) and HR-CGH ideogram (B) of aneuploid synovial sarcoma (case 2). Aneuploid tumor with a complex gain (1q, +5, +8, 9p, 12p13-q22, 15q22-26) and loss (12q23-24, 15q11.2-21) of DNA content. DNA index was found to be 1.21. The lines at the right of the chromosome ideogram represent DNA gains, lines at the left, DNA losses.
The histogram of the other 45 cases (82.1%) represented diploid tumor with 0.99 mean DI. Fine-tuned analysis was performed on this group according to the 5c exceeding events which represent single cell aneuploidy.
Thirty-three cases (71.7% of total diploid cases) without 5c exceeding events were considered as simple diploid (Figure 11).
36
Figure 11. Representative DNA histogram (A) and HR-CGH ideogram (B) of a simple diploid synovial sarcoma (case 6). Note there is no cell above the 5c value and there is no alteration concerning the CGH results.
Twelve cases (28.3% of total diploid cases) fell into the complex diploid group containing 5c exceeding events any number (Figure 12).
37
Figure 12. Representative DNA histogram (A) and HR-CGH ideogram (B) of a complex diploid synovial sarcoma (case 4). Though the tumor possesses diploid stemline; 8 cells proved to be above the 5c value. CGH revealed the gain of chromosomes 4 and 9.
It is important to know that only aberrations that are present in a high proportion among tumor cells can be detected by CGH. If the normal cell content is more than 50% of the tumor specimen, the evaluation may be difficult. Thus, the evaluation and selection of representative tumor material are crucial for the appropriate evaluation of CGH. The average tumor cell concentration in our cases was at least 85% (range from
38
85% to 100%).
HR-CGH analysis revealed chromosome imbalances in 5 out of the 9 (55.5%, 2 and 3 cases with aneuploidy and complex diploid DNA content, respectively) cases; in the other 4 cases, which showed simple diploid DNA content, neither chromosomal gains nor losses were found. The chromosomal imbalances found are listed in Table 3.
The aneuploid tumors contained a large number of genetic alterations with the sum gain of at least 2 chromosomes within group A (chromosomes 1 to 3), B (chromosomes 4 and 5) or C (chromosomes 6 to 12) based on the length and centromere position. The single alterations consisted of gains of chromosome 1p, 1q, 2q24-q37, 5, 7q11.2-q36, 8, 8q23-24, 9p, 12p13-q22 and 15q22-26 and losses of chromosome were 3p14-p26, 4, 5p14, 12q23-24, 13q12-q22, 15q11.2-21, 16q and 18q12-q22 (Figure 10). The complex diploid samples showed less but substantial aberrations (at least 3) such as gains of chromosome 3q, 4 and 9, and losses of chromosome 1p12-22, 3p, 4q28-q35, 5q15-35, 6q12-q23, 16q, 19, 20 and 22 (Figure 12). In simple-diploid cases no genetic alterations could be detected by HR-CGH (Figure 11).
Table 3. High-resolution comparative genomic hybridization data of 9 synovial sarcoma cases
No. Ploidy Chromosome Gains Chromosome Losses
1 A(PDSS) 1p, 2q24-q37, 7q11.2-q36, +8, 8q23-24
3p14-p26, -4, 5p14, 13q12-q22, 16q, 18q12-q22
2 A(PDSS) 1q, +5, +8, 9p, 12p13-q22,
15q22-26 12q23-24, 15q11.2-21
3 Dc(MPSS) +4, +9 none
4 Dc(MPSS) 3q 1p12-22, 3p, 5q15-35, -19, -20, -22
5 Dc(BPSS) none 4q28-q35, 6q12-q23, 16q
6 Ds(BPSS) none none
7 Ds(BPSS) none none
8 Ds(MPSS) none none
9 Ds(MPSS) none none
(A, aneuploid; Dc, diploid-complex; Ds, diploid-simple)
39
Concerning the clinical course, 8 out of 10 patients (80%) with aneuploid tumor, 13 out of 33 patients (39%) with “simple-diploid” tumor and 6 out of 12 patients (50%) with “complex-diploid” tumor developed metastasis, respectively. By using Fisher’s exact test the three groups proved to be significantly different (P = 0.04).
IV.2 High expression of EZH2 and high abundance of H3K27me3 in PDSS
Concerning the EZH2 expression in synovial sarcomas; percent distribution of immunohistochemical scores is illustrated in Figure 13A, and statistical results are summarized in Table 4. Similar to Ki-67, high immunohistochemical scores of EZH2 and H3K27me3 were specifically recorded in PDSS and only rarely in the other subtypes. Overexpression of EZH2 in PDSS relative to MPSS and BPSS was also confirmed at the mRNA level (8.1x higher expression in PDSS, P<0.001, Figure 13B).
Significant differences between PDSS, MPSS and BPSS for EZH2, H3K27me3 and Ki-67 immunohistochemical scores were detected by Kruskal-Wallis test (all P<0.001).
The mean scores of all three markers were significantly higher in PDSS as compared with MPSS and BPSS. Furthermore, scores of EZH2 and H3K27me3, but not of Ki-67, were significantly higher in patients with larger tumor size, and all three markers were significantly higher in those with distant metastasis (Table 4). No statistically significant differences in mean immunohistochemical scores were found with regard to clinical factors such as age, gender, tumor location, or the type of fusion gene. Thus, EZH2 and H3K27me3 may be regarded as auxiliary markers of the poorly differentiated subtype, although the potential of EZH2 and H3K27me3 immunostaining to discriminate between PDSS and the other subtypes was inferior to that of Ki-67 (sensitivities, specificities, and positive predictive values for EZH2: 1.00, 0.82, 0.4; H3K27me3: 1.00, 0.90, 0.54; Ki-67, 1.00, 0.96, 0.75, respectively).
40
Across all subtypes, EZH2 expression was found to correlate with the abundance of H3K27me3 mark (Figure 14A, ρ: 0.73, P<0.0001, R2=0.648), indicating causal relationship between EZH2 activity and the presence of the associated epigenetic mark in synovial sarcoma. Significant positive correlation could also be demonstrated between EZH2 and Ki-67 scores both when including all cases (Figure 14B, ρ: 0.65, P<0.0001, R2=0.519) and with the exclusion of PDSS cases (Figure 14C, ρ: 0.50, P<0.001, R2=0.242), suggesting that EZH2 expression and proliferative activity were positively linked in the better-differentiated subtypes as well.
41
Figure 13. Distribution of scores 0–6 in the MPSS, BPSS, and PDSS subtypes, shown as stacked columns (A). mRNA expression of EZH2 in the PDSS vs. MPSS+BPSS groups, mean ± S.D. Human ribosomal protein S18 was used as endogenous control and human lymph node was served as calibrator (B).
![Figure 1. Synovial sarcoma originating in (A) popliteal fossa and (B) plantar region with calcification [5]](https://thumb-eu.123doks.com/thumbv2/9dokorg/1378096.113417/7.892.130.764.211.548/figure-synovial-sarcoma-originating-popliteal-plantar-region-calcification.webp)