2011/0082
Gene expression patterns of insulin-like growth factor 1, insulin-like growth factor 2 and insulin-like growth factor binding protein 3 in human placenta from pregnancies with intrauterine growth restriction
Bala´zs Bo¨rzso¨nyi
1, Csaba Demendi
1, Zsolt Nagy
2, Katalin To´th
2, Mo´nika Csana´d
2, Attila Pajor
1, Ja´nos Rigo´ Jr
3and Jo´zsef Ga´bor Joo´
3,*
1
Semmelweis University, 2
ndDepartment of Gynecology and Obstetrics, Budapest, Hungary
2
NAGY GE ´ N Diagnostics and Research Ltd., Budapest, Hungary
3
Semmelweis University, 1
stDepartment of Gynecology and Obstetrics, Budapest, Hungary
Abstract
Introduction: In this study, we compared insulin-like growth factor (IGF)-gene expression patterns and characteristics of glucose and insulin metabolism in human placenta from pregnancies with or without intrauterine growth restriction (IUGR).
Materials and methods: We compared 101 human placentas from intrauterine growth restriction pregnancies to those of 140 normal pregnancies treated at our department in a one- year period. We have also assessed the serum glucose and insulin levels of the IUGR and control groups. Several pos- sible predicting factors of IUGR were also investigated.
Results: Risk for IUGR was suggested by gestational weight gain and gestational increase in maternal body mass index (BMI) as well as maternal birthweight. In pregnancies with- out IUGR, umbilical cord glucose and insulin levels were significantly higher than in pregnancies with IUGR. In pla- centas from pregnancies with IUGR an overexpression of the IGF-2 and the insulin-like growth factor binding protein (IGFBP)-3 genes was found. In placentas from pregnancies with male fetal gender we found a significant overexpression of the IGF-2 gene.
Discussion: Gestational weight gain and BMI increase seem to predict the development of IUGR. Insulin and carbohy- drate metabolism are also impaired in IUGR fetuses. In the placentas from pregnancies with IUGR, IGF-2 is overex- pressed reflecting its physiological role in optimizing energy distribution in a low-energy environment.
*Corresponding author:
Dr. Jo´zsef Ga´bor Joo´
Semmelweis Egyetem, A´ OK
I.Sz. Szu¨le´szeti e´s No˜gyo´gya´szati Klinika Baross utca 27
1088 Budapest Hungary
E-mail: joogabor@hotmail.com
Keywords: Gene expression; glucose; insulin; insulin-like growth factor; intrauterine growth restriction; placenta.
Introduction
The blood flow through the uterine arteries increases signif- icantly during a physiological pregnancy. In the first trimes- ter it is at 50–90 mL/min, while at the end of the gestation reaches 600–700 mL/min. This increase is due to the decrease of the vascular resistance of both uterine arteries, which is the consequence of the trophoblast invasion in the spiral arteries. With normal placentation, placental circula- tion will be physiological and the blood supply will be suit- able for a normal intrauterine development. If the placentation is pathological, the circulation of the placenta will be pathological too, and a restricted fetal growth will occur. Due to the persistent pathological circulation of the placenta, the compensatory mechanisms of the fetus run out, and hypoglycemia, acidosis and oliguria develop
w8, 12
x.
Intrauterine growth restriction (IUGR) is defined as fetal birthweight at or below the 10
thpercentile for sex and ges- tational age
w40
x. IUGR may result from placental dysfunc- tion, fetal malformation, intrauterine infection or maternal factors. The most common etiology for IUGR is thought to be placental dysfunction, though its molecular level pathol- ogy remains largely unknown
w12, 33
x. At the same time it has to be noted, that abnormal changes in the placental bed may occur also without IUGR, for example, in case of pre- eclampsia.
Glucose is the single most important energy source for intrauterine fetal growth. As fetal gluconeogenesis is mini- mal, the bulk of glucose is provided through transplacental glucose transport
w22, 23
x. Fetal hypoglycemia is very com- mon in IUGR. The main etiology of fetal hypoglycemia is impaired transplacental glucose transport
w6
x. Magnusson and coworkers showed in 2004 that the principal mechanism of impaired carbohydrate metabolism in IUGR is abnormal glycolysis rather than an increased glucose demand in the placenta
w22
x.
Intrauterine growth retardation is also associated with low insulin secretion during the pregnancy, and probably a reduced development of insuline receptors. In fetal hypoin- sulinism there is a B cell hypotrophy, with consequences regarding developmental programming, such as insulin resis- tance
w36
x.
It has been previously hypothesized that fetal malnutrition
and the changes in the IGF axis may strongly influence and
‘‘program’’ the fetus for future pathology
w29
x. Both insulin and the growth factors IGF-1 and IGF-2 seem to be impor- tant in the pathogenesis of IUGR. Several studies tested umbilical cord blood levels of insulin and IGF in intrauterine growth restriction. The majority of these studies found a decreased level for both insulin and IGF
w7, 11, 32
x, while others showed opposite results
w38
x.
B lymphocytes are increased in women with IUGR in comparison with normal pregnancies and there is a signifi- cant negative correlation between maternal B-lymphocytes and birthweight
w2
x.
IGF-1 is a protein with a rather complex function. The IGF-1 gene is located in chromosome 12 (12q22-24.1) It can be detected in fetal tissues from the 9
thgestational week and it appears in the fetal circulation six weeks later
w1, 39
x. IGF- 1 receptors can be identified in the early phases of pregnancy.
During early fetal development, IGF-1 receptors show an enhanced sensitivity to IGF-1 compared to postnatal life
w13
x. Availability of IGF-1 for the fetus is regulated by six different insulin-like growth factor binding proteins (IGFBP 1–6). In the last trimester, just as during childhood and later life IGFBP-3 appears to be the main IGF-1 binding protein.
Together with growth hormone (GH) IGF-1 also regulates childhood and adolescent growth.
IGF-2 is also involved in the regulation of intrauterine growth. Its gene is located in chromosome 11 (11p15.5) in close proximity to the insulin (INS) and thysorine-hydroxi- lase (TH) genes. The main action of IGF-2 is mediated through endocrine and autocrine stimulation of cellular dif- ferentiation
w16, 30
x. In the first trimester, IGF-2 is mainly produced by the fetal lungs. In the second trimester, its con- centration in the amniotic fluid is about 3.2 times higher than that of IGF-1
w18
x.
In this study, we assessed IGF-gene expression patterns and characteristics of insulin and carbohydrate metabolism in placentas from IUGR pregnancies. We tried to find con- nection between the occurrence of IUGR and the maternal age, as well as to clear the eventual possibilities of predicting IUGR based on clinical information. We attempted to exam- ine the association between the serum glucose and insulin levels, and the development of IUGR. Lastly our main aim was to compare the placental gene expression profiles of the IGFs and IGFBP-3 in normal and IUGR pregnancies, as well as in male and female fetuses. We also investigated the even- tual connection between the patterns of gene expression of the IGF system and the severity of IUGR.
Material and methods
Patient population
We examined placentas from 101 pregnancies with intrauterine growth restriction treated at the Semmelweis University, Second Department of Gynecology and Obstetrics between 1 January, 2010 and 1 January, 2011 (The selection for IUGR was based on birth- weight data in our department.). We compared placental gene expression patterns of IGF-1, IGF-2 and IGFBP-3 as well as the clinical characteristics (fetal gender; maternal median age; gesta-
tional weight gain of the pregnant woman; gestational body mass index (BMI) increase of the pregnant woman; maternal birthweight) in the IUGR group to controls gained from 140 pregnancies without IUGR treated at our clinic in the same time period. (In certain cases the maternal birthweight was known by verbal informations.) Where no diagnosis of IUGR was made on the basis of standard definition, i.e., birthweight at or below the 10thpercentile for sex and gesta- tional age. (However, in diagnosing IUGR fetal abdominal circum- ference (AC) was also strongly considered as previously described w20x.) In the control group the selection criteria was the birthweight above the 10thpercentile for sex and gestational age, as well as the absence of any obstetric and genetic pathologies. Only those pla- centas were included in the study where IUGR was likely to be due to placental dysfunction after the exclusion of intrauterine infec- tions, chromosomal abnormalities, developmental disorders, mater- nal malnutrition, multiple pregnancy and structural abnormalities in the placentaw25x. Placental dysfunction sometimes reflects abnor- mal placental anatomy (e.g., battledore placenta, velamentous inser- tion of the cord, single umbilical artery), it more frequently reflects abnormal function of a normal placenta (e.g., due to smoking, diminished perfusion, infection, infarction, chronic idiopathic villi- tis, etc.). In some cases abnormal placental function may be due to abnormal platelet-vessel or platelet-platelet interactions caused by insufficient production of prostacyclin, resulting in a strong vaso- constrictionw37x.
Delivery was either vaginal or by cesarean section based on the clinical situation. In the final analysis, no distinction was made with respect to the type of delivery.
Placental tissue samples were taken in a uniform manner (imme- diately after the detachment of the placenta with a sterile scalpel, always close to the origin of the umbilical cord) with approximate dimensions of 2 cm=2 cm=2 cm (8 cm3), which were then kept at –708C for genetic expression testing. Maternal demographics and relevant clinical data during pregnancy or the perinatal period were collected including maternal and paternal age, obstetric history, genetic history, general medical history, maternal birthweight, ges- tational age, fetal gender, weight gain and BMI increase during pregnancy, pregnancy-related pathology including disorders of car- bohydrate metabolism, neonatal weight and Apgar score. Consent was obtained in each case from the mother (signatures on file).
Umbilical cord blood sampling
In 27 pregnancies with IUGR and 32 pregnancies without, 10 mL blood samples were obtained from the umbilical cord to test glucose and insulin levels. Blood sampling was performed right after the delivery, before the detachment of the placenta with sterile equip- ment. Though the needle punction have not made the accurate local- ization of the sampling (artery or vein) possible, we have definitely endeavored to avoid contamination by maternal blood. Shortly after sampling, blood samples were spun at 1800 rpm at the location of subsequent genetic testing. Samples were kept at –708C for subse- quent analysis. Glucose concentration was determined by Pureauto S GLU reagent with Hitachi 7600 glucose analyzer. Insulin levels were tested with Coat-A-Coat insulin kit.
RNA isolation and cDNA synthesis
Whole placental RNA content was isolated with Quick RNA micro- prep kit (Zymo Research, Irvine, CA, USA). RNA concentration was determined using NanoDrop spectophotometer (NanoDrop, Wilmington, DE, USA). Reverse transcription was performed in 20mL target volume using 5mg whole RNS, 75 pmol random hexamer primer, 10 mm dNTP (Invitrogen, Carlsbad, CA, USA), 20
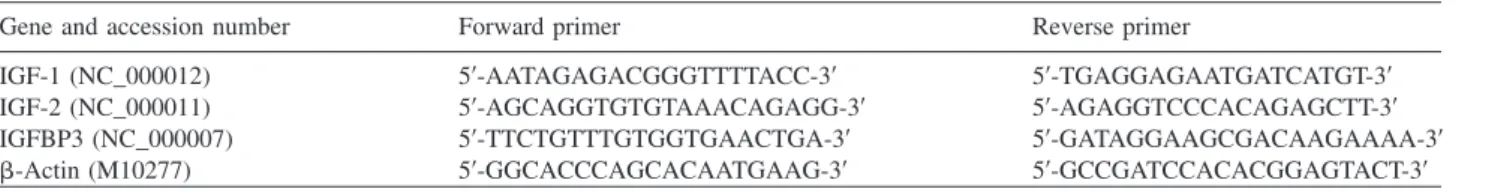
Table 1 Sequence of genes and primers used in the real-time PCR assay.
Gene and accession number Forward primer Reverse primer
IGF-1 (NC_000012) 59-AATAGAGACGGGTTTTACC-39 59-TGAGGAGAATGATCATGT-39
IGF-2 (NC_000011) 59-AGCAGGTGTGTAAACAGAGG-39 59-AGAGGTCCCACAGAGCTT-39
IGFBP3 (NC_000007) 59-TTCTGTTTGTGGTGAACTGA-39 59-GATAGGAAGCGACAAGAAAA-39
b-Actin (M10277) 59-GGCACCCAGCACAATGAAG-39 59-GCCGATCCACACGGAGTACT-39
Um-MuLV Reverse Transciptase enzyme (MBI Fermentas, Glen Burnie, MD, USA) and 1x-es buffer (MBI Fermentas). The reaction mix was incubated for 2 h at 428C. Subsequently, the enzyme was inactivated at 708C for 15 min.
Real-time PCR assay
The reverse transcriptase reaction solution was diluted 3-fold with nuclease-free water. For the real-time PCR assay, 1mL diluted cDNS (approximately 15 ng RNA-equivalent) and 1 x SYBR Green Master Mixet (Applied Biosystems, Carlsbad, CA, USA) were used.
Primers were designed using Primer Express Software (Applied Biosystems). Primer sequences are detailed in Table 1. Real-time PCR was performed in 20mL target volume using 1mL cDNA, 1 pmol, gene-specific Forward and Reverse primer and 1=SYBR Green PCR Master mix. All real-time PCR were performed using the MX3000 Real-time PCR (Stratagen, Santa Clara, CA, USA) system with the following settings: 40 cycles at 958C, denaturing process for 15 s, annealing at 608C, chain elongation and detection for 60 s. The sequence of genes and primers used in the real time PCR is summarized in Table 1. For each gene, relative expression was normalized using the humanb-actin gene as standard.
Statistical analysis
For gene expression studies two-samplet-test was used with 95%
confidence interval. Determination of degree of freedom was per- formed using the Welch-Satterthwaite correction. Values of gene expression testing were interpreted in the following manner: (1) overexpressionsLn value )1, P-0.05; (2) underexpressionsLn value-–1, P-0.05; (3) normal expressionsLn value-1,)–1, P-0.05. GraphPad Prism 3.0 (GraphPad Software Inc., La Jolla, CA, USA) software was used in all statistical analytic procedures.
Demographics and clinical data were analyzed with SPSS soft- ware. Logistic regression was used for dichotomous outcomes with multiple independent variables. For continuous outcomes, analysis of variance (ANOVA) and linear regression were used as appropri- ate. P-value of-0.05 was accepted for statistical significance.
Results Clinical data
In the IUGR group (n
s101), fetal gender distribution was 37 male and 64 female (male to female ratio 0.58). In the normal pregnancy group, male to female ratio was 1.09 (73 males, and 67 females).
The median birthweight of newborns from IUGR preg- nancies was 2315
"320 g, while 2930
"280 g in the control group.
The median value of the gestational age at delivery was 36.1
"2.39 weeks in the IUGR cases and 38.3
"1.79 weeks in the control group.
In the IUGR group, median maternal age was 30.82
"4.34, not statistically different from the normal preg- nancy group (31.45
"3.12, P
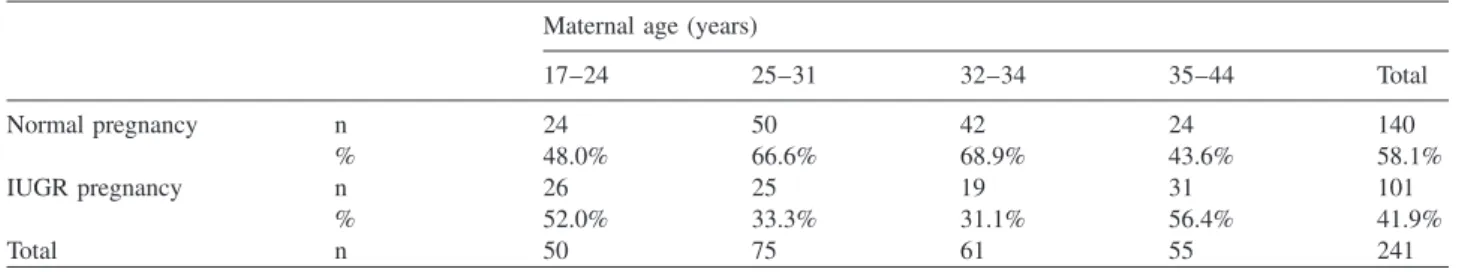
)0.05). Analyzing IUGR out- comes by maternal age groups, we found a statistically significant difference (Cramer V: 0.23) with IUGR being more common in age groups 17–24 and 35–44 when com- pared to age groups 25–31 and 32–34 (Table 2).
Concerning the initial bodyweight of patients with IUGR pregnancy and normal pregnancy, no significant difference was confirmed (IUGR group: 65.9 kg; control group:
62.6 kg; P
)0.05). When comparing the initial BMI values no significant differences were found (IUGR group: 24.8;
control group: 23.8; P
)0.05).
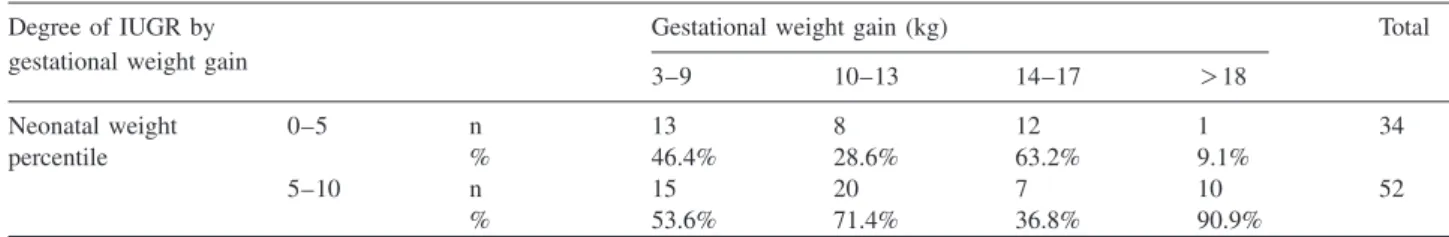
As it can be seen in Tables 3 and 4, there was a significant difference between the groups of normal and IUGR preg- nancies, concerning the gestational weight gain and the ges- tational increase of BMI. In the IUGR group, mean gestational weight gain was 10.9 kg, while in the control group it was 14.8 kg. Similarly, in the IUGR group BMI increased by 4.1 compared to an increase of 5.3 in the control group. When gestational weight gain was either lower (3–9 kg) or higher (14–17 kg) than average, a more severe form of IUGR (birthweight 0–5 percentile) was more likely than the ‘‘mild form’’ (birthweight 5–10 percentile), com- pared to subjects with average gestational weight gain (10–13 kg), associated typically with a less severe IUGR (Cramer V: 0.35) (Table 5).
As far as maternal birthweight, those mothers who deliv- ered babies with birthweight between 0 and 5 percentile themselves had been born with a median birthweight of 2830 g, a birthweight significantly lower than that of mothers who delivered babies with birthweight between 5 and 10 percentile. Median maternal birthweight in the latter group of mothers was 3120 g.
Umbilical cord blood tests
In the IUGR group, both glucose and insulin levels were significantly lower than in the control group (Table 6).
Gene expression studies
We had a total of 241 placenta samples available for genetic
studies; of these 101 were from pregnancies with IUGR and
140 from normal pregnancies. Gene expressions of IGF-1,
IGF-2 and IGFBP-3 were then compared between the groups
(Table 7). In the IUGR group, both IGF-2 and IGFBB-3 were
overexpressed compared to the normal pregnancy group
(IGF-2: 1.67-fold expression, P
s0.04, IGFBP-3: 1.55-fold
expression, P
s0.03).
Table 2 Distribution of maternal age in the IUGR and normal pregnancy groups.
Maternal age (years)
17–24 25–31 32–34 35–44 Total
Normal pregnancy n 24 50 42 24 140
% 48.0% 66.6% 68.9% 43.6% 58.1%
IUGR pregnancy n 26 25 19 31 101
% 52.0% 33.3% 31.1% 56.4% 41.9%
Total n 50 75 61 55 241
Table 3 Logistic regression with gestational weight gain and ges- tational BMI change as independent variables and IUGR or normal pregnancy as possible outcomes. This table shows, that there was a significant difference between the groups of normal and IUGR preg- nancies concerning the gestational weight gain and gestational increase of body mass index (BMI). In the IUGR group, mean ges- tational weight gain was 10.9 kg, while in the control group it was 14.8 kg (see Table 4).
Logistic regression B Exp(B) P-value
Gestational weight gain –0.783 0.457 0.001 Gestational change in BMI 0.017 1.017 0.008
Constant 1.333 3.794 0.027
Table 4 Gestational weight gain and gestational BMI change in the IUGR and normal pregnancy groups (gestational weight gain and BMI change was not known in all cases).
Gestational weight BMI change gain (kg)
Median n Median n
Normal pregnancy 14.7900 135 5.3100 133
IUGR pregnancy 10.9000 95 4.1100 74
Total 13.2000 230 4.8900 207
There was no evidence for gender difference in either IGF- 1 or IGFBP-3 gene expression as opposed to the IGF-2 gene, where an 1.02-fold (P
s0.03) overexpression was found (Table 8).
Within the IUGR group, there was no difference in IGF- 1, IGF-2 or IGFBP-3 gene function between those with a more severe degree of IUGR (birthweight 0–5 percentile) vs.
those with the less severe form (birthweight 5–10 percentile) (Table 9).
Discussion
In this study we found that in pregnancies with IUGR, male to female ratio was significantly lower than in the control group, which appeared to conform to the general population.
Overall, there was no difference between the groups in terms of maternal median age. However, when maternal age groups were considered it became evident that in the age groups 17–24 and 35–44 IUGR was more common than in the other groups (age groups 25–31 and 32–34; Cramer V:
0.23). It appears that in younger mothers and in those who are somewhat older from the obstetric-genetic viewpoint physiological growth during pregnancy may not be optimal.
This phenomenon parallels the well-known fact that in younger and older mothers (over age 35) several obstetric disorders are more common including premature birth, fetal chromosomal abnormalities and IUGR itself
w4, 10
x. How- ever, it must be concluded that maternal age has no signifi- cant role in the gene expression patterns of IGF-1, IGF-2 and IGFBP-3.
In regards to the initial body weight and BMI, no signif- icant difference was verified, though patients with IUGR pregnancy were a bit heavier, with slightly higher initial BMI values.
There was a significant difference between the groups both in gestational weight gain and gestational increase of BMI.
Lower than average gestational weight gain (12.5–13 kg)
w15
xappeared to predict a higher risk for IUGR.
When we stratified pregnancies by gestational weight gain we found that in the groups where gestational weight gain was either low (3–9 kg) or higher than average (14–17 kg) a more severe degree of IUGR with birthweights between 0 and 5 percentile was more common than in the 10–13 kg group. This points to the possibility that disorders that com- monly lead to increased gestational weight gain, such as impaired carbohydrate metabolism may have a role in the pathogenesis of IUGR.
Mothers that gave birth to babies with birthweight between 0 and 5 percentile had had a significantly lower birthweight themselves raising the possibility that genetic factors as well as developmental programming may influence the risk for IUGR.
Postnatal umbilical cord blood studies revealed that in the IUGR group both glucose and insulin levels were lower than in the control group. This supports similar results of prior studies
w7, 19, 21
x.
Several nutritional, hormonal and placental factors may
influence intrauterine growth. Glucose being the chief energy
source for physiological fetal growth, hypoglycemia and
hyperinsulinemia can lead to IUGR both in humans and in
several other mammalian species
w28
x. Fetal hypoinsulinemia
is especially important in the development of impaired bone
and soft tissue growth and leads to the proportional form of
IUGR
w6–8, 20
x.
Table 5 Distribution of gestational weight gain in the group of pregnancies with more severe (neonatal birthweight 0–5 percentile) and less severe (neonatal birthweight 5–10 percentile) form of IUGR.
Degree of IUGR by Gestational weight gain (kg) Total
gestational weight gain
3–9 10–13 14–17 )18
Neonatal weight 0–5 n 13 8 12 1 34
percentile % 46.4% 28.6% 63.2% 9.1%
5–10 n 15 20 7 10 52
% 53.6% 71.4% 36.8% 90.9%
Table 6 Glucose and insulin levels in umbilical chord blood in neonates with IUGR or normal pregnancy.
Newborns with IUGR (ns27) Normal newborns (ns32) P-value
Glucose concentration (mg/dL) 24.2"12.6 41.3"10.6 0.01
Insulin-concentration (ng/mL) 2.4"0.8 4.9"3.0 0.01
Table 7 Placental gene expression patterns of IGF-1, IGF-2 and IGFBP-3 in the IUGR group vs. normal pregnancy group as control.
Name of gene DCtnormal"SEa DCtIUGR"SEb avalue"SE(a)c Ln 2a LCL UCL P-value Gene expression IGF-1 3.18"0.82 3.10"0.7 0.08"0.5 0.05 –1.36 3.95 0.16 No change IGF-2 4.56"0.93 2.14"0.48 2.42"0.57 1.67 0.64 3.77 0.04 Up-regulated IGFBP-3 4.82"0.76 2.57"0.64 2.25"0.43 1.55 0.21 4.02 0.03 Up-regulated
aDCtnormalsCttested gene–Ctb-actin,bDCtIUGRsCttested gene–Ctb-actin,casDCtnormal–DCtIUGR; UCLsupper confidence limit; LCLslower confi- dence limit; nnormals140; nIUGRs101 (P-0.05; significant).
Table 9 Placental gene expression patterns of IGF-1, IGF-2 and IGFBP-3 in the more severe form of IUGR (neonatal birthweight 0–5 percentile) vs. less severe form (neonatal birthweight 5–10 percentile) as control.
Name of gene DCtA"SEa DCtB"SEb avalue"SE(a)c Ln 2a P-value Gene expression
IGF-1 3.2"0.72 2.98"0.5 0.22"0.39 0.15 0.08 No change
IGF-2 1.95"0.4 2.35"0.6 –0.4"0.42 –0.27 0.05 No change
IGFBP-3 2.8"0.81 2.3"0.47 0.5"0.6 0.34 0.04 No change
aPlacental sample from pregnancies with neonatal birth weight 5–10 percentile.bPlacental sample from pregnancies with neonatal birthweight 0–5 percentile;DCtAsCttested gene–Ctb-actin,DCtBsCttested gene–Ctb-actin,casDCtA–DCtB; nAs54; nBs38 (P-0.05; significant).
Table 8 Placental gene expression patterns of IGF-1, IGF-2 and IGFBP-3 in the male IUGR fetus vs. female IUGR fetus as control.
Name of gene DCtfemale"SEa DCtmale"SEb avalue"SE(a)c Ln 2a LCL UCL P-value Gene expression IGF-1 3.36"0.33 2.84"0.50 0.52"0.41 0.36 –0.74 0.82 0.06 No change IGF-2 2.88"0.60 1.40"0.35 1.48"0.70 1.02 0.85 1.45 0.03 Up-regulated IGFBP-3 3.12"0.93 2.02"0.68 1.10"0.71 0.76 –0.17 1.27 0.05 No change
aDCtfemalesCttested gene–Ctb-actin,bDCtmalesCttested gene–Ctb-actin,casDCtfemale–DCtmale; UCLsupper confidence limit; LCLslower confidence limit; nfemales64; nmales37 (P-0.05; significant).
In our genetic expression assays, we found a significant difference between the groups in the expression patterns of IGF-2 and IGFBP-3 though not in IGF-1. In the former two, significant overexpression was found. The overexpression of the placental IGF-2 gene was previously shown in some studies
w20, 33
x, though not confirmed in others
w34
x. One of the most significant papers, discussing the role of IGF-2 in the placental and fetal growth, suggests that the gene of IGF-2 control both the placental supply and the genetic demand for maternal nutrients
w3
x. These data confirm our
results that IGF-2 gene overexpression may play a role in the pathophysiology of IUGR.
Insulin-like growth factors influence both metabolic and
non-metabolic components of intrauterine growth. While
IGF-1 primarily affects nutritional intake, the main role of
IGF-2 appears to be mediated through its general regulating
effects on cellular growth and tissue-specific cell prolifera-
tion
w9
x. It is possible that the overexpression of the IGF-2
gene may have the function to ascertain optimal, prioritized
distribution of energy to the tissues in a low-energy environ-
ment. This effect appears analogous to the redistribution mechanism observed in intrauterine asphyxia
w14
x. The thrifty phenotype hypothesis states that this energy redistri- bution in IUGR comes at a price: it predicts an increased risk for diabetes and cardiovascular problems in later post- natal life
w14, 31
x.
Availability of IGF-1 and IGF-2 is regulated by six dif- ferent binding proteins. Among these, the role of IGFBP-1 is known and discussed in the literature
w17
x, while that of IGFBP-3 is less significantly expressed in papers dealing with the connection of IGF system and IUGR, and the results are quite inconsistent. In contrast to our findings, prior stud- ies showed overexpression of the IGFBP-1 rather than the IGFBP-3 gene in the IUGR placenta. Meio et al. and other papers concluded from their examinations that newborns with IUGR have significantly reduced IGFBP-3 levels at birth, which suggests, that its gene is underexpressed
w5, 11, 24
x. At the same time Murisier-Petetin et al. and Tisi et al.
verified a high amniotic fluid concentration of IGFBP-3 in the second trimester from pregnancies with IUGR
w26, 35
x. Anyway our results based on a numerous sample confirms, that IGFBP-3 gene overexpression plays an important role in the pathophysiology of IUGR. It was previously supposed, that IGFBP-3 may potentiate IGF action, and is associated to the changes in the insulin and carbohydrate metabolism.
IGFBP-3 has both inhibitory and stimulatory effects in cell systems, and modulates growth. IGFBP-3 also works as res- ervoir of IGF-1, carrying it to target cells
w24
x. It has been verified that IGFBP-3 increases the bioeffectiveness of IGF- 1 by 2- to 4-fold. As IGF-1 primarily affects nutritional intake, its effectivity in the function can be positively influ- enced by IGFBP-3, which may explain the placental overex- pression of the IGFBP-3 gene.
In the IUGR group, the IGF-2 gene was overexpressed in the placenta from pregnancies with male fetal gender. There was no such gender difference in the function of either the IGF-1 or the IGFBP-3 genes. This fetal gender-specific over- expression of the IGF-2 gene was previously observed in the amniotic fluid of normal pregnancies
w27
x. This may reflect a possible physiological role of IGF-2 in the development of gender-specific phenotype.
There seemed to be no relationship between the severity of IUGR and expression patterns of the tested genes. It appears that the severity of IUGR is therefore not primarily linked to the IGF system. Other genetic and constitutional factors may play a more predominant role in this regard.
In summary, we found that intrauterine growth restriction is more common with maternal age around 20 or above 35.
Risk for IUGR is predicted by gestational weight gain and gestational increase in maternal BMI as well as maternal birthweight. In intrauterine growth restriction, glucose and insulin levels are significantly lower in the umbilical cord blood than in normal pregnancy. In human placenta from pregnancies with IUGR the placental IGF-2 and IGFBP-3 genes are significantly overexpressed compared to placental IGF-2 and IGFBP-3 from normal pregnancies. Based on these an eventual connection may be supposed between the development of chronic diseases in the adulthood and the
risk of developing IUGR. In intrauterine growth restriction, the placental IGF-2 gene is overexpressed in the male fetus reflecting the role of IGF-2 in the development of gender- specific phenotype. In our study, we could not detect a rela- tionship between the severity of IUGR and patterns of gene expression of the IGF system.
Acknowledgements
I would like to acknowledge the significant contribution of my col- leagues at the 1stand 2ndDepartment of Obstetrics and Gynecology Semmelweis University in making the study. I would also like to thank the participation of my colleagues at the Nagy Ge´n Diagnos- tics and Research Ltd.
References
w1x Ashton IK, Zapf J, Einschenk I, MacKenzie IZ. Insulin-like growth factors (IGF) I and II in human fetal plasma and rela- tionship to gestational age and fetal size during midpregnan- cy. Acta Endocrinol (Copenh). 1985;110:558–63.
w2x Bartha JL, Comino-Delgado R. Lymphocyte subpopulations in intrauterine growth retardation in women with or without previous pregnancies. Eur J Obstet Gynecol Reprod Biol.
1999;82:23–7.
w3x Constancia M, Hemberger M, Hughes J, Dean W, Ferguson- Smith A, Fundele R, et al. Placental-specific IGF-2 is a major modulator of placental and fetal growth. Nature. 2002;417:
945–8.
w4x Cunningham FG, Leveno KJ. Childbearing among older women – the message is cautiously optimistic. N Engl J Med.
1995;333:1002–4.
w5x De Zegher F, Francois I, van Helvoirt M, van den Berghe G.
Clinical review 89: small as fetus and short as child: from endogenous to exogenous growth hormone. J Clin Endocrinol Metabol. 1997;82:2021–6.
w6x Economides DL, Nicolaides KH. Blood glucose and oxygen tension levels in small-for-gestational-age fetuses. Am J Obs- tet Gynecol. 1989;160:385–9.
w7x Economides DL, Proudler A, Nicolaides KH. Plasma insulin in appropriate- and small-for-gestational-age fetuses. Am J Obstet Gynecol. 1989;160:1091–4.
w8x Fowden AL. Endocrine regulation of fetal growth. Reprod Fertil Develop. 1995;7:351–63.
w9x Fowden AL. The insulin-like growth factors and feto-placen- tal growth. Placenta. 2003;24:803–12.
w10x Fraser AM, Brockert JE, Ward RH. Association of young maternal age with adverse reproductive outcomes. N Engl J Med. 1995;332:1113–7.
w11x Giudice LC, de Zegher F, Gargosky SE, Dsupin BA, de las Fuentes L, Crystal RA, et al. Insulin-like growth factors and their binding proteins in the term and preterm human fetus and neonate with normal and extremes of intrauterine growth.
J Clin Endocrinol Metabol. 1995;80:1548–55.
w12x Gluckman PD, Harding JE. The physiology and pathophysio- logy of intrauterine growth retardation. Horm Res. 1997;48 (Suppl 1):11–6.
w13x Gluckman PD, Grumbach MM, Kaplan SL. The neuroendo- crine regulation and function of growth hormone and prolac- tin in mammalian fetus. Endo Rev. 1981;2:363–95.
w14x Hales CN, Barker DJ. The thrifty phenotype hypothesis. Br Med Bull. 2001;60:5–20.
w15x Hytten FE, Thomson AM. Maternal physiological adjust- ments. In: Assali NS, editors. Biology of gestation, Vol. I.
The maternal organism. New York: Academic Press; 1968.
w16x Jones JI, Clemmons DR. Insulin-like growth factors and their binding proteins: biological actions. Endo Rev. 1995;16:3–34.
w17x Kajimura S, Aida K, Duan C. Insulin-like growth factor- binding protein-1 (IGFBP-1) mediates hypoxia-induced embryonic growth and developmental retardation. Proc Natl Acad Sci USA. 2005;102:1240–5.
w18x Kubota T, Kamada S, Taguchi M, Aso T. Determination of insulin-like growth factor-2 in feto-maternal circulation dur- ing human pregnancy. Acta Endocrinol. 1992;127:359–65.
w19x Kuo PL. Glucose gradients of maternal vein-umbilical artery in normally grown and growth-retarded fetuses. J Perinat Med. 1991;19:421–5.
w20x Lee JJ. Birth weight for gestational age patterns by sex, plurality and parity in Korean populations. Korean J Perina- tol. 2007;18:1–11.
w21x Lee MH, Jeon YJ, Lee MS, Park MH, Jung SC, Kim YJ.
Placental gene expression is related to glucose metabolism and fetal cord blood levels of insulin and insulin-like growth factors in intrauterine growth restriction. Early Hum Dev.
2010;86:45–50.
w22x Magnusson AL, Powell T, Wennergren M, Jansson T. Glucose metabolism in the human preterm and term placenta of IUGR fetuses. Placenta. 2004;25:337–46.
w23x Marconi AM, Cetin I, Davoli E, Baggiani AM, Fanelli R, Fennessey PV, et al. An evaluation of fetal glucogenesis in intrauterine growth-retarded pregnancies. Metabolism.
1993;42:860–4.
w24x Meio MDB, Moreira MEL, Sichieri R, Moura AS. Reduction of IGF-binding protein-3 as a potential marker of intrauterine growth restriction. J Perinat Med. 2009;37:689–93.
w25x Lee MH, Jeon YJ, Lee SM, Park MH, Jung SC, Kim YJ.
Placental gene expression is related to glucose metabolism and fetal cord blood levels of insulin and insulin-like growth factors in intrauterine growth restriction. Early Hum Develop.
2010;86:45–50.
w26x Murisier-Petetin G, Gremlich S, Damnon F, Reymondin D, Hohlfeld P, Gerber S. Amniotic fluid insulin-like growth fac- tor binding protein 3 concentration as early indicator of fetal growth restriction. Eur J Obstet Gynecol Reprod Biol. 2009;
144:15–20.
w27x Nagy Zs, Bo¨rzso¨niy B, Demendi CS, et al. Gender specific gene expression of IGF-1 and IGF-2 in second trimester amniotic fluid cells. Obstet Gynecol. 2011 (under review).
w28x Neitzke U, Harder T, Plagemann A. Intrauterine growth restriction and developmental programming of the metabolic
syndrome: a critical appraisal. Microcirculation. 2011;18:
304–11.
w29x Ozanne SE, Hales N. Early programming of glucose-insulin metabolism. Trends Endocrin Metabol. 2002;13:368–73.
w30x Pahlman S, Meyerson G, Lindgren E, Schalling M, Johansson I. Insulin-like growth factor I shifts from promoting cell divi- sion to potentiating maturation during neuronal differentia- tion. Proc Natl Acad Sci USA. 1991;88:9994–8.
w31x Plagemann A. A matter of insulin: developmental program- ming of body weight regulation. J Maternal Fetal Neonatal Med. 2008;21:143–8.
w32x Samaan NA, Schultz PN, Johnston DA, Creasy RW, Gonik B. Growth hormone, somatomedin C, and non-suppressible insulin-like activity levels compared in premature, small, average birth weight, and large infants. Am J Obstet Gynecol.
1987;157:1524–8.
w33x Sheikh S, Satoskar P, Bhartiya D. Expression of insulin-like growth factor-I and placental growth hormone mRNA in pla- centae: a comparison between normal and intrauterine growth retardation pregnancies. Mol Hum Reprod. 2001;7:287–92.
w34x Street ME, Seghini P, Fieni S, Ziveri MA, Volta C, Martorana D, et al. Changes in interleukin-6 and IGF system and their relationships in placenta and cord blood in newborns with fetal growth restriction compared with controls. Eur J Endo- crinol. 2006;155:567–74.
w35x Tisi DK, Liu XJ, Wykes LJ, Skinner CD, Koski KG, et al.
Insulin-like growth factor II and binding proteins 1 and 3 from second trimester human amniotic fluid are associated with infant birth weight. J Nutr. 2005;135:1667–72.
w36x Van Assche FA, Holemans K, Aerts L. Fetal growth and con- sequences for later life. J Perinat Med. 1998;26:337–46.
w37x Varner MW. Disproportionate fetal growth. In: DeCherney AH, Pernoll ML, editors. Current obstetric & gynecologic diagnosis & treatment. East Norwalk: Appleton & Lange;
1994. pp. 344–56.
w38x Wang HS, Lim J, English J, Irvine L, Chard T. The concen- tration of insulin-like growth factor-I and insulin-like growth factor-binding protein-1 in human umbilical cord serum at delivery: relation to fetal weight. J Endocrinol. 1991;129:
459–64.
w39x Wang HS, Chard T. The role of insulin-like growth factor-I and insulin-like growth factor-binding protein-1 in the control of human fetal growth. J Endocrinol. 1992;132:11–9.
w40x Wollmann HA. Intrauterine growth restriction: definition and etiology. Horm Res. 1988;49(Suppl 2):1–6.
The authors stated that there are no conflicts of interest regarding the publication of this article.
Received April 7, 2011. Revised June 22, 2011. Accepted June 24, 2011. Previously published online July 30, 2011.