Nitric oxide synthetic pathway and cGMP levels are altered in red blood cells from end-stage renal disease patients
Natalia Di Pietro1,2• Annalisa Giardinelli1,2•Vittorio Sirolli3•Chiara Riganti4• Pamela Di Tomo1,2• Elena Gazzano4•Sara Di Silvestre1,2•Christina Panknin5• Miriam M. Cortese-Krott5• Csaba Csonka6,7• Malte Kelm5•Pe´ter Ferdinandy7,8• Mario Bonomini3•Assunta Pandolfi1,2
Received: 11 February 2016 / Accepted: 13 May 2016 ÓSpringer Science+Business Media New York 2016
Abstract Red blood cells (RBCs) enzymatically produce nitric oxide (NO) by a functional RBC-nitric oxide syn- thase (RBC-NOS). NO is a vascular key regulatory mole- cule. In RBCs its generation is complex and influenced by several factors, including insulin, acetylcholine, and cal- cium. NO availability is reduced in end-stage renal disease (ESRD) and associated with endothelial dysfunction. We previously demonstrated that, through increased phos- phatidylserine membrane exposure, ESRD-RBCs aug- mented their adhesion to human cultured endothelium, in which NO bioavailability decreased. Since RBC-NOS-de- pendent NO production in ESRD is unknown, this study aimed to investigate RBC-NOS levels/activation, NO production/bioavailability in RBCs from healthy control subjects (C, N=18) and ESRD patients (N=27).
Although RBC-NOS expression was lower in ESRD- RBCs, NO, cyclic guanosine monophosphate (cGMP),
RBC-NOS Serine1177 phosphorylation level and eNOS/
Calmodulin (CaM)/Heat Shock Protein-90 (HSP90) inter- action levels were higher in ESRD-RBCs, indicating increased enzyme activation. Conversely, following RBCs stimulation with insulin or ionomycin, NO and cGMP levels were significantly lower in ESRD- than in C-RBCs, suggesting that uremia might reduce the RBC-NOS response to further stimuli. Additionally, the activity of multidrug-resistance-associated protein-4 (MRP4; cGMP- membrane transporter) was significantly lower in ESRD- RBCs, suggesting a possible compromised efflux of cGMP across the ESRD-RBCs membrane. This study for the first time showed highest basal RBC-NOS activation in ESRD- RBCs, possibly to reduce the negative impact of decreased NOS expression. It is further conceivable that high NO production only partially affects cell function of ESRD- RBCs maybe because in vivo they are unable to respond to physiologic stimuli, such as calcium and/or insulin.
Keywords End-stage renal diseaseRed blood cells Nitric oxide cGMPNitric oxide synthase
Mario Bonomini, and Assunta Pandolfi have contributed equally to the study.
Electronic supplementary material The online version of this article (doi:10.1007/s11010-016-2723-0) contains supplementary material, which is available to authorized users.
& Assunta Pandolfi
pandolfi@unich.it
1 Department of Medical, Oral and Biotechnological Sciences, University ‘‘G. d’Annunzio’’, Chieti-Pescara, Chieti, Italy
2 Aging Research Center and Translational Medicine CeSI- MeT, ‘‘G. d’Annunzio’’ University Foundation, Chieti- Pescara, Room 421, Via Luigi Polacchi, 11, 66100 Chieti, Italy
3 Department of Medicine and Aging Sciences, University ‘‘G.
d’Annunzio’’, Chieti-Pescara, Chieti, Italy
4 Department of Oncology, University of Torino, Turin, Italy
5 Cardiovascular Research Laboratory, Division of Cardiology, Pneumology and Angiology, Medical Faculty, Heinrich Heine University of Du¨sseldorf, Du¨sseldorf, Germany
6 Cardiovascular Research Group, Department of Biochemistry, University of Szeged, Szeged, Hungary
7 Pharmahungary Group, Szeged, Hungary
8 Department of Pharmacology and Pharmacotherapy, Semmelweis University, Budapest, Hungary DOI 10.1007/s11010-016-2723-0
Introduction
Red blood cells (RBCs) represent about 50 % of the human blood cell fraction and the mean RBC life span of healthy subjects is about 3 months [1]. In contrast, RBCs from patients with end-stage renal disease (ESRD) show a reduced life span, changes in shape, and decreased deformability [2]. Although anemia in ESRD results mainly from erythropoietin and iron deficiency, these metabolic changes, associated to RBC senescence and aminophospholipid phosphatidylserine (PS) externaliza- tion, can accelerate clearance of circulating erythrocytes because of premature suicidal erythrocyte death or eryp- tosis characterized by PS exposure at the erythrocyte sur- face [3].
RBCs play an important role in the balance between generation and scavenging of nitric oxide (NO), which is a key regulator of vascular homeostasis [4]. Although find- ings on a functional RBC-NOS in humans are quite con- tradictory [5], recently it was hypothesized that human RBCs carry active NOS, producing NO even under nor- moxic conditions [6,7]. Of note, NO generation in RBC has been demonstrated to be influenced by various factors ex vivo, including insulin [7] and acetylcholine [8].
Recently, we and other authors demonstrated that RBC- NOS activity regulates several cell functions such as deformability of RBC membrane and inhibits activation of platelets. Thus, the microcirculation might be directly influenced by intracellular erythrocyte NO availability [7, 9,10].
Interestingly, it has been suggested that the increased blood viscosity, impaired perfusion at the tissue level, and the rheological alterations shown in ESRD patients may play a role in the development of the atherosclerosis pro- cesses often experienced by these patients [2,11–14].
Endothelial dysfunction is thought to play a major role behind the increased cardiovascular risk in ESRD [15], and alterations in erythrocytes per se and erythrocyte-en- dothelial cell interactions might contribute to vascular damage in ESRD as well as in several other diseases [16–
18]. In fact, we have recently demonstrated that in ESRD patients the appearance of the PS on the RBC surface increases their adhesion to cultured human endothelial cells, resulting in decreased endothelial nitric oxide syn- thase (eNOS) expression and NO release from endothelium [19–21].
Notably, RBC-NOS expression and activity are decreased in RBCs from patients with endothelial dys- function and coronary artery disease [6,22,23]. However, along with the study just mentioned, there are only a few studies concerning NO production, RBC-NOS expression, and activation in RBCs from other pathological conditions
[23–25]. Some of them show an increased RBC-NOS activation in RBCs from sickle cell anemia patients and a significant increase in cGMP levels within RBCs has also been found as compared to healthy subjects [25, 26].
Recently, it was shown that NO production was higher in RBCs from patients with type 2 diabetes than in controls [27]. The decreased RBC arginase activity could be con- sidered a potential mechanism for increased RBC NO production in early diabetes. Thus, the RBC pool may be a potentially compensatory intravascular compartment for endothelial dysfunction in diabetes [27]. More recently Bizjak et al. [28], by a study on age-dependent changes of rheology and enzymatic properties in RBCs, showed highest RBC-NOS activation and NO production in old RBC, suggesting that this is probably required to counter- act the negative impact of cell shrinkage on RBC deformability. In addition, they found this effect even more pronounced in diabetic patients. Interestingly, they further suggested that, although NO was highly produced, its bioavailability decreased in old RBC.
Nevertheless, to date, very little is known regarding basal and stimulated NO and cGMP levels, RBC-NOS expression and activity in RBCs from ESRD patients.
A few studies suggest that, particularly in platelets and RBCs, the NO and cGMP levels may be increased in subjects on dialysis, though the underlying mechanisms and derived effects are essentially undefined [29–31].
It is well recognized that in physiological conditions the concentration of cGMP inside cells reflects a balance between its synthesis and removal. In RBCs the removal of cGMP involves membrane transporters, including the multidrug-resistance-associated proteins (MRPs) [32]. In particular, MRP4 and MRP5 have been detected on RBC membranes of healthy subjects and both are known to be implicated in the active efflux of cGMP from RBCs [32].
Based on this, in our study, we aimed to determine basal and insulin or ionomycin-stimulated NO levels, RBC-NOS expression and activity, cGMP production and its efflux in erythrocytes from patients suffering from ESRD and rela- tive controls. Such knowledge might help define basal and stimulated nitric oxide synthetic pathway in red blood cells from end-stage renal disease patients.
Materials and methods Study population
RBCs were obtained from ESRD patients (N=27) recruited from among those presenting at the dialysis center of the University Hospital of Chieti. RBCs obtained from age- and gender-matched healthy subjects were used
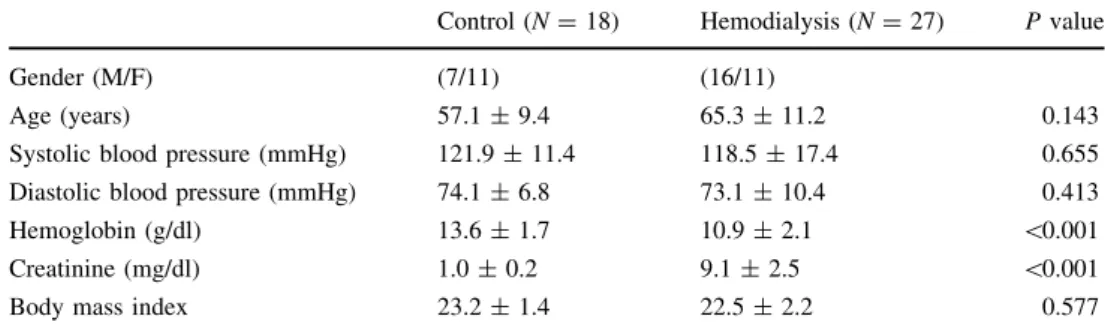
as controls (C,N=18). Table1 shows the main clinical and biochemical characteristics of the participants. ESRD patients had been on regular hemodialysis treatment for more than 6 months (mean time on dialysis 36.1±29.7 months). The cause of ESRD was nephroan- giosclerosis in 13 patients, chronic glomerulonephritis in 7, chronic interstitial nephritis in 4, unknown in 3. Exclusion criteria included age younger than 18 years or older than 75 years, diabetes mellitus, uncontrolled hypertension, active infections, malignant or inflammatory disease, blood transfusion over the past 3 months, iron and folic acid deficiency, use of drugs that might interfere with erythro- poiesis (such as angiotensin-converting enzyme inhibitors and theophylline). Moreover, no drugs affecting NO syn- thesis or with antioxidant effects were used. All patients were on stabilized erythropoietin (EPO) dosage, and were undergoing dialysis three times weekly with a 4-h dialysis session using bicarbonate dialysate and first-use synthetic membranes (polysulphone, N=12; polyacrylonitrile, N=15). Healthy control subjects enrolled in the study were not receiving any medication. Subjects with any abnormalities on routine physical examination, standard laboratory tests, ECG, or chest x-ray were not included in the study. The study protocol was approved by the Ethics Committee of the University of Chieti, and, in adherence with theDeclaration of Helsinki, written informed consent was obtained from all subjects taking part in the study.
Erythrocyte preparation
Venous blood samples (4 ml) from healthy subjects and ESRD patients before hemodialysis were collected as previously described [22]. After blood sample centrifuga- tion at 7009gfor 5 min at 4°C, the plasma, buffy coat and top layer of RBCs were removed. Packed RBCs were then washed three times with Dulbecco’s phosphate buffered saline 19(PBS) and re-suspended in PBS at a hematocrit of 0.01 l/l, thus differently treated for further investigation.
RBC samples were separated via differential centrifugation and the purity of the RBC preparation was controlled by fluorescence stain of Glycophorin A in Flow Cytometry and Immunofluorescence Confocal Microscopy.
Antibodies and materials
RBC-NOS was immunolabeled using a mouse mono- clonal antibody (eNOS clone 3; BD Transduction Labs, Lexington, KY), polyclonal antibodies (sc-654 and sc- 8311, Santa Cruz Biotechnology, Inc.) or using anti- NOS3 antiserum (BD Bioscience). Phospho-eNOS (Ser1177) was detected using a synthetic peptide, corre- sponding to aa 1172-1183 (07-428, Upstate Biotechnol- ogy, Lake Placid, NY) and b-actin using a monoclonal antibody (A5441, Sigma, St-Louis, MO, USA). Heat shock protein 90 (HSP90), Caveolin-1 (cav-1), Calmod- ulin (CaM), and Glycophorin A were immunolabeled using polyclonal antibodies (respectively, sc-7947, sc-894, sc-5537, and sc-20628, Santa Cruz Biotechnology, Inc.).
The RBC membrane proteins were probed with anti- MRP4 (Abcam, Cambridge, UK), anti-MRP5 (SantaCruz Biotechnology Inc., Santa Cruz, CA), anti-nitrotyrosine (Millipore, Billerica, MA), anti-S-nitroso-cysteine (Sigma Chemical Co.), and anti-band 3 (Sigma Chemical Co.).
Secondary antibodies were HRP-conjugated goat anti- mouse (401253, Calbiochem, La Jolla, CA), goat anti- rabbit (Rockland), donkey anti-rabbit (Amersham, GE Healthcare, Chalfont St. Giles, UK), Cy3-conjugated goat anti-mouse (cod. num. 115 165 146, Jackson Immuno Research Labs, Inc., West Grove, PA; for chemilumi- nescence detection), PE-conjugated goat anti-mouse (sc- 2866, Santa Cruz Biotechnology, Inc.), and Alexa 488 goat anti-rabbit (A11034, Molecular Probes, Invitrogen, Eugene, Oregon, USA; for Immunofluorescence detec- tion). Insulin (Actrapid HM 100 UI/ml) was from Novo Nordisk A/S (Bagsvaerd, Denmark). The NO synthase (NOS) inhibitor N-nitro-L-arginine methyl ester (L- NAME) and Ionomycin were from Sigma Chemicals (St.
Louis, MO, USA). The NO-reactive dye 4,5-diaminoflu- orescein diacetate (DAF-2DA) was from Calbiochem (P.N.251505). The S-Nitroso-N-Acetil-DL-Penicillamide (SNAP), Ferrous sulfate heptahydrate (FeSO4), and Wil- mad Quartz (CFQ) EPR tubes (4 mm O.D.) were from Sigma-Aldrich. The N-methyl-D-glucamine-dithiocarba- mate (MGD) sodium salt monohydrate was from DBA (DBA, Milan, Italy).
Table 1 Demographic and clinical characteristics of the study population
Control (N=18) Hemodialysis (N=27) Pvalue
Gender (M/F) (7/11) (16/11)
Age (years) 57.1±9.4 65.3±11.2 0.143
Systolic blood pressure (mmHg) 121.9±11.4 118.5±17.4 0.655
Diastolic blood pressure (mmHg) 74.1±6.8 73.1±10.4 0.413
Hemoglobin (g/dl) 13.6±1.7 10.9±2.1 \0.001
Creatinine (mg/dl) 1.0±0.2 9.1±2.5 \0.001
Body mass index 23.2±1.4 22.5±2.2 0.577
Measurement of NO production by EPR spectroscopy
NO content of RBCs (20ll of packed and washed C- and ESRD-RBCs) was measured using electron spin resonance spectroscopy after in vitro spin trapping as described elsewhere [33]. Briefly, an aqueous spin trapping solution Fe2?-(MGD)2 was prepared before each experiment and RBCs were treated with Fe2?-(MGD)2 (20 ll, 1:1 ratio with erythrocytes) and incubated for 10 min at 37°C.
Samples were then placed into quartz electron spin reso- nance tubes and frozen immediately in liquid nitrogen.
Samples were assayed for electron spin resonance spectra of the relatively stable NO-Fe2?-(MGD)2adduct. Electron spin resonance spectra were recorded with a Bruker ECS106 (Rheinstetten, Germany) spectrometer operating at X band with 100 kHz modulation frequency at a tem- perature of 160 K, using 10 mW microwave power to avoid saturation. Scans were traced with 2.85 G modula- tion amplitude, 340 G sweep width, and 3356 G central field as described [34, 35]. Analysis of NO content was performed with double integration of the NO signal as described previously [34–36]. NO content of the samples were expressed in arbitrary units as this method enables a semi-quantitative assessment of NO content in biological samples (see for review Csonka et al. [37]).
Western blot analysis
The RBC-NOS enzyme was isolated directly from crude red cell lysates, immunoprecipitated and analyzed by Western blot as previously described [38]. As control, 20lg of human umbilical vein endothelial-cell extracts (HUVECs) was electrophoretically separated and resolved together with the red cell lysate. RBC-NOS expression was defined as red cell eNOS ratio, in which ratio stands for fold increases of RBC-NOS in C- and ESRD-RBCs versus control HUVECs.
To evaluate RBC-NOS phosphorylation levels, 400lg of protein from erythrocytes lysates was used. Briefly, proteins were incubated overnight with 2lg of eNOS antibody at 4°C, gently rocking; the day after, 40ll of 50 % slurry protein A/G beads (Santa Cruz Biotechnology, S. Cruz, CA, USA) were added and incubated for 4 h at 4°C, gently rocking. Immunoprecipitated complexes were resolved on a 7.5 % SDS-PAGE gel, transferred to nitro- cellulose membranes and probed with the Phospho-eNOS antibody (Ser1177; 1:1000) first and then eNOS antibody (1:1000). Immunoreactive bands were detected using the ECL system (Amersham, GE Healthcare). The complex eNOS-HSP90-Calmodulin and Caveolin-1 levels were also assessed after RBC-NOS immunoprecipitation. Immuno- precipitated complexes were resolved on a 8 or 12 % SDS-
PAGE gel, transferred to nitrocellulose membrane and probed with eNOS (1:1000) first and after was probed for HSP90 (1:1000), Calmodulin (1:1000) and Caveolin-1 (1:1000) and detected as described above.
To determine protein membrane fractions, 600ll of packed ESRD- or C-RBCs (both N=6) was lysed and centrifuged at 100,0009g for 1 h at 4°C. 50lg of mem- brane proteins was resolved by SDS-PAGE and probed with anti-MRP4 (1:500), anti-MRP5 (1:250), anti-nitroty- rosine (1:100), anti-S-nitroso-cysteine (1:2000), and anti- band 3 (1:5000). Protein levels were detected by enhanced chemiluminescence (Bio-Rad). To evaluate the presence of nitrated or nitrosated MRP4/MRP5, 500lg of membrane proteins was immunoprecipitated with an anti-nitrotyrosine or an anti-S-nitroso-cysteine antibody (both 1:100) with 20ll of PureProteome protein A and protein G Magnetic Beads (Millipore). Immunoprecipitated proteins were sep- arated by SDS-PAGE and probed with an anti-MRP4 or an anti-MRP5 antibody, as described above. The densitomet- ric analysis of Western blots was performed using ImageJ software (http://rsb.info.nih.gov/ij/) and expressed as arbi- trary units.
Immunofluorescence confocal microscopy analysis
50 ll of packed and washed RBCs (59108 cells), obtained as previously described [21], was fixed overnight in 10 ml of paraformaldehyde 2–4 % in PBS under con- stant agitation at room temperature (RT). Fixed RBCs were then washed three times and resuspended in PBS to a 500 ll final volume. For permeabilization, this suspension was mixed thoroughly in 5 ml of 0.2 % SDS in PBS for 1 min at RT. After removing the SDS by washing with PBS, the cells were incubated in BSA 1 % for 20 min at RT. Finally, the erythrocytes were resuspended in BSA 0.1 % solution in PBS (final suspension 50ll RBCs/250ll BSA 0.1 %), and divided into samples of 50ll for diverse immune labeling. Each sample was incubated for 2 h at RT with anti-eNOS antibody, and/or with anti-phospho-eNOS (Ser1177), or with Anti-Glycophorin A. The secondary antibodies Cy3 goat anti-mouse and/or Alexa-488 goat anti-rabbit were incubated for 1 h at RT. Samples for nuclear staining were meanwhile incubated with TO-PRO 3 IODIDE for 15 min at RT. Negative controls were obtained, incubating with secondary antibodies alone.
Finally, stained RBCs were resuspended in BSA 0.1 % in PBS (10 ll RBCs/35ll tot) and 10ll of this suspension was mounted with Slowfade (molecular probe) on poly-L- lysineted coverslips and then observed under a ZEISS 510META confocal microscope. Images were acquired using LSM 510 META (rel. 3.0, ZEISS) confocal micro- scopy software (rel. 3.0, ZEISS).
Flow cytometry analysis
For Fluorescence Cytometry, packed and washed RBCs were fixed and permeabilized as described for Immunofluorescence Confocal Microscopy (10ll of starting RBCs, corresponding to 19108 cells, for each final stain). After incubation in BSA 1 % for 20 min at RT, erythrocytes were resuspended in BSA 0.1 % and divided into samples of 50 ll for diverse immune labeling, at final concentrations of 10ll RBCs/50ll suspension. For RBC-NOS determination, each sample was incubated for 2 h at RT with anti-eNOS antibody, and/or with anti-phospho-eNOS (Ser1177). The secondary antibodies PE goat anti-mouse and/or Alexa-488 goat anti-rabbit were incubated for 1 h at RT. Negative controls were obtained, incubating only with secondary antibodies. Finally, stained RBCs were resuspended in PBS (10ll RBCs/2 ml PBS) and each sample was analyzed using a FACSCalibur Analyzer (BD Biosciences). Intracellular protein levels were evaluated in 10,000 events for each sample by cytofluorimetric analysis and expressed as a DMean Fluorescence Intensity (M.F.I.) Ratio. TheDM.F.I. Ratio was calculated by subtracting the value of the M.F.I. of negative events (M.F.I. of a secondary antibody) from that of positive events, and then dividing by the M.F.I. of negative events.
Measurement of NO production by DAF-2DA
NO production by RBC-NOS in living erythrocytes was monitored using the cell-permeable diacetate derivative of 4,5-diamino-fluorescein (DAF-2DA) [39–41] by Flow Cytometry detection of fluorescent triazolofluorescein, produced by DAF-2DA intracellular hydrolyzed form (DAF-2) reaction with NO produced by NOS. The analysis was done in the presence ofL-Arginine (100 lM), and with stimulation by Ionomycin (2lM) or Insulin (100 nM) for 10 min, with and without selective NOS inhibitors (L- NAME, 1 mM). Briefly, 200 ll of packed and washed RBCs (ESRD and C) was resuspended in EBM Medium-L- Arginine at a 10ll RBCs/500ll final concentration and incubated with DAF-2DA (10lM) for 30 min at 37°C in the dark. In some experiments, L-NAME (1 mM) was added 45 min before loading with DAF-2DA. After extensive washes, the erythrocytes were resuspended in PBS-L-Arginine and stimulated as described above. The Mean Fluorescence Intensity Ratio (M.F.I. Ratio) was recorded for 20 min after stimulation, being sampled every minute using a FACSCalibur Analyzer (BD Biosciences).
Evaluation of intracellular cGMP levels
For intracellular cGMP level evaluation, 500ll of packed and washed RBCs (ESRD and C) was treated as described
for the measurement of in vivo NOS activity by DAF-2DA.
Intracellular cGMP was isolated by hydrochloric acid (0.1 M HCl) precipitation and processed following the Enzyme immunoassay (EIA) procedure according to the instructions provided by the supplier (code RPN226, Kit Biotrak, Amersham Pharmacia Biotec.).
MRP4 ATPase activity
To determine MRP4 ATPase activity, 500lg of membrane proteins was immunoprecipitated with an anti-MRP4 antibody (1:100), as detailed in the Western blot analysis section. Samples (100lg/protein each) were incubated for 30 min at 37 °C in 50ll of the reaction mix (25 mM Tris pH 7.0, 3 mM ATP, 50 mM KCl, 2.5 mM MgSO4, 3 mM dithiothreitol, 0.5 mM EGTA, 2 mM ouabain, 3 mM mol/l sodium azide). In each set of experiments, a blank con- taining 0.5 mmol/l sodium orthovanadate was included.
The reaction was stopped by adding 200ll ice-cold stop- ping buffer (0.2 % w/v ammonium molybdate, 1.3 % v/v H2SO4, 0.9 % w/v SDS, 2.3 % w/v trichloroacetic acid, 1 % w/v ascorbic acid). After 30-min incubation at RT, the absorbance of the phosphate hydrolyzed from ATP was measured at 620 nm, using a Packard EL340 microplate reader (Bio-Tek Instruments, Winooski, MA). The absor- bance was converted into nM hydrolyzed phosphate/min/
mg prot, according to the titration curve previously prepared.
Statistical analysis
All experiments were repeated at least three times and results are presented as means±standard deviation (SD).
Differences between the two population groups (C and ESRD) and between the different in vitro experimental conditions were analyzed by Student’s ttest. Significance was defined as a pvalue less than 0.05.
Results NO content
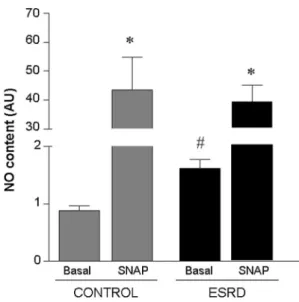
We first aimed to assess by electron paramagnetic reso- nance (EPR) spectroscopy whether the total NO content was different between RBCs from control subjects and ESRD patients. As shown in Fig.1, basal NO content was significantly higher in ESRD- than in C-RBCs. As expec- ted, the NO donor (SNAP) significantly increased the NO content in both C- and ESRD-RBCs as compared to baseline.
RBC-NOS expression and phosphorylation levels
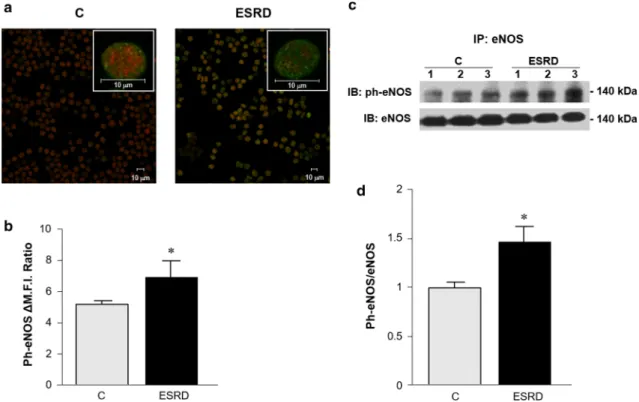
We accordingly evaluated the RBC-NOS levels in both ESRD- and C-RBCs. As shown in Fig.2, RBC-NOS pro- tein levels were significantly lower in ESRD- than in C-RBCs. To evaluate the potential differences in the mechanisms of NOS activation between ESRD- and C-RBCs, we determined by immunostaining the Ser1177- eNOS phosphorylation (ph-eNOS, labeled in green) and total RBC-NOS levels (labeled in red). As shown in
Fig.3a, ESRD-RBCs revealed both higher ph-eNOS levels than C-RBCs and cytoplasmic localization of it (Fig.3a, merge panel insets), indicating increased RBC-NOS translocation to the cytoplasm [42,43] where the enzyme becomes more phosphorylated and might also be more active in ESRD-than C-RBCs. Co-incubation with anti- bodies directed toward RBC-specific glycophorin A indi- cated that RBCs were uniformly positive for the eNOS protein (data not shown). These data were confirmed by flow cytometry and Western blot analysis (Fig.3b, left and right panel, respectively) that showed significantly higher ph-eNOS levels in ESRD- than C-RBCs (Fig.3b left panel, DM.F.I. 7±0.9 and 5±0.1, respectively).
RBC-NOS signaling complex activation
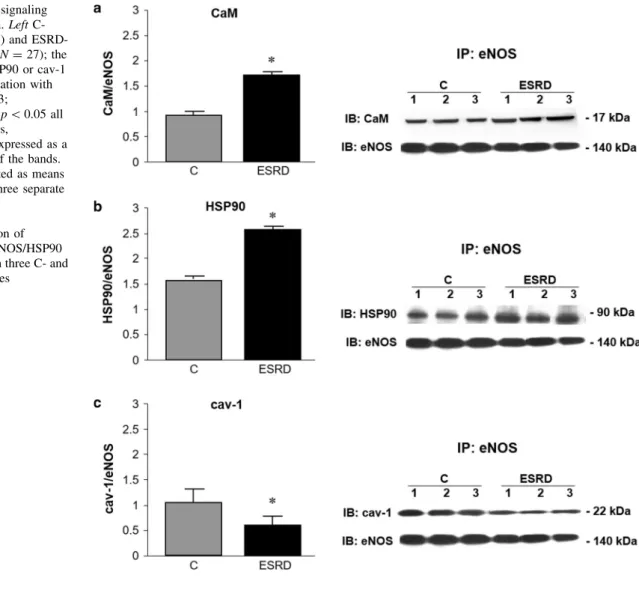
Next, we assessed the interaction levels of RBC-NOS with caveolin-1 (cav-1), calmodulin (CaM), and heat shock protein-90 (HSP90), known to be involved in the eNOS activation process in endothelial cells [42] and conjec- turally inside erythrocytes [43]. As shown in Fig.4, the CaM/HSP90/eNOS association was significantly higher in ESRD- than in C-RBCs (Fig.4a, 1.7±0.06-fold and 0.93±0.06-fold, respectively, and Fig.4b, 2.55±0.05- fold and 1.55±0.04-fold, respectively), while cav-1 was significantly less co-immunoprecipitated with RBC-NOS in ESRD- than C-RBCs (Fig.4c, 0.63±0.05-fold and 1.02±0.2-fold, respectively).
NO production in basal and stimulated RBCs
To further characterize RBC-NOS activity in ESRD-RBCs, we evaluated NO production in intact erythrocytes at baseline and after time-dependent stimulation (0–10 min) with insulin (100 nM) or ionomycin (2lM), known to activate eNOS respectively via phosphorylation- and cal- cium-dependent pathways [42]. All the experiments were performed in the presence or absence of L-NAME, a specific inhibitor of NOS activity. Interestingly, as shown in Fig.5a (right panel), the fluorescence of 4,5-diamino- fluorescein (DAF-2), which depends on the amount of intracellular NO levels, proved to be increased in both C- and ESRD-RBCs after insulin stimulation, although its effect was significantly greater in C- than ESRD-RBCs. In parallel, ionomycin (Fig.5a, left panel) significantly increased DAF-2DA fluorescence in both C- and ESRD- RBCs and, likewise insulin, NO production was again significantly higher in C-than ESRD-RBCs. Moreover, for both C- and ESRD-RBCs, pre-incubation with L-NAME fully inhibited both insulin- and ionomycin-stimulated RBC-NOS activity, demonstrating a NOS-dependent pro- duction of NO. As expected and according to the EPR data, Fig. 1 NO content. EPR spectroscopy measurement of NO content in
C- (N=6) and ESRD-RBCs (N=5) at baseline (basal) or in presence of the NO donor SNAP (10-4M). Results are presented as means ± SEM of at least three separate experiments and are expressed as arbitrary units (AU). #p=0.002 basal ESRD versus Basal C. *p\0.001 SNAP versus Basal
Fig. 2 RBC-NOS expression levels. eNOS protein expression in C- and ESRD-RBCs as measured by Western blot analysis. Results are presented as means±SD of at least three separate experiments and are expressed as a red cell eNOS ratio. Ratio stands for fold increases of RBC-NOS in C- and ESRD-RBCs versus control HUVECs.
*p\0.05 ESRD versus C
basal NO levels were significantly higher in ESRD- than C-RBCs (Fig.5a).
cGMP levels in basal and stimulated RBCs
We went on to measure intracellular cGMP levels in both C- and ESRD-RBCs. As shown in Fig.5b, basal cGMP levels were significantly higher in ESRD- than C-RBCs.
Both insulin and ionomycin treatments significantly increased cGMP levels in C-RBCs, while in ESRD-RBCs cGMP levels proved to be significantly lower than basal condition. As expected, pre-incubation with L-NAME inhibited both insulin- and ionomycin-increased intracel- lular cGMP content, both in C- and in ESRD-RBCs.
cGMP transporter (MRP4 and MRP5) expression, nitration and/or nitrosation levels and activity in RBC membrane fractions
The bioavailable NO activates soluble guanylate cyclase (sGC) with a subsequent increase in cGMP content.
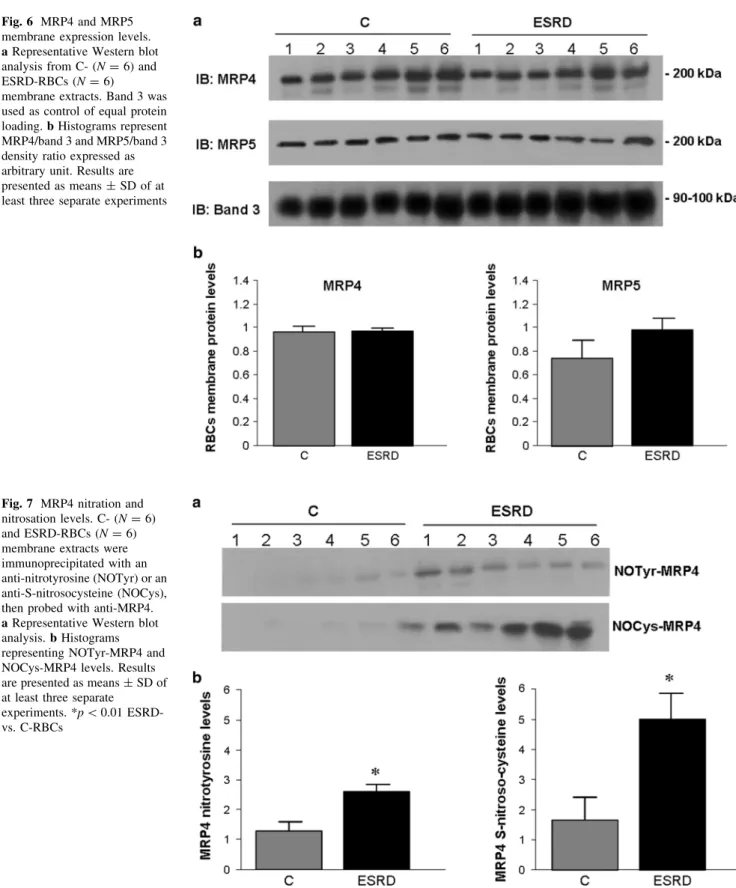
However, we supposed that the observed cGMP increase in ESRD-RBCs might also be ascribed to intracellular accu- mulation of it. For this purpose, we examined the expres- sion of MRP4 and MRP5 transporters, known to be capable of transferring cGMP out of erythrocytes. As shown in Fig.6, MRP4 and MRP5 were detected in RBC membrane fractions with no significant differences between C- and ESRD-RBCs.
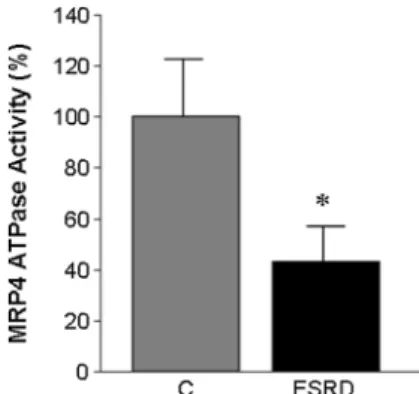
Since it is known that nitration or nitrosation may lead to inactivation of these transporters, we evaluated their levels. The overall pattern of nitrated and nitrosated membrane proteins was similar (Supplementary Fig. S1), although specific bands were slightly more nitrated and nitrosated in ESRD- than C-RBCs. Notably, MRP4 was significantly more nitrated on tyrosine and more nitrosated in cysteine in ESRD- than C-RBCs (Fig.7). Neither nitration nor nitrosation was detected on MRP5 in either C- or ESRD-RBCs (data not shown).
Hence, we measured the ATPase activity of MRP4 which proved significantly lower in ESRD- than C-RBCs (Fig.8), suggesting impaired cGMP efflux from ESRD-RBCs.
Fig. 3 RBC-NOS phosphorylation levels. a eNOS and ph-eNOS immunolocalization in C- and ESRD-RBCs. eNOS (labeled inred) and ph-eNOS (labeled in green) were detected in RBCs using immunofluorescence confocal microscopy (original magnification 9400, bars indicate 10lm). The higher magnification (inset in merge panels, original magnification91000, bars indicate 10lm) shows in detail the subcellular localization of eNOS and ph-eNOS.bSer1177- eNOS phosphorylation levels (ph-eNOS) as measured by flow cytometry and expressed as a DMean Fluorescence Intensity
(M.F.I.) Ratio. (*p\0.05 ESRD- vs. C-RBCs). c Representative Western blot of eNOS and ph-eNOS immunoprecipitate levels in three C- and ESRD-RBC samples. Samples were probed for ph-eNOS first and then re-probed for total NOS.deNOS phosphorylation levels as measured by Western blot. The ratio of ph-eNOS co-immunopre- cipitation with eNOS is expressed as a relative intensity of the bands.
Results are presented as means ± SD of at least three separate experiments. (*p\0.03 ESRD- vs. C-RBCs). (Color figure online)
Discussion
In this study, we have, for the first time, determined RBC- NOS expression and activity, NO and cGMP levels in erythrocytes in patients suffering from end-stage renal disease.
Our results showed that both control and ESRD ery- throcytes express functional RBC-NOS and, notably, the level of this last was significantly lower in ESRD- than C-RBCs. Surprisingly, although we were expecting a par- allel decrease in RBC-NOS activity, we found that its activation, NO, and cGMP levels were all significantly greater in ESRD- than C-RBCs.
Moreover, intracellular NO and cGMP levels were increased in both C- and ESRD-RBCs after insulin or ionomycin stimulation, although their effects were sig- nificantly greater in C- than ESRD-RBCs. This indicates that the uremic condition might reduce the RBC-NOS response to these stimuli possibly due to biochemical or metabolic alterations such as increased insulin resistance
[44]. As mentioned above, in our study, we found that basal RBC-NOS was significantly more activated in ure- mic erythrocytes than in controls. There are indeed studies indicating that, under several pathological condi- tions, certain mechanisms that compensate deficient NO production may be activated [25, 28, 45]. In particular, these mechanisms include plasma oxidative stress, a condition existing in uremia [46, 47], which can cause a paradoxical increase in RBC-NOS activity [48]. In addi- tion, shear stress, by increasing Ca2? influx into RBC cytoplasm as well as ph-eNOS levels, may lead to RBC- NOS activation through a mechanism involving cav-1, HSP90, and CaM [43,49].
Again, we have previously demonstrated that phos- phatidylserine exposure on the surface of RBC from ESRD patients increases RBC-human umbilical vein endothelial cell interactions, thus suggesting that modified ESRD- RBCs might also show abnormal RBC-NOS activation, possibly due to enhanced cytoadherence and locally increased mechanical forces [20,49,50].
Fig. 4 RBC-NOS signaling complex activation.LeftC- (gray bars N=18) and ESRD- RBCs (black bars N=27); the ratios of CaM, HSP90 or cav-1 co-immunoprecipitation with eNOS (a*p\0.03;
b*p\0.01 orc*p\0.05 all ESRD- vs. C-RBCs,
respectively) are expressed as a relative intensity of the bands.
Results are presented as means
±SD of at least three separate experiments.Right
representative immunoprecipitation of aeNOS/CaM,beNOS/HSP90 orceNOS/cav-1 in three C- and ESRD-RBC samples
Subsequently, we demonstrated that RBC-NOS from ESRD-RBCs disrupted the eNOS/cav-1 interaction on the plasma membrane and increased CaM binding, possibly activating the enzyme and inducing translocation to the cytoplasm where eNOS bound to HSP90 became more phosphorylated and synthesized more NO (Figs.3,4) [42, 51–53].
Although NO generated by red cell NOS may not rep- resent a physiologically important fraction of total NO bioavailability [54], in this instance we may hypothesize compensatory NO synthesis on the part of uremic RBCs which are, of course, an important factor contributing to local hemodynamic. Thus, the relatively fast increase in intracellular NO concentration in response to local increased mechanical forces would be expected to improve RBC deformability and blood flow, especially at the microcirculatory level [7,9,54].
Additionally, the demonstrated increase in uremic RBC- NOS activation proved similar to that found in erythrocytes from patients with sickle cell anemia [25], there being
significant increased RBC-NOS activity, though the enzyme expression was slightly lower than in healthy subjects.
Patients with ESRD invariably suffer from anemia, which is considered to result in large part from impaired renal EPO and subsequent decrease in erythropoiesis, and to a lesser extent from accelerated eryptosis [3].
On this basis, and since it has been shown that the use of EPO might lead to higher RBC-derived NO levels [55,56], one might speculate that the EPO treatment used to break down the anemic state in ESRD patients might be one of the mechanisms involved in the increased RBC-NOS activity observed. To this end we performed some exper- iments in which RBC-NOS expression and activation of it by phosphorylation in ESRD-RBCs proved comparable among patients treated with EPO or not (ph-eNOS:DM.F.I.
ratio 6±0.5 and 5.8±0.4, six treated and six untreated patients, respectively).
Again, since EPO administration had been shown to produce in the circulation an immediate increase in the number of immature erythrocytes known as reticulocytes Fig. 5 Basal and stimulated NO production and cGMP levels. C- and
ESRD-RBCs (N=18 andN=27, respectively) at baseline (Basal) and stimulated with insulin (Ins, 100 nM) or ionomycin (Ion, 2lM) in the presence or absence of the NOS inhibitor L-NAME (1 mM, Ion?L-N or Ins?L-N). Results are presented as means±SD of at least three separate experiments.aNO production measured by flow cytometry and expressed as a DAF-2DA Mean Fluorescence Intensity Ratio (M.F.I. Ratio).Left#p\0.05 basal C- vs. basal ESRD-RBCs;
*p\0.05 Ins vs. basal C- and ESRD-RBCs; p\0.05 Ins C- vs. Ins ESRD-RBCs. Right #p\0.05 basal C- vs. basal ESRD-RBCs;
*p\0.03 Ins vs. basal C- and ESRD-RBCs; p\0.05 Ins C- vs. Ins ESRD-RBCs. b cGMP levels measured by EIA assay in C- (gray bars) and ESRD-RBCs (black bars). *p\0.03 Ins- vs. basal C-RBCs; **p\0.05 Ion- vs. basal C-RBCs; #p\0.01 basal ESRD- vs. basal C-RBCs; p\0.05 Ins- vs. basal ESRD-RBCs; p\0.05 Ion- vs. basal ESRD-RBCs
[57], in order to ascertain that NOS activity did not derive from reticulocytes, we measured the number of these last.
We found that there were no more than 5 % of reticulo- cytes in patients, whether treated with EPO or not, and this
was comparable to healthy subjects. Thus, although our ESRD patients were on stabilized EPO treatment, we can rule this out from the potential mechanisms able to activate RBC-NOS in ESRD-RBCs.
Fig. 6 MRP4 and MRP5 membrane expression levels.
aRepresentative Western blot analysis from C- (N=6) and ESRD-RBCs (N=6)
membrane extracts. Band 3 was used as control of equal protein loading.bHistograms represent MRP4/band 3 and MRP5/band 3 density ratio expressed as arbitrary unit. Results are presented as means±SD of at least three separate experiments
Fig. 7 MRP4 nitration and nitrosation levels. C- (N=6) and ESRD-RBCs (N=6) membrane extracts were immunoprecipitated with an anti-nitrotyrosine (NOTyr) or an anti-S-nitrosocysteine (NOCys), then probed with anti-MRP4.
aRepresentative Western blot analysis.bHistograms representing NOTyr-MRP4 and NOCys-MRP4 levels. Results are presented as means±SD of at least three separate
experiments. *p\0.01 ESRD- vs. C-RBCs
Here, we also found increased cGMP levels in RBC from ESRD patients as compared to healthy control.
Interestingly, Reis et al. [58] demonstrated that transport of
L-arginine is activated in erythrocytes from ESRD patients irrespective of their nutritional status, thus resulting in a potential activation of RBC NO synthesis in uremia. Thus, the data presented here as well as data from an independent human study published several years ago [31] fully support this hypothesis.
Besides these mechanisms, the cGMP concentration achieved in RBCs results from a balance between synthesis and removal, so that the removal rate is as important as the production rate. It has been demonstrated that cGMP pro- duced within human erythrocytes can be eliminated by phosphodiesterases [59] or by active efflux transporters [60]. Wu et al. [32] found that different blood donors express different amounts of both MRP4 and MRP5 on their RBCs. These differences in expression were reflected in different cGMP uptake rates in inside-out erythrocyte membrane vesicles. Since RBCs from uremic patients show several modifications in the RBC membrane protein composition and function [61,62], this might compromise cGMP efflux through the membrane transporters. Our study is the first to have examined the levels of expression, nitration and/or nitrosation, and activity of MRP4 and MRP5 transporters. Although they proved equally expres- sed in C- and ESRD-RBC membranes (Fig.6), MRP4 was significantly more nitrated on tyrosine and more nitrosated on cysteine in ESRD- than in C-RBCs (Fig.7), while neither nitration nor nitrosation was detected on MRP5 in either group. In addition, the ATPase activity of MRP4 was significantly lower in ESRD- than C-RBCs (Fig.8), sug- gesting possible impaired efflux of cGMP across the ESRD-RBC membrane.
In conclusion, since whether and how erythrocyte RBC- NOS activity and/or signaling is potentially involved in
changes of RBC function in uremia has not been investi- gated so far, we here thought to document, for the first time, a significant increase of basal enzymatic NO pro- duction and accumulating cGMP levels, possibly to coun- teract the reduction in RBC-NOS expression within RBCs from uremic patients. We could further speculate that high NO production only partially affects cell function of ESRD-RBCs maybe because in vivo they are unable to respond to physiologic stimuli, such as calcium and/or insulin.
Thus, although further development and functional characterization of the mechanisms here described are needed, this study may help better define the role of RBC- NOS in the regulation of erythrocyte function in uremia and possibly to develop a strategy to improve RBC func- tions and extend cell life span in uremic erythrocytes.
Acknowledgments MCK and MK wish to thank the German Research Council (DFG CO 1305/2-1 to MCK, SFB1116 TP B06 to MCK und MK), the Susanne-Bunnenberg-Stiftung of the Du¨sseldorf Heart Center (to MK), CC was supported by a Ja´nos Bolyai Research Scholarship from the Hungarian Academy of Sciences. P.F. was a Szenta´gothai Fellow of the National Program of Excellence of Hun- gary (TAMOP 4.2.4.A/2-11-1-2012-0001).
References
1. Palis J (2014) Primitive and definitive erythropoiesis in mam- mals. Front Physiol 5:3. doi:10.3389/fphys.2014.00003 2. Brimble KS, McFarlane A, Winegard N, Crowther M, Churchill
DN (2006) Effect of chronic kidney disease on red blood cell rheology. Clin Hemorheol Microcirc 34:411–420
3. Abed M, Artunc F, Alzoubi K, Honisch S, Baumann D, Foller M, Lang F (2014) Suicidal erythrocyte death in end-stage renal disease. J Mol Med 92:871–879
4. Cortese-Krott MM, Kelm M (2014) Endothelial nitric oxide synthase in red blood cells: key to a new erythrocrine function?
Redox Biol 2:251–258. doi:10.1016/j.redox.2013.12.027 5. Bohmer A, Beckmann B, Sandmann J, Tsikas D (2012) Doubts
concerning functional endothelial nitric oxide synthase in human erythrocytes. Blood 119:1322–1323
6. Cortese-Krott MM, Rodriguez-Mateos A, Sansone R, Kuhnle GG, Thasian-Sivarajah S, Krenz T, Horn P, Krisp C, Wolters D, Heiss C, Kroncke KD, Hogg N, Feelisch M, Kelm M (2012) Human red blood cells at work: identification and visualization of erythrocytic eNOS activity in health and disease. Blood 120:4229–4237
7. Kleinbongard P, Schulz R, Rassaf T, Lauer T, Dejam A, Jax T, Kumara I, Gharini P, Kabanova S, Ozuyaman B, Schnurch HG, Godecke A, Weber AA, Robenek M, Robenek H, Bloch W, Rosen P, Kelm M (2006) Red blood cells express a functional endothelial nitric oxide synthase. Blood 107:2943–2951 8. Carvalho FA, Mesquita R, Martins-Silva J, Saldanha C (2004)
Acetylcholine and choline effects on erythrocyte nitrite and nitrate levels. J Appl Toxicol 24:419–427. doi:10.1002/jat.993 9. Bor-Kucukatay M, Wenby RB, Meiselman HJ, Baskurt OK
(2003) Effects of nitric oxide on red blood cell deformability. Am J Physiol Heart Circ Physiol 284:H1577–H1584
Fig. 8 MRP4 ATPase activity. ATPase activity was measured spectrophotometrically after immunoprecipitation of MRP4 from membrane fraction. Measurements were performed in duplicate and data are presented as means ± SD of at least three separate experiments. *p\0.05 ESRD- vs. C-RBCs
10. Grau M, Pauly S, Ali J, Walpurgis K, Thevis M, Bloch W, Suhr F (2013) RBC-NOS-dependent S-nitrosylation of cytoskeletal pro- teins improves RBC deformability. PLoS ONE 8:e56759. doi:10.
1371/journal.pone.0056759
11. Martinez M, Vaya A, Alvarino J, Barbera JL, Ramos D, Lopez A, Aznar J (1999) Hemorheological alterations in patients with chronic renal failure. Effect of hemodialysis. Clin Hemorheol Microcirc 21:1–6
12. Tonelli M, Bohm C, Pandeya S, Gill J, Levin A, Kiberd BA (2001) Cardiac risk factors and the use of cardioprotective medications in patients with chronic renal insufficiency. Am J Kidney Dis 37:484–489
13. Leskinen Y, Salenius JP, Lehtimaki T, Huhtala H, Saha H (2002) The prevalence of peripheral arterial disease and medial arterial calcification in patients with chronic renal failure: requirements for diagnostics. Am J Kidney Dis 40:472–479
14. Seliger SL, Gillen DL, Longstreth WT Jr, Kestenbaum B, Steh- man-Breen CO (2003) Elevated risk of stroke among patients with end-stage renal disease. Kidney Int 64:603–609
15. Morris ST, Jardine AG (2000) The vascular endothelium in chronic renal failure. J Nephrol 13:96–105
16. Manodori AB (2001) Sickle erythrocytes adhere to fibronectin- thrombospondin-integrin complexes exposed by thrombin-in- duced endothelial cell contraction. Microvasc Res 61:263–274 17. Hebbel RP, Boogaerts MA, Eaton JW, Steinberg MH (1980)
Erythrocyte adherence to endothelium in sickle-cell anemia. A possible determinant of disease severity. N Engl J Med 302:992–995
18. Styles LA, Lubin B, Vichinsky E, Lawrence S, Hua M, Test S, Kuypers F (1997) Decrease of very late activation antigen-4 and CD36 on reticulocytes in sickle cell patients treated with hydroxyurea. Blood 89:2554–2559
19. Bonomini M, Sirolli V, Gizzi F, Di Stante S, Grilli A, Felaco M (2002) Enhanced adherence of human uremic erythrocytes to vascular endothelium: role of phosphatidylserine exposure. Kid- ney Int 62:1358–1363
20. Bonomini M, Pandolfi A, Di Pietro N, Sirolli V, Giardinelli A, Consoli A, Amoroso L, Gizzi F, De Lutiis MA, Felaco M (2005) Adherence of uremic erythrocytes to vascular endothelium decreases endothelial nitric oxide synthase expression. Kidney Int 67:1899–1906
21. Pandolfi A, Di Pietro N, Sirolli V, Giardinelli A, Di Silvestre S, Amoroso L, Di Tomo P, Capani F, Consoli A, Bonomini M (2007) Mechanisms of uremic erythrocyte-induced adhesion of human monocytes to cultured endothelial cells. J Cell Physiol 213:699–709
22. Eligini S, Porro B, Lualdi A, Squellerio I, Veglia F, Chiorino E, Crisci M, Garlasche A, Giovannardi M, Werba JP, Tremoli E, Cavalca V (2013) Nitric oxide synthetic pathway in red blood cells is impaired in coronary artery disease. PLoS ONE 8:e66945 23. Porro B, Eligini S, Veglia F, Lualdi A, Squellerio I, Fiorelli S, Giovannardi M, Chiorino E, Dalla Cia A, Crisci M, Werba JP, Tremoli E, Cavalca V (2014) Nitric oxide synthetic pathway in patients with microvascular angina and its relations with oxida- tive stress. Oxid Med Cell Longev 2014:726539
24. Keymel S, Heiss C, Kleinbongard P, Kelm M, Lauer T (2011) Impaired red blood cell deformability in patients with coronary artery disease and diabetes mellitus. Horm Metab Res 43:760–765
25. Grau M, Mozar A, Charlot K, Lamarre Y, Weyel L, Suhr F, Collins B, Jumet S, Hardy-Dessources MD, Romana M, Lemonne N, Etienne-Julan M, Antoine-Jonville S, Bloch W, Connes P (2014) High red blood cell nitric oxide synthase activation is not associated with improved vascular function and red blood cell deformability in sickle cell anaemia. Br J Haematol 168(5):728–736
26. Conran N, Oresco-Santos C, Acosta HC, Fattori A, Saad ST, Costa FF (2004) Increased soluble guanylate cyclase activity in the red blood cells of sickle cell patients. Br J Haematol 124:547–554
27. Savu O, Iosif L, Bradescu OM, Serafinceanu C, Papacocea R, Stoian I (2015)L-arginine catabolism is driven mainly towards nitric oxide synthesis in the erythrocytes of patients with type 2 diabetes at first clinical onset. Ann Clin Biochem 52:135–143 28. Bizjak DA, Brinkmann C, Bloch W, Grau M (2015) Increase in
red blood cell-nitric oxide synthase dependent nitric oxide pro- duction during red blood cell aging in health and disease: a study on age dependent changes of rheologic and enzymatic properties in red blood cells. PLoS ONE 10:e0125206
29. Yang BC, Nichols WW, Mehta JL (1996) Cardioprotective effects of red blood cells on ischemia and reperfusion injury in isolated rat heart: release of nitric oxide as a potential mecha- nism. J Cardiovasc Pharmacol Ther 1:297–306
30. Mendes Ribeiro AC, Brunini TM, Ellory JC, Mann GE (2001) Abnormalities in L-arginine transport and nitric oxide biosyn- thesis in chronic renal and heart failure. Cardiovasc Res 49:697–712
31. DeBari VA, Bennun A (1982) Cyclic GMP in the human ery- throcyte. Intracellular levels and transport in normal subjects and chronic hemodialysis patients. Clin Biochem 15:219–221 32. Wu CP, Woodcock H, Hladky SB, Barrand MA (2005) cGMP
(guanosine 3’,5’-cyclic monophosphate) transport across human erythrocyte membranes. Biochem Pharmacol 69:1257–1262 33. Kirca M, Kleinbongard P, Soetkamp D, Heger J, Csonka C,
Ferdinandy P, Schulz R (2015) Interaction between Connexin 43 and nitric oxide synthase in mice heart mitochondria. J Cell Mol Med 19:815–825
34. Ferdinandy P, Csont T, Csonka C, Torok M, Dux M, Nemeth J, Horvath LI, Dux L, Szilvassy Z, Jancso G (1997) Capsaicin- sensitive local sensory innervation is involved in pacing-induced preconditioning in rat hearts: role of nitric oxide and CGRP?
Naunyn Schmiedebergs Arch Pharmacol 356:356–363
35. Mulsch A, Vanin A, Mordvintcev P, Hauschildt S, Busse R (1992) NO accounts completely for the oxygenated nitrogen species generated by enzymicL-arginine oxygenation. Biochem J 288(Pt 2):597–603
36. Csont T, Pali T, Szilvassy Z, Ferdinandy P (1998) Lack of cor- relation between myocardial nitric oxide and cyclic guanosine monophosphate content in both nitrate-tolerant and -nontolerant rats. Biochem Pharmacol 56:1139–1144
37. Csonka C, Pali T, Bencsik P, Gorbe A, Ferdinandy P, Csont T (2014) Measurement of NO in biological samples. Br J Pharmacol 172(6):1620–1632
38. Wood KC, Cortese-Krott MM, Kovacic JC, Noguchi A, Liu VB, Wang X, Raghavachari N, Boehm M, Kato GJ, Kelm M, Gladwin MT (2013) Circulating blood endothelial nitric oxide synthase contributes to the regulation of systemic blood pressure and nitrite homeostasis. Arterioscler Thromb Vasc Biol 33:
1861–1871
39. Kojima H, Sakurai K, Kikuchi K, Kawahara S, Kirino Y, Nagoshi H, Hirata Y, Nagano T (1998) Development of a fluorescent indicator for nitric oxide based on the fluorescein chromophore.
Chem Pharm Bull 46:373–375
40. Nakatsubo N, Kojima H, Kikuchi K, Nagoshi H, Hirata Y, Maeda D, Imai Y, Irimura T, Nagano T (1998) Direct evidence of nitric oxide production from bovine aortic endothelial cells using new fluorescence indicators: diaminofluoresceins. FEBS Lett 427:
263–266
41. Navarro-Antolin J, Lamas S (2001) Nitrosative stress by cyclosporin A in the endothelium: studies with the NO-sensitive probe diaminofluorescein-2/diacetate using flow cytometry.
Nephrol Dial Transplant 16(Suppl 1):6–9
42. Fleming I (2010) Molecular mechanisms underlying the activa- tion of eNOS. Pflugers Arch 459:793–806
43. Ozuyaman B, Grau M, Kelm M, Merx MW, Kleinbongard P (2008) RBC NOS: regulatory mechanisms and therapeutic aspects. Trends Mol Med 14:314–322
44. Liao MT, Sung CC, Hung KC, Wu CC, Lo L, Lu KC (2012) Insulin resistance in patients with chronic kidney disease.
J Biomed Biotechnol 2012:691369
45. da Silva CD, Brunini TM, Reis PF, Moss MB, Santos SF, Roberts NB, Ellory JC, Mann GE, Mendes-Ribeiro AC (2005) Effects of nutritional status on theL-arginine-nitric oxide pathway in pla- telets from hemodialysis patients. Kidney Int 68:2173–2179 46. Libetta C, Sepe V, Esposito P, Galli F, Dal Canton A (2011)
Oxidative stress and inflammation: implications in uremia and hemodialysis. Clin Biochem 44:1189–1198
47. Popolo A, Autore G, Pinto A, Marzocco S (2013) Oxidative stress in patients with cardiovascular disease and chronic renal failure.
Free Radic Res 47:346–356
48. Xu H, Pritchard KA Jr (2008) Targeted increases in endothelial cell superoxide anion production stimulate eNOS-dependent nitric oxide production, not uncoupled eNOS activity. Arte- rioscler Thromb Vasc Biol 28:1580–1581
49. Ulker P, Yaras N, Yalcin O, Celik-Ozenci C, Johnson PC, Meiselman HJ, Baskurt OK (2011) Shear stress activation of nitric oxide synthase and increased nitric oxide levels in human red blood cells. Nitric Oxide 24:184–191
50. Ulker P, Sati L, Celik-Ozenci C, Meiselman HJ, Baskurt OK (2009) Mechanical stimulation of nitric oxide synthesizing mechanisms in erythrocytes. Biorheology 46:121–132
51. Govers R, Rabelink TJ (2001) Cellular regulation of endothelial nitric oxide synthase. Am J Physiol Renal Physiol 280:F193–
F206
52. Dimmeler S, Fleming I, Fisslthaler B, Hermann C, Busse R, Zeiher AM (1999) Activation of nitric oxide synthase in endothelial cells by Akt-dependent phosphorylation. Nature 399:601–605
53. Di Pietro R, Mariggio MA, Guarnieri S, Sancilio S, Giardinelli A, Di Silvestre S, Consoli A, Zauli G, Pandolfi A (2006) Tumor
necrosis factor-related apoptosis-inducing ligand (TRAIL) regu- lates endothelial nitric oxide synthase (eNOS) activity and its localization within the human vein endothelial cells (HUVEC) in culture. J Cell Biochem 97:782–794
54. Chen K, Pittman RN, Popel AS (2009) Hemorrhagic shock and nitric oxide release from erythrocytic nitric oxide synthase: a quantitative analysis. Microvasc Res 78:107–118
55. Lipsic E, Voors AA, van Veldhuisen DJ (2006) Serum erythro- poietin levels and infarct size. J Am Coll Cardiol 47:468–469 (author reply 469–70)
56. Mihov D, Vogel J, Gassmann M, Bogdanova A (2009) Erythro- poietin activates nitric oxide synthase in murine erythrocytes. Am J Physiol Cell Physiol 297:C378–C388
57. Krzyzanski W, Perez-Ruixo JJ (2007) An assessment of recom- binant human erythropoietin effect on reticulocyte production rate and lifespan distribution in healthy subjects. Pharm Res 24:758–772
58. Reis PF, da Silva CD, Brunini TM, Moss MB, Siqueira MA, Santos SF, Roberts NB, Ellory JC, Mann GE, Mendes-Ribeiro AC (2006) Plasma amino acid profile andL-arginine uptake in red blood cells from malnourished uremic patients. J Ren Nutr 16:325–331
59. Petrov V, Fagard R, Lijnen P (1998) Human erythrocytes contain Ca2?, calmodulin-dependent cyclic nucleotide phosphodi- esterase which is involved in the hydrolysis of cGMP. Methods Find Exp Clin Pharmacol 20:387–393
60. Sager G (2004) Cyclic GMP transporters. Neurochem Int 45:865–873
61. Bonomini M, Sirolli V, Merciaro G, Antidormi T, Di Liberato L, Brummer U, Papponetti M, Cappelli P, Di Gregorio P, Arduini A (2005) Red blood cells may contribute to hypercoagulability in uraemia via enhanced surface exposure of phosphatidylserine.
Nephrol Dial Transplant 20:361–366
62. Corry DB, Lee DB, Tuck ML (1987) A kinetic study of cation transport in erythrocytes from uremic patients. Kidney Int 32:256–260