ARTICLE
Age trajectories of glycaemic traits in non-diabetic South Asian and white individuals: the Whitehall II cohort study
Satoyo Ikehara&Adam G. Tabák&Tasnime N. Akbaraly&
Adam Hulmán&Mika Kivimäki&Nita G. Forouhi&
Hiroyasu Iso&Eric J. Brunner
Received: 23 July 2014 / Accepted: 27 October 2014 / Published online: 28 November 2014
#The Author(s) 2014. This article is published with open access at Springerlink.com
Abstract
Aims/hypothesis South Asian individuals have an increased prevalence of type 2 diabetes, but little is known about the development of glycaemic traits in this ethnic group. We compared age-related changes in glycaemic traits between non-diabetic South Asian and white participants.
MethodsIn a prospective British occupational cohort with 5-yearly clinical examinations (n=230/5,749 South Asian/
white participants, age 39–79 years at baseline), age-related trajectories of fasting glucose (FG) and 2 h post-load glucose (PLG), log-transformed fasting insulin (FINS) and 2 h post- load insulin (PLINS), HOMA insulin sensitivity (HOMA2-%S) and HOMA insulin secretion (HOMA2-%B)
were fitted for South Asian and white individuals who remained free of diabetes between 1991 and 2009.
Results In sex-adjusted multilevel models, FG was stable in white participants but increased with age in South Asians (0.12 [SE = 0.04] mmol/l per decade). PLG, FINS and PLINS levels were lower among white participants (by 0.271 [SE=0.092] mmol/l, 0.306 [SE=0.046] log pmol/l, 0.707 [SE=0.059] log pmol/l at age 50, respectively) com- pared with South Asians, although their age-related trajectories were parallel. HOMA2-%S was higher (0.226 [SE=0.038] at age 50) and HOMA2-%B lower (by 0.189 [SE=0.026] at age 50) among white than South Asian participants. The age- related decline in HOMA2-%S was similar in these groups, but the age-related increase in HOMA2-%B was greater in white participants (0.04 [SE=0.02] per decade). This differ- ence was explained by obesity, lifestyle and social status.
Conclusions/interpretation Findings from a diabetes-free population suggest an inadequate pancreatic beta cell reserve in South Asians, as a significantly steeper age-related increase in FG was observed in this ethnic group compared with white individuals.
Keywords Cohort study . Ethnicity . Fasting glucose . Fasting insulin . Glycaemic trajectory . Insulin resistance . Insulin secretion . Insulin sensitivity . Post-load glucose . South Asian
Abbreviations
FG Fasting glucose
FINS Fasting insulin
HOMA2-%S HOMA of insulin sensitivity HOMA2-%B HOMA of insulin secretion PLG 2 h post-load glucose PLINS 2 h post-load insulin S. Ikehara and A. G. Tabák contributed equally to this study.
S. Ikehara
:
A. G. Tabák (*):
T. N. Akbaraly:
M. Kivimäki:
E. J. Brunner
Department of Epidemiology and Public Health, University College London, 1-19 Torrington Place, London WC1E 6BT, UK
e-mail: a.tabak@ucl.ac.uk S. Ikehara
:
H. IsoPublic Health, Department of Social and Environmental Medicine, Graduate School of Medicine, Osaka University, Osaka, Japan A. G. Tabák
First Department of Medicine, Semmelweis University Faculty of Medicine, Budapest, Hungary
T. N. Akbaraly
Inserm U1061, Université Montpellier II, Montpellier, France A. Hulmán
Department of Medical Physics and Medical Informatics, University of Szeged, Szeged, Hungary
N. G. Forouhi
MRC Epidemiology Unit, Institute of Metabolic Science, University of Cambridge, Cambridge, UK
Introduction
The prevalence of diabetes is high and has dramatically in- creased among native and migrant Asian populations [1,2].
Approximately 20% of all individuals with diabetes (~71 million people) live in South Asia (Bangladesh, India, Nepal, Pakistan and Sri Lanka), with the prevalence of diabetes esti- mated to increase over the next decade [3]. Studies show that South Asians have a twofold to fivefold elevated risk of type 2 diabetes compared with white individuals in the UK [4–6].
Several potential explanations for an elevated risk of dia- betes among South Asians compared with white individuals have been proposed [1,2,7,8]. The case for reduced insulin sensitivity is well established in South Asians from childhood to adulthood, based on measures such as fasting insulin (FINS) or HOMA insulin sensitivity (HOMA2-%S), which are directly comparable across populations [9–16]. The role of insulin secretion remains equivocal [12,14]. Reduced insulin secretion (or pancreatic functional reserve) is a plausible aetiological factor in South Asians because fetal undernutri- tion is common in Asian populations and may lead to reduced growth of the pancreas [1]. However, beta cell function is difficult to study because measures of insulin secretion such as H O M A i n s u l i n s e c r e t i o n ( H O M A 2 - % B ) a n d t h e insulinogenic index do not account for the dependence of insulin secretion on blood glucose level and the underlying insulin sensitivity [17,18]. This complex association could be characterised by the disposition index, although its estimation is invasive and labour intensive, and it is therefore rarely used in population-based studies [17,18].
One way to overcome the barrier of estimating beta cell function is to describe parallel changes in insulin sensitivity and insulin secretion over time. We previously identified com- pensatory changes in insulin secretion among adults before diabetes diagnosis using this approach [19]. We hypothesised that, given an age-related decline in insulin sensitivity [19], the compensatory increase in insulin secretion would be less in South Asians than in white individuals, leading also to an increase in fasting glucose (FG), which supports the hypothesis of a reduced pancreatic functional reserve in South Asians. To study these questions, we assessed (1) age-related trajectories of FG, 2 h post-load glucose (PLG), FINS, 2 h post-load insulin (PLINS), insulin sensitivity and insulin secretion among non-diabetic South Asian and white participants using longitudinal data from the Whitehall II study, and (2) investi- gated potential mechanisms that might explain differences in these trajectories between South Asian and white populations.
Methods
Study population and designThe Whitehall II study was initiated in 1985 and recruited 10,308 participants (3,413
women) aged 35–55 years, with a response rate of 73%, from 20 London-based Civil Service departments [20]. The initial visit (phase 1) included a clinical examination and a self- administered questionnaire in 1985–1988. During the fol- low-up, 5-yearly clinical examinations were performed (Phase 3: 1991–1994; Phase 5: 1997–1999; Phase 7: 2002– 2004; Phase 9: 2007–2009) and additional postal questionnaire-only phases were conducted (Phase 2: 1988–
1990; Phase 4: 1995–1996; Phase 6: 2001; Phase 8: 2006).
The University College London Medical School Committee on the Ethics of Human Research provided ethical approval for the study, and written informed consent was obtained from all participants.
As a 75 g OGTT was first performed in phase 3; this provides the baseline for the current analysis. Of the 8,411 South Asian and white participants at baseline, 7,032 (282 South Asian and 6,750 white participants) remained free of diabetes during the follow-up and were eligible for the present study. After the exclusion of 319 participants with unavailable glucose levels, insulin values or missing covariates, 417 non-fasting (<8 h) participants, and 317 persons because of an afternoon sampling, the final dataset included 5,979 participants (230 South Asian and 5,749 white, i.e. 13,063 person-examinations) (Fig.1).
Of the potential 28,128 person-examinations that included four repeat measures for each of the 7,032 eligible partici- pants, we excluded 6,665 observations with unavailable glu- cose and insulin values or missing covariates, 5,919 observa- tions with non-fasting sampling (<8 h) and 2,481 observations due to afternoon sampling. Thus, the final dataset included 13,063 person-examinations for the 5,979 participants who took part in at least once of the four examinations every 5 years. Data were used for 87 South Asian participants with one observation, 70 with two observations, 48 with three observations and 25 with four observations, and for 1,692 white participants with one observation, 1,898 with two ob- servations, 1,532 with three observations and 627 with four observations (Fig.1).
Measurements Fasting and 2 h post-load venous blood sam- ples were taken during a 75 g OGTT according to standardised protocols during all phases of the study. Blood glucose was measured with the glucose oxidase method (YSI Corporation, Yellow Springs, OH, USA). Serum insulin was measured with an in-house human insulin RIA and later with a DAKO ELISA kit (Dako Cytomation Ltd, Ely, UK) [19].
Prevalent cases of diabetes (South Asian n= 31, white n=100) at phase 3 as well as incident cases were excluded based on a diagnosis either by an FG≥7.0 mmol/l or a PLG
≥11.1 mmol/l during the OGTT (South Asiann=40, whiten= 391), by the use of glucose-lowering medication (South Asian n=21, whiten=108) or by reporting doctor-diagnosed diabe- tes (South Asiann=40, whiten=263) at screening or during the additional questionnaire phases [19].
H O M A 2 - % S a n d H O M A b e t a c e l l f u n c t i o n (HOMA2-%B, a marker of insulin secretion) were calculated with the HOMA2 calculator version 2.2 (www.dtu.ox.ac.uk/
homacalculator/index.php) using FG (acceptable range 3–25 mmol/l) and FINS (acceptable range 20–400 pmol/l) measurements [21]. The BMI (the body weight in kilograms divided by the height in metres squared [kg/m2]) was measured according to standardised protocols.
Ethnicity was defined according to the Office for National Statistics 1991 census types. Self-reported ethnicity at phase 5 was mainly used; missing data were complemented by observer-assigned ethnicity from phase 1 [22]. The rates of agreement between observer-assigned and self-reported eth- nicity were high (93% for South Asian and 99.3% for white individuals). South Asians were defined as participants of Indian, Sri Lankan, Pakistani or Bangladeshi ethnic origin.
British Civil Service employment grade was used as a measure of occupational position and was grouped into three categories: high (senior administrators), intermediate (execu- tives, professionals and technical staff) and low (clerical and office support staff) [20].
Physical activity was assessed by the answers to questions on the frequency and duration of participation in moderate or vigorous physical activity at phase 3. At phases 5, 7 and 9, these questionnaires included 20 items on the frequency and duration of different physical activities that were used to calculate the hours per week spent at each intensity level.
Physical activity levels were classified as active (≥2.5 h/week of moderate or ≥1 h/week of vigorous physical activity), inactive (≤1 h/week of moderate and≤1 h/week of vigorous physical activity) or moderately active (if not active or inactive) [20].
Dietary patterns were based on the type of bread and milk most frequently consumed and the frequency of fruit and vegetable consumption (on an 8-point scale). First, each indi- cator was scored from 1 to 3 points. For the type of bread, this was: healthy (wholemeal, wheat meal or other brown bread)=1, moderately healthy (both healthy and unhealthy) = 2 or unhealthy (white bread)=3. For the type of milk, the scoring was: healthy (no milk, skimmed milk or other)=1, moderately healthy (semi-skimmed milk)=2 or unhealthy (whole milk)=3.
For the frequency of fruit and vegetable consumption, the
Whitehall II study baseline (1985−1988) n=10,308
Phase 3: baseline for current analysis (1991−1994) White/South Asian n=7,949/462
Potentially eligible participants (n=6,750/282) Potential PEs (n=28,128)
Participants with any available data (n=5,749/230) PEs (n=12,592/471)
FG n=5,849 PE n=12,078
PLG n=5,608 PE n=11,172
FINS n=5,591 PE n=11,183
PLINS n=5,596 PE n=11,109
HOMA2-%S n=5,344 PE n=10,268
HOMA2-%B n=5,344 PE n=10,268 Non-participants at phase 3
n=1,358
Prevalent diabetes mellitus (n=131) Lost to follow-up (n=383) Incident diabetes mellitus (n=865) White/South Asian
n=9,181/588
Non-white and non-South Asian n=539
No outcome or covariate (n=319, PE n=6,665) Non-fasting (n=417, PE n=5,919)
Afternoon sampling (n=317, PE n=2,481) Fig. 1 Flow chart of the selection
of participants for the current study. PE, person-examination
categories were: healthy (daily or≥2 times per day)=1, moder- ately healthy (≥1 times per week) = 2 or unhealthy (<3 times per month) = 3. The dietary score was calculated as the sum of the previous points classified into three groups: healthy (3 points), moderately healthy (4–7 points) or unhealthy (≥8 points) [23].
Statistical analysisTwo-samplettests andχ2tests were con- ducted to compare means and proportions, respectively, at baseline between South Asian and white individuals. FINS and PLINS levels, HOMA2-%S and HOMA2-%B were nat- ural log-transformed because of their skewed distribution.
Linear mixed models were used to assess age-related tra- jectories of glycaemic traits including FG, PLG, FINS, PLINS, HOMA2-%S and HOMA2-%B. These models use all available data and take into account the interrelationship between within-individual data points. First, we modelled differences in trajectories by ethnicity (South Asian or white) using the participants’age (centred at 50 years) as the under- lying time variable adjusted for sex, including ethnicity, age, age squared and their interaction terms and sex into the model.
As the age squared by ethnicity interaction did not improve the model fit and the term itself was not significant, we dropped this term from all the models. Furthermore, our results suggested that the FG trajectory was following a linear increase, and thus the quadratic age term was also dropped from this model.
Second, we further adjusted for occupational grade and time-varying BMI, physical activity and dietary score. For easier comparability of the models, we used the same specifi- cation for these multivariable adjusted models as for the sex- adjusted model.
Due to the fact that some people had available data on only one of the six glycaemic traits used for analysis, the final number of participants for the individual glycaemic traits is
lower than of the total population (n=5,979): 5,849 for FG, 5,608 for PLG, 5,591 for FINS, 5,596 for PLINS and 5,344 for HOMA2-%S and HOMA2-%B (Fig.1).
All statistical analyses were performed in Stata 12.1 (StataCorp, College Station, TX, USA), and statistical signif- icance was inferred at a two-tailedp<0.05.
Results
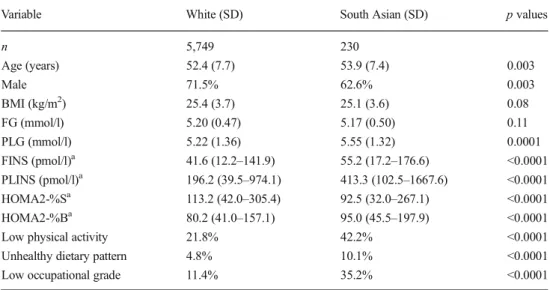
Table1shows the baseline characteristics by ethnicity of the participants who remained free of diabetes during the follow- up. Compared with their white counterparts, South Asian participants were 1.5 years older and more likely to be female.
They had 0.33 mmol/l higher PLG, 32.5% higher FINS, 110.7% higher PLINS, 18.3% lower HOMA2-%S and 18.3% higher HOMA2-%B levels. They were more likely to have low physical activity, follow an unhealthy diet and have a low occupational grade. There was no significant difference in BMI and FG between South Asians and white individuals.
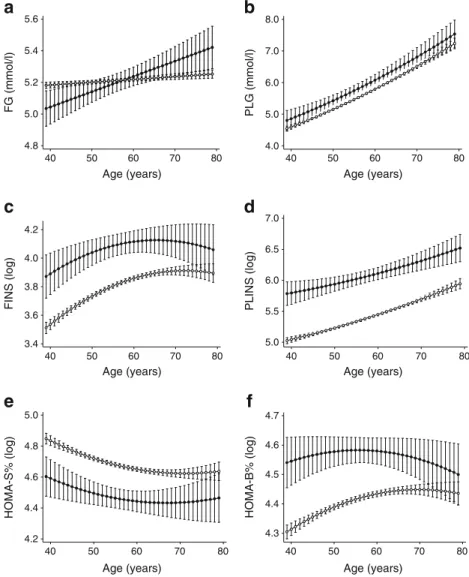
Figure 2a shows the age-related trajectories of FG by ethnicity adjusted for sex. FG followed a steep, linearly in- creasing age trajectory among South Asians (0.12 [SE=0.04]
mmol/l per decade). In contrast, the trajectory of FG was less steep (by 0.11 [SE=0.04] mmol/l per decade,pinteraction<0.01) for white individuals. Further adjustment for diet, physical activity and job grade had no major effect on the difference in the slope (Table2).
While the PLG was lower (by 0.271 [SE=0.092] mmol/l at age 50) among white compared with South Asian participants throughout the follow-up, the parabolic shape of the age- related trajectories was similar between ethnicities (absolute slope difference 0.01 [SE=0.08] mmol/l per decade) (Fig.2b).
Table 1 Baseline characteristics of study participants by ethnicity at the baseline examination
Data are mean (SD), geometric mean (95% CI) or percentages Comparisons were made using two-samplettests orχ2tests, as appropriate
HOMA2-%S and HOMA2-%B were calculated using HOMA2 calculator version 2.2 (Diabetes Trials Unit, University of Oxford, Oxford, UK) [23]
aLog-transformed before analysis due to the skewed distribution
Variable White (SD) South Asian (SD) pvalues
n 5,749 230
Age (years) 52.4 (7.7) 53.9 (7.4) 0.003
Male 71.5% 62.6% 0.003
BMI (kg/m2) 25.4 (3.7) 25.1 (3.6) 0.08
FG (mmol/l) 5.20 (0.47) 5.17 (0.50) 0.11
PLG (mmol/l) 5.22 (1.36) 5.55 (1.32) 0.0001
FINS (pmol/l)a 41.6 (12.2–141.9) 55.2 (17.2–176.6) <0.0001
PLINS (pmol/l)a 196.2 (39.5–974.1) 413.3 (102.5–1667.6) <0.0001
HOMA2-%Sa 113.2 (42.0–305.4) 92.5 (32.0–267.1) <0.0001
HOMA2-%Ba 80.2 (41.0–157.1) 95.0 (45.5–197.9) <0.0001
Low physical activity 21.8% 42.2% <0.0001
Unhealthy dietary pattern 4.8% 10.1% <0.0001
Low occupational grade 11.4% 35.2% <0.0001
Further multivariable adjustment had no major effect on these terms (Table2).
White participants had lower FINS and PLINS values (by 0.306 [SE=0.046] and 0.707 [SE=0.059] log pmol/l at age 50) across the age range compared with South Asians. Sex- adjusted age-related trajectories of FINS and PLINS followed a quadratic trend that became non-significant for FINS in the multivariate model (Fig.2c, dand Table2).
HOMA2-%S was higher (0.226 [SE=0.038] at age 50) and HOMA2-%B lower (by 0.189 [SE=0.026] at age 50) among white participants throughout the follow-up. Both HOMA values followed a quadratic age trajectory. HOMA2-%S de- clined similarly in white and South Asian individuals (abso- lute slope difference 0.02 [SE = 0.03] per decade).
HOMA2-%B increased more quickly (0.04 [SE=0.02] per decade) in white individuals in response to the decline in insulin sensitivity compared with South Asians in the sex- adjusted model. After multivariable adjustment, the quadratic trend became non-significant in both HOMA measures and showed parallel decreases for HOMA2-%S. The slope
difference of HOMA2-%B decreased to non-significance in the multivariable model; however, the actual slope term was negative (decreasing) for South Asians and positive (increasing) for white participants (Fig.2e, fand Table2).
Discussion
The analysis of age trajectories for glycaemic traits suggests inadequate insulin secretion among South Asians, leading to rising FG levels. In white individuals, insulin secretion showed compensatory increases in line with decreasing insu- lin sensitivity, providing stable FG values. These findings support the hypothesis that although South Asians have higher compensatory insulin secretion at younger ages, they are unable to produce further beta cell compensation in response to decreasing insulin sensitivity above 60 years of age. The major strength of this study is the use of the repeat measures of glycaemic traits to compare age-related trajectories among South Asian and white individuals over a wide age range.
4.8 5.2 5.4 5.6
5.0
40 50 60 70 80
4.3 4.4 4.5 4.6 4.7
40 50 60 70 80
4.0 6.0
5.0 8.0
7.0
40 50 60 70 80
Age (years)
Age (years) Age (years)
b
f
3.4 3.6 3.8 4.2 4.0
40 50 60 70 80
5.5 6.5
5.0 6.0 7.0
40 50 60 70 80
d
4.2 4.4 4.6 4.8 5.0
40 50 60 70 80
e
HOMA-B% (log)
Age (years)
FINS (log) PLINS (log)
Age (years)
HOMA-S% (log)FG (mmol/l) PLG (mmol/l)
Age (years)
a
c
Fig. 2 Estimated trajectories of glycaemic traits by age and ethnicity adjusted for sex: (a) FG, (b) PLG, (c) FINS, (d) PLINS, (e) HOMA2-%S and (f)
HOMA2-%B. Error bars show 95% CI around fixed effects.
Black circles, South Asian participants; white circles, white participants. HOMA2-%S and HOMA2-%B were calculated using HOMA2 calculator version 2.2 (Diabetes Trials Unit, University of Oxford, Oxford, UK) [23]
Table2FixedeffectsforlinearmixedmodelsofchangeforFG,PLG,FINS,PLINS,HOMA2-%SandHOMA2-%Basoutcomeswithageastheunderlyingtimevariable VariableFG(mmol/l)PLG(mmol/l)FINS(log)PLINS(log)HOMA2-%S(log)HOMA2-%B(log) Participants(n)5,8495,6085,5915,5965,3445,344 Person-examinations(n)12,07811,17211,18311,10910,26810,268 Sex-adjusted White0.085(0.044)−0.271(0.092)**−0.306(0.046)***−0.707(0.059)***0.226(0.038)***−0.189(0.026)*** Age0.012(0.0035)***0.067(0.0086)***0.011(0.004)0.019(0.005)***−0.007(0.003)*0.002(0.002) White×age−0.011(0.0035)**−0.001(0.008)0.005(0.0036)0.005(0.0045)−0.002(0.003)0.004(0.002)* Age2 –0.0004(0.0001)**−0.0004(0.00006)***0.0002(0.00008)***0.0002(0.00006)***−0.0002(0.00004)*** Multivariableadjusted White0.173(0.076)*−0.256(0.092)**−0.308(0.04)***−0.669(0.058)***0.233(0.033)***−0.236(0.030)*** Age0.0087(0.0027)*0.062(0.0085)***0.004(0.003)***0.016(0.005)***−0.003(0.003)−0.0011(0.0020) White×age−0.009(0.0027)**−0.004(0.008)0.0009(0.003)0.002(0.004)0.002(0.003)0.002(0.002) Age2 –0.0006(0.0001)***−0.00002(0.00005)0.0004(0.00007)***−0.00005(0.00005)0.00001(0.00003) Multivariableadjusted:adjustmentforBMI,sex,dietaryscore,physicalactivityandoccupationalgrade Agecentredat50years HOMA2-%SandHOMA2-%BwerecalculatedusingtheHOMA2calculatorversion2.2(DiabetesTrialsUnit,UniversityofOxford,Oxford,UK)[23] *p<0.05,**p<0.01,***p<0.001
We found that FG remained stable in white participants, whereas it increased rapidly with age in South Asians. PLG was higher among South Asians compared with white partic- ipants, but the respective quadratic trajectories were similar.
Furthermore, we observed that South Asians had higher FINS and PLINS levels, with parallel increases with ageing in both ethnicities. HOMA2-%S was lower among South Asian com- pared with white individuals and decreased similarly in both groups. HOMA2-%B was increased in South Asians at base- line, but they responded with a reduced compensatory in- crease despite similar decreases in HOMA2-%S compared with whites. These data suggest that long-standing decreased insulin sensitivity coupled with impaired beta cell compensa- tion provides the pathophysiological basis of the higher sus- ceptibility to an earlier onset of type 2 diabetes in this cohort of South Asian compared with white individuals.
The finding of constant fasting blood glucose with ageing in whites confirms our previous observation in the same cohort using fewer time points and a shorter follow-up [19].
The population-based cross-sectional Diabetes Epidemiology:
Collaborative analysis Of Diagnostic criteria in Asia (DECODA) study reported increases of 0.09–0.13 mmol/l per decade of age for FG in different Asian populations, which corresponds well to the slope of 0.11 mmol/l per decade observed in the current study [12]. As we excluded partici- pants with incident diabetes during the follow-up, the partic- ipants included represent a healthy selection of the Whitehall II population such that (1) the true population trajectories are likely to be steeper and (2) the observed lower FG levels among South Asians at study baseline may reflect the selec- tion criteria.
PLG followed a quadratic increase over time, highlighting that additional data waves improved the precision of the estimation over our previous analysis, where a linear age- related increase was observed (0.5 mmol/l per decade) [19].
Other studies found increased PLG levels among non-diabetic South Asian compared with white individuals [10,14,16]. We confirm and extend this observation by showing that this difference is constant over the age range of 40–80 years.
FINS and PLINS levels were both elevated in South Asians compared with white individuals, reflecting increased insulin resistance among the South Asian participants [10,11,14,16].
As with PLG, we confirm these findings and extend them by reporting parallel insulin trajectories in South Asians and white participants.
The trajectories of HOMA2-%S, a measure of muscle and hepatic insulin sensitivity, confirm that insulin sensitivity de- creases with age. This decrease is less steep at older ages than in middle-aged people, as reflected by the quadratic term in the model. South Asian participants had lower insulin sensi- tivity over all ages, confirming findings from the literature that shows decreased insulin sensitivity from a young age in South Asians, decades before the manifestation of diabetes [10,11,
14–16]. This fact may be one explanation for our finding that current lifestyle explained very little of the difference in FG and HOMA2-%S.
The plausible causes for the early emergence of decreased insulin sensitivity among South Asians include the contribu- tion of abdominal fat distribution and low muscle mass [1,2, 4,7–9,13,14]. Furthermore, levels of the insulin-sensitising hormone adiponectin are lower [24], while levels of proin- flammatory cytokines are higher in South Asian compared with white individuals [25,26]. In addition, unhealthy life- styles (low physical activity and a Western dietary pattern) could further decrease insulin sensitivity in South Asian chil- dren and adults [1, 2, 4, 5, 7,8, 27]. In our multivariable analysis, we adjusted for obesity (BMI), diet and physical activity, but the main differences between the South Asian and white participants remained, in terms of both the slope difference in FG and the large intercepts regarding PLG, insulin and insulin sensitivity. These findings were robust to adjustment for waist circumference (a measure of central obesity) rather than BMI in a sensitivity analysis.
In line with other investigations, we found increased HOMA2-%S among South Asian compared with white indi- viduals [14]. However, elevated insulin secretion is difficult to interpret since (unlike the disposition index) it does not take account of the underlying level of insulin resistance, and is thus unable to provide a precise indicator of beta cell function.
None of the previous studies reported repeat measures of insulin secretion together with glucose values and levels of insulin sensitivity in South Asian and white individuals and was thus unable to compare beta cell compensation across ethnicities. Our results, however, clearly show that, for similar decreases in insulin sensitivity over time in the South Asian and white populations, the white participants showed a larger insulin secretory response and could maintain stable FG levels, while the South Asians could not increase their insulin secretion adequately, explaining the increasing FG trajectory.
It is possible that (1) significant fetal undernutrition among Asian populations may lead to reduced beta cell reserve, limiting the compensatory capacity [1], (2) long-term beta cell compensation for chronic insulin resistance from childhood leads to beta cell exhaustion or (3) increasing FG levels and continuously increased post-load glucose produce glucose toxicity and consequently beta cell failure [17, 18].
Although all three of the above mechanisms are compatible with our findings, it should be noted that our data are only hypothesis-generating and are unable to prove or disprove these mechanisms. Although it is well accepted that progres- sion to type 2 diabetes is associated with impaired beta cell compensation some 3–4 years before the diagnosis of diabetes [17,18], it is remarkable that impaired beta cell function was found in South Asian people who remained diabetes-free throughout the whole follow-up period of the Whitehall II study.
After multiple adjustments for obesity, lifestyle factors and social status, the ethnic difference in beta cell compensation over time was attenuated, suggesting that lifestyle interven- tions could help to prevent these deleterious changes.
Although insulin secretion appeared to develop in parallel in South Asian and white individuals, the difference in slope for FG still remained, confirming that lifestyle factors might not fully explain the deteriorating glucose tolerance among South Asians. While lifestyle interventions are proven in diabetes prevention among prediabetic individuals (individuals with intermediate hyperglycaemia) [18], our study suggests a po- tential role for them even in healthy South Asians.
The present study has some limitations. First, we used BMI rather than waist circumference as a measure of adiposity because BMI is highly reproducible and has a similar distri- bution in each sex. Furthermore, the correlation between BMI and waist measurement was strong in our database, with rvalues of 0.73–0.82 in subsequent clinical examinations, and BMI predicted the risk of diabetes as well as waist circumference in a meta-analysis [28]. Second, we used self- reported physical activity and dietary habits instead of objec- tive measures (accelerometry and nutritional biomarkers) as covariates in our analysis, as the variables used in the present analysis have already been shown to be associated with risk of type 2 diabetes [20] and all-cause mortality [23] in the Whitehall II study. Third, as our analysis is based on an occupational cohort and does not include blue-collar workers and the unemployed, the findings may not be fully applicable to the general population. Furthermore, the low number of South Asian participants further limits the generalisability. It should be noted, however, that previous reports from the same study confirmed the role of known diabetes risk factors (in- cluding ethnicity) with similar associated relative risks as have been found in population-based studies, giving credibility to the present observations [20,29–31]. Finally, several other potential confounding factors such as birthweight, birth place for South Asians (Asia or UK), inflammatory markers, adipokines and psychological factors were not taken into account in the present analysis.
In conclusion, the present study is the first to describe ethnic differences in age-related changes of glycaemic traits that may provide plausible pathophysiological mechanisms for the ele- vated risk of diabetes among South Asians. Specifically, non- diabetic South Asian individuals had lower insulin sensitivity from middle age onwards and inadequate beta cell compensa- tion at older ages compared with white participants. Our results may partially explain the dramatically increased risk of type 2 diabetes among South Asians, and they also highlight the importance of primary prevention of diabetes through lifestyle intervention among South Asian populations.
Acknowledgements The authors thank the staff and participants of the Whitehall II study for their important contributions.
Funding The Whitehall II study is supported by grants from the Medical Research Council (K013351), British Heart Foundation (RG/
13/2/30098), National Heart, Lung and Blood Institute (RO1 HL036310) and National Institute on Aging (RO1AG13196 and RO1AG034454).
AGT is supported by TÁMOP 4.2.4.A/1-11-1-2012-0001 National Excellence Program—research fellowship co-financed by the European Union and the European Social Fund. AH is supported by TÁMOP 4.2.2.A-11/1/KONV-2012-0052 Program.
Duality of interest The authors declare that there is no duality of interest associated with this manuscript.
Contribution statement SI and AGT analysed the data and drafted the paper. AGT, MK and EJB contributed to the conception and design of the study and the acquisition of the data. All authors contributed to the interpretation of data and critical revision of the manuscript and approved the final version. SI and AGT share primary responsibility for the final content.
Open AccessThis article is distributed under the terms of the Creative Commons Attribution License which permits any use, distribution, and reproduction in any medium, provided the original author(s) and the source are credited.
References
1. Chan JC, Malik V, Jia W et al (2009) Diabetes in Asia: epidemiology, risk factors, and pathophysiology. JAMA 301:2129–2140
2. Ramachandran A, Ma RC, Snehalatha C (2010) Diabetes in Asia.
Lancet 375:408–418
3. Whiting DR, Guariguata L, Weil C, Shaw J (2011) IDF diabetes atlas:
global estimates of the prevalence of diabetes for 2011 and 2030.
Diabetes Res Clin Pract 94:311–321
4. Barnett AH, Dixon AN, Bellary S et al (2006) Type 2 diabetes and cardiovascular risk in the UK south Asian community. Diabetologia 49:2234–2246
5. Health and Social Care Information Centre (2005) Health Survey for England 2004: the health of minority ethnic groups—headline tables.
NHS Health and Social Care Information Centre, Leeds, pp 1–58 6. Whitty CJ, Brunner EJ, Shipley MJ, Hemingway H, Marmot MG
(1999) Differences in biological risk factors for cardiovascular dis- ease between three ethnic groups in the Whitehall II study.
Atherosclerosis 142:279–286
7. Fischbacher CM, Hunt S, Alexander L (2004) How physically active are South Asians in the United Kingdom? A literature review. J Public Health (Oxf) 26:250–258
8. Garduno-Diaz SD, Khokhar S (2012) Prevalence, risk factors and complications associated with type 2 diabetes in migrant South Asians. Diabetes Metab Res Rev 28:6–24
9. Chandalia M, Abate N, Garg A, Stray-Gundersen J, Grundy SM (1999) Relationship between generalized and upper body obesity to insulin resistance in Asian Indian men. J Clin Endocrinol Metab 84:
2329–2335
10. Goff LM, Griffin BA, Lovegrove JA et al (2013) Ethnic differences in beta-cell function, dietary intake and expression of the metabolic syndrome among UK adults of South Asian, black African- Caribbean and white-European origin at high risk of metabolic syn- drome. Diabetes Vasc Dis Res 10:315–323
11. McKeigue PM, Shah B, Marmot MG (1991) Relation of central obesity and insulin resistance with high diabetes prevalence and cardiovascular risk in South Asians. Lancet 337:382–386
12. Ning F, Qiao Q, Tuomilehto J et al (2010) Does abnormal insulin action or insulin secretion explain the increase in prevalence of
impaired glucose metabolism with age in populations of different ethnicities? Diabetes Metab Res Rev 26:245–253
13. Raji A, Seely EW, Arky RA, Simonson DC (2001) Body fat distri- bution and insulin resistance in healthy Asian Indians and Caucasians. J Clin Endocrinol Metab 86:5366–5371
14. Tillin T, Hughes AD, Godsland IF et al (2013) Insulin resistance and truncal obesity as important determinants of the greater incidence of diabetes in Indian Asians and African Caribbeans compared with Europeans: the Southall And Brent REvisited (SABRE) cohort.
Diabetes Care 36:383–393
15. Whincup PH, Gilg JA, Papacosta O et al (2002) Early evidence of ethnic differences in cardiovascular risk: cross sectional comparison of British South Asian and white children. BMJ 324:635
16. Whincup PH, Gilg JA, Owen CG, Odoki K, Alberti KG, Cook DG (2005) British South Asians aged 13-16 years have higher fasting glucose and insulin levels than Europeans. Diabet Med 22:1275– 1277
17. DeFronzo RA (2009) Banting Lecture. From the triumvirate to the ominous octet: a new paradigm for the treatment of type 2 diabetes mellitus. Diabetes 58:773–795
18. Tabak AG, Herder C, Rathmann W, Brunner EJ, Kivimaki M (2012) Prediabetes: a high-risk state for diabetes development. Lancet 379:
2279–2290
19. Tabak AG, Jokela M, Akbaraly TN, Brunner EJ, Kivimaki M, Witte DR (2009) Trajectories of glycaemia, insulin sensitivity, and insulin secretion before diagnosis of type 2 diabetes: an analysis from the Whitehall II study. Lancet 373:2215–2221
20. Stringhini S, Tabak AG, Akbaraly TN et al (2012) Contribution of modifiable risk factors to social inequalities in type 2 diabetes:
prospective Whitehall II cohort study. BMJ 345:e5452
21. Wallace TM, Levy JC, Matthews DR (2004) Use and abuse of HOMA modeling. Diabetes Care 27:1487–1495
22. Zaman MJ, Shipley MJ, Stafford M et al (2011) Incidence and prognosis of angina pectoris in South Asians and Whites: 18 years
of follow-up over seven phases in the Whitehall-II prospective cohort study. J Public Health (Oxf) 33:430–438
23. Stringhini S, Sabia S, Shipley M et al (2010) Association of socio- economic position with health behaviors and mortality. JAMA 303:
1159–1166
24. Mohan V, Deepa R, Pradeepa R et al (2005) Association of low adiponectin levels with the metabolic syndrome—the Chennai Urban Rural Epidemiology Study (CURES-4).
Metabolism 54:476–481
25. Forouhi NG, Sattar N, McKeigue PM (2001) Relation of C-reactive protein to body fat distribution and features of the metabolic syn- drome in Europeans and South Asians. Int J Obes Relat Metab Disord 25:1327–1331
26. Whincup PH, Nightingale CM, Owen CG et al (2010) Early emer- gence of ethnic differences in type 2 diabetes precursors in the UK:
the Child Heart and Health Study in England (CHASE Study).
PLoS Med 7:e1000263
27. Williams ED, Stamatakis E, Chandola T, Hamer M (2011) Assessment of physical activity levels in South Asians in the UK: findings from the Health Survey for England. J Epidemiol Community Health 65:517–
521
28. Vazquez G, Duval S, Jacobs DR Jr, Silventoinen K (2007) Comparison of body mass index, waist circumference, and waist/hip ratio in predicting incident diabetes: a meta-analysis.
Epidemiol Rev 29:115–128
29. Kumari M, Head J, Marmot M (2004) Prospective study of social and other risk factors for incidence of type 2 diabetes in the Whitehall II study. Arch Intern Med 164:1873–1880
30. Talmud PJ, Hingorani AD, Cooper JA et al (2010) Utility of genetic and non-genetic risk factors in prediction of type 2 diabetes:
Whitehall II prospective cohort study. BMJ 340:b4838
31. Witte DR, Shipley MJ, Marmot MG, Brunner EJ (2010) Performance of existing risk scores in screening for undiagnosed diabetes: an external validation study. Diabet Med 27:46–53
![– ].Recentstudiesrevealedtheevidencethatinsulinplaysacriticalroleinmaintainingthemitochondrial inthenormalbrainfunctionhasbeenconfirmedbyevidencethatinsulindysregulationplaysaroleinthepathophysiologyofAlzheimer’sdisease(AD)[ therapiesareconcernedwithdelive](data:image/gif;base64,R0lGODlhAQABAIAAAP///wAAACH5BAEAAAAALAAAAAABAAEAAAICRAEAOw==)