Non-invasive Characterization of Coronary Artery Atherosclerotic Plaques
Doctoral Thesis Mihály Károlyi
Semmelweis University
Doctoral School of Basic Medical Sciences
Supervisors: Dr. Pál Maurovich-Horvat Ph.D.
Dr. Béla Merkely D.Sc.
Official reviewers Dr. Lívia Jánoskúti Ph.D.
Dr. Attila Thury Ph.D.
Head of the Final Examination Committee:
Dr. Viktor Bérczi D.Sc.
Members of the Final Examination Committee:
Dr. Attila Doros Ph.D.
Dr. László Sallai Ph.D.
Budapest, 2015
INTRODUCTION
Coronary atherosclerosis related cardiac events remain the leading cause of morbidity and mortality worldwide. Most acute coronary events can be linked to the rupture of a coronary atherosclerotic plaque, resulting in the formation of a luminal thrombus and possible occlusion of the vessel. Similar atherosclerotic lesions are also present in individuals who did not experience acute cardiovascular event. Thus, significant interest exists in the development of non-invasive imaging techniques applicable for large scale screening to characterize atherosclerotic lesions, assess their risk for rupture and further complications.
Imaging of coronary atherosclerotic plaque with CT
Coronary computed tomography angiography (CTA) has emerged in the past decade as a powerful tool to detect coronary artery stenosis with excellent sensitivity and good specificity, when compared with invasive angiography.
Moreover, coronary CTA also allows the visualization of the vessel wall with high spatial resolution, therefore it permits the characterization of coronary atherosclerotic plaque. Growing body of evidence suggests that based on the different CT attenuation of coronary plaque components, not only calcified and non-calcified plaques can be discriminated, but non- calcified plaque components can be further distinguished to fibrotic and lipid-rich lesions. Recent small studies suggest that a certain morphological pattern in CT, a hyperdense ring-like structure surrounding a hypodense center, described as
“napkin-ring” sign (NRS), is associated with advanced coronary plaque. Yet, the histopathological features of advanced coronary atherosclerotic plaques that promote or interfere with the delineation of the napkin-ring sign in
coronary CT angiography are unidentified.
Characterization of atherosclerotic plaque with coronary CTA is impaired by the limited contrast resolution of the CT images, which may have been influenced by quantum noise. Image noise also hampers the applicability of automated tools for quantitative coronary CTA assessments by the frequent need of manual corrections of vessel boundaries. Recently, iterative image reconstruction algorithms have been found to yield lower image noise and increased resolution than standard techniques. Thus, iterative reconstruction techniques may improve the visualization of coronary artery atherosclerotic plaques and have a significant benefit above standard image reconstruction when using automated tools to assess quantitative plaque parameters. This would translate directly into an improved feasibility and potentially into a wider clinical applicability of automated software for plaque assessment in coronary CTA.
Imaging of coronary atherosclerotic plaque with MRI
The experience with magnetic resonance imaging (MRI) for the characterization of carotid artery plaque is now extensive.
Owing to its excellent soft tissue contrast, multicontrast MRI is able to differentiate atherosclerotic plaque components, thus detects carotid lipid content, hemorrhage, neovascularization and fibrous cap thickness. Recently, ultra-short echo time (UTE) MRI has been used to detect and quantify plaque calcification in carotids. MRI characterization of coronary plaque, however, is in its nascency. Unlike MRI of the carotids, MRI of the coronary wall currently lacks the spatial resolution needed for the detailed characterization of plaque morphology. High-field MRI systems have been introduced to overcome these difficulties and potentiate high resolution imaging in human use. Several groups have shown the
feasibility of human cardiac imaging with 7T-units, moreover, successful imaging of the coronary arteries in vivo. Still, the ability of high-resolution MRI to accurately characterize human coronary atherosclerotic plaque remains poorly defined.
Only one study to date has examined the correlation between human coronary artery plaque by MRI and histology and this study was hindered by the absence of a sequence to specifically detect plaque calcification. Thus, imaging of coronary atherosclerotic lesions with high-resolution T1, T2 and UTE MRI may allow for detailed visualization and classification of plaque morphology.
OBJECTIVES
1. Histopathological correlates of the napkin-ring sign in CT
We sought to identify histological characteristics of advanced coronary atherosclerotic plaques that promote or interfere with the delineation of the napkin-ring sign in coronary CT angiography.
2. Impact of CT image reconstruction on coronary plaque visualization
We aimed to compare the image quality of coronary CTA regarding atherosclerotic plaque visualization in human coronaries with images reconstructed with standard filtered back projection reconstruction (FBPR), adaptive statistical iterative reconstruction (ASIR) and model based iterative reconstruction (MBIR) techniques.
3. Effect of image reconstruction on automated CT plaque assessment
We sought to determine the effect of iterative reconstruction algorithms compared to filtered back projection reconstruction regarding the need for manual corrections of the automatically fitted vessel-wall boundaries.
4. Characterization of coronary atherosclerotic plaque with MRI
We aimed to use high-resolution multicontrast MRI with T1, T2 and ultra-short echo time (UTE) sequences to visualize human coronary atherosclerotic plaques. Furthermore, we aimed to characterize coronary atherosclerotic plaques, thus to distinguish potentially vulnerable lipid-rich plaques from more stable fibrocalcific plaques with a high degree of accuracy. In addition, our goal was to assess the capability of MRI to classify human coronary atherosclerotic lesions with multicontrast T1, T2 and UTE technique comparable with the histopathological plaque classification.
METHODS Ex Vivo Setup
An ex vivo experimental setup has been established for the imaging of human coronary atherosclerotic plaques. CT and MRI were used to assess atherosclerotic plaque parameters and compared to co-registered histological data. Seven human donor hearts deemed unsuitable for transplantation due to coronary artery disease were retrieved according to our inclusion criteria: male gender, age between 40 and 70 years, and proven coronary artery disease. After specimen preparation
a methylcellulose based iodinated contrast was used for imaging the ex-vivo hearts with CT. All CT data acquisition was performed with a 64-detector row CT scanner (High- Definition, GE Discovery, CT 750HD, Milwaukee, WI, USA) and reconstructed with FBPR, ASIR and MBIR algorithms.
For the MRI analysis formalin pre-fixation was implemented and a block of myocardium, including the left anterior descending artery and its proximal side branches was excised.
Magnetic resonance images were acquired on a 9.4T horizontal bore MRI scanner (Biospec, Bruker, Billerica, MA, USA) with transmit-receive birdcage coil using T1, T2 and UTE sequences. The histological processing and analysis was performed at a pathology institute specialized in cardiovascular histopathology (CV Path Laboratory, Maryland, MD).
Coronary specimens were embedded en bloc in paraffin, cross- sections were acquired in 1-mm increments and Movat’s pentachrome staining was used. CT and MRI images were co- registered with histology manually by using a freeware Dicom reader (OsiriX, version 3.6.1, Geneva, Switzerland) based on fiducial markers.
Histological analysis
Blinded to CT and MRI data plaque components such as lipid- rich / or necrotic core (LRNC), calcification (micro, spotty, sheet), intraplaque hemorrhage, microvessels, and macrophage infiltration were reported by an experienced pathologist.
Further classification of the coronary plaques was performed according to the histological criteria established by the American Heart Association (AHA). Vessel area (VA), lumen area (LA) and NRNC area (CA) were measured on digitalized images using a dedicated software (ImageJ 1.44o, National Institutes of Health, Bethesda, MD, USA).
Total plaque area (TPA) was calculated as TPA = VA - LA and the area of non-core plaque as NcA = TPA – CA.
Plaque burden (PB) was calculated as PB = (TPA/ VA) * 100.
CT data analysis
CT image analysis was performed by two experienced observer blinded to the image review results. For the analysis of features associated with NRS on cross-sections containing advanced plaques on histology, the presence of a NRS was specified.
NRS was defined by a low-attenuation plaque core surrounded by a circumferential area of higher attenuation on CT image.
Attenuation of the non-calcified plaque portion of all plaques and in plaques with a positive NRS, median density of the central hypodense area and the peripheral hyperdense ring was measured.
For qualitative analysis of images reconstructed with different algorithms a Likert-type grading was used. Overall image quality, image sharpness and image noise (defined as overall graininess of mottle in the coronary artery) were scaled.
Presence of calcification was also assessed and if present, blooming artifacts were scaled. For quantitative image analysis mean CT attenuation values were obtained (in Hounsfield units) for the peri-coronary fat and coronary artery. Image noise was measured as the standard deviation (SD) in the peri- coronary fat. Contrast-to-noise ratio (CNR) was calculated as CNR = (HUcoronarylumen – HUpericoronary-fat) / SDlumen.
Automated plaque assessment was performed on a dedicated offline workstation (Vitrea Advanced Cardiac Solutions, Vital Images, Minnetonka, MN, USA), which allowed automated vessel segmentation and quantification of the coronary artery components. The proximal 40 mm of each vessel were assessed. The software fitted the inner and outer vessel-wall boundaries automatically, which were reviewed by an
experienced reader on cross-sectional images (0.5 mm increments) and manually corrected if necessary. Primary endpoint was the percentage of cross-sections where a manual correction of automatically fitted vessel-wall boundaries (inner and outer) was necessary. Secondary endpoints were the:
percentage of cross-sections that required corrections of only the 1.) inner or 2.) outer vessel-wall boundary; 3.) benefit of MBIR over FBPR (or over ASIR), which was defined as cross- sections that needed any corrections on FBPR (or ASIR) but not in MBIR, as compared to cross-sections, which showed no difference between MBIR and FBPR (or ASIR).
MRI image analysis
A 5-point Likert-type scale was used to assess the quality of the UTE images. Three independent observers blinded to the histological plaque classification performed MRI plaque classification. In cases of disagreement, a consensus was reached in a subsequent reading. Areas of plaque showing signal hypointensity on the T1 but not the UTE images were classified as calcified. Areas showing signal hypointensity on the T2 images were classified as lipid-rich necrotic core.
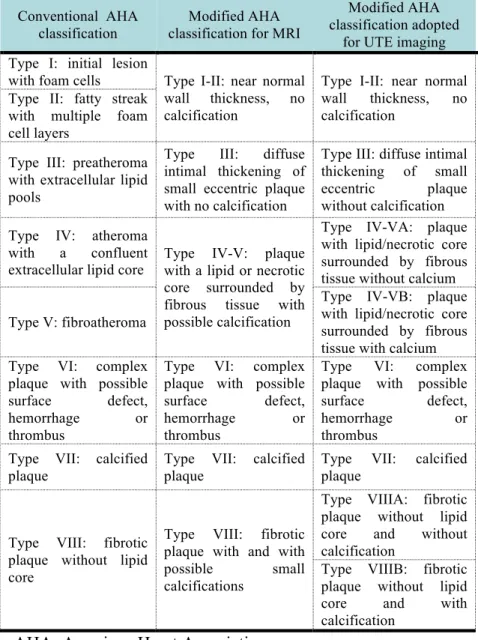
Hemorrhage was identified by hyperintensity on the T1 and UTE images and regions that were isointense on all sequences were classified as fibrotic. Signal intensities were interpreted with the adjacent myocardium as a reference. A modified AHA classification of plaques implemented for UTE MRI was used to further classify the lesions (see Table 1).
Table 1 – Scheme for the classification of plaques with MRI.
AHA: American Heart Association
Conventional AHA classification
Modified AHA classification for MRI
Modified AHA classification adopted
for UTE imaging Type I: initial lesion
with foam cells Type I-II: near normal wall thickness, no calcification
Type I-II: near normal wall thickness, no calcification
Type II: fatty streak with multiple foam cell layers
Type III: preatheroma with extracellular lipid pools
Type III: diffuse intimal thickening of small eccentric plaque with no calcification
Type III: diffuse intimal thickening of small eccentric plaque without calcification Type IV: atheroma
with a confluent extracellular lipid core
Type IV-V: plaque with a lipid or necrotic core surrounded by fibrous tissue with possible calcification
Type IV-VA: plaque with lipid/necrotic core surrounded by fibrous tissue without calcium Type V: fibroatheroma
Type IV-VB: plaque with lipid/necrotic core surrounded by fibrous tissue with calcium Type VI: complex
plaque with possible surface defect, hemorrhage or thrombus
Type VI: complex plaque with possible surface defect, hemorrhage or thrombus
Type VI: complex plaque with possible surface defect,
hemorrhage or
thrombus Type VII: calcified
plaque
Type VII: calcified plaque
Type VII: calcified plaque
Type VIII: fibrotic plaque without lipid core
Type VIII: fibrotic plaque with and with possible small calcifications
Type VIIIA: fibrotic plaque without lipid core and without calcification
Type VIIIB: fibrotic plaque without lipid core and with calcification
RESULTS
1. Histopathological correlates of the napkin-ring
Advanced plaques were present in 139 (22.7%) of 611 cross sections, while 472 (77.3%) were early plaques. Of these 33 (23.7%) demonstrated an NRS in coronary CTA, whereas no NRS was found in 106 slices (76.3%). However, NRS was also found in 5 of the 472 (1.1%) slices classified as early lesions.
The napkin-ring sign was most common in the right coronary (RCA; 55%), followed by the left-circumflex artery (LCX; 30%) and the left anterior descending artery (LAD;
15%). In contrast, plaques without NRS were evenly spread among the 3 arteries. The median density of the non-calcified plaque portion was 61.8 HU [48.4-70.1 HU] for plaques with an NRS and 65.9 HU [49.3-87.7 HU] for plaques without NRS (p=0.10). In plaques with a positive NRS, the median HU of the central hypodense area was 48.1 HU [33.4-61.6 HU], whereas the rim showed a median density of 68.2 HU [52.3- 76.5 HU]. The difference between the density values was significant (p<0.001).
The area of the necrotic core was more than twice as large in plaques with NRS as compared to those without NRS (median 1.1 mm2 vs. 0.5 mm2, p=0.05). Similarly, the area of non-core plaque was significantly larger in plaques with NRS as compared to those without (median 10.2 mm2 vs. 6.4 mm2, p<0.001). The thickness of the fibrous cap was not different for plaques with and without NRS (median 0.4 mm vs. 0.30 mm, p=0.15). Microvessels within the plaque, indicative of angiogenesis tended to be more frequent in plaques exhibiting the NRS sign (48% vs. 30%, p=0.06), while microcalcifications tended to be more common in plaques without an NRS (27% vs. 46%, p=0.07). The presence of
macrophages, hemorrhage and calcifications (independent of whether they were spotty or sheet-like) in close proximity to the lipid core was not associated with the NRS. Additional lipid pools, smaller than the main core, were more common in plaques without an NRS (35% vs. 12%, p=0.02). Histologic plaque features distant from the core were generally not associated with the NRS except for core-unrelated spotty and sheet calcifications, which were more commonly detected in the absence of an NRS (3% vs. 17%, p=0.04).
In multivariate adjusted analysis the area of the necrotic core (OR: 1.70 [95% CI: 1.12-2.57] per increase by one mm2, p=0.01) and the area of the non-core plaque (OR: 1.24 [95%
CI: 1.11-1.40] per increase by one mm2, p<0.01) remained as independent predictors of the NRS. In contrast, the presence of additional smaller lipid pools independently reduced the probability of the appearance of the NRS (OR: 0.22 [95% CI:
0.07-0.75]).
Plaques exhibiting an NRS in CT were located more proximally as compared to those without NRS (median distance from ostium 19.0 mm vs. 31.0 mm, respectively;
p=0.02). Also, the vessel area was larger at the site of the plaque (median 17.06 mm2 vs. 12.95 mm2, p=0.02) and plaque area itself was larger (median 11.49 mm2 vs. 7.49 mm2, p<0.001) in plaques with NRS than in plaques without NRS.
Interestingly, the lumen area was not different between plaques with and without NRS (median 2.58 mm2 vs. 3.07 mm2, p=0.58). As a result, plaque burden was significantly larger in plaques with NRS as compared to those without NRS (79.8%
vs. 68.5%, p<0.001). In multivariate adjusted analysis both vessel area (OR: 0.84 [95% CI: 0.75-0.94] per 1 mm2 increase, p<0.01) and plaque area (OR: 1.74 [95% CI: 1.36-2.21] per 1 mm2 increase, p<0.0001) remained independent predictors for the delineation of the NRS in CT. Plaque burden was not included in this analysis as it was co-linear and inferior to the
combination of vessel area and plaque area.
When adjusting for both histologic and associated features the area of the necrotic core area, the area of the non-core plaque, and the vessel area remained independent predictors for the appearance of the NRS with the area of the necrotic core being the strongest predictor (OR 1.91; [95% CI: 1.23-2.98]).
2. Impact of CT image reconstruction on coronary plaque visualization
A total of 1125 images were used for this sub-analysis derived from three datasets reconstructed with FBPR, ASIR and MBIR yielding 375 triplets of co-registered image sets. All of these were included in image quality analysis.
Qualitative image analysis: Kappa-values indicated good to excellent inter- and intra- observer agreement regarding qualitative parameters except for image sharpness (κ=0.38).
Although both readers had full agreement only in 43% of the cases regarding image sharpness, both were only a single category apart using a 5-point Likert scale in 54% of the cases.
Overall image quality was classified to be good or excellent in 274 (73.1%) and 48/375 images (12.8) using FBPR, 318 (84.8%) and 15/375 images (4.0%) using ASIR, and 248 (66.1%) and 96/375 (25.6%) using MBIR. Image quality was significantly better with MBIR than with ASIR (p<0.001) or FBPR (p<0.001). ASIR and FBPR reconstruction techniques yielded similar image quality (p=0.17).
Calcifications were observed in 369/1125 images (32.8%), no significant differences were discovered among the three reconstruction algorithms (FBPR, 33.9%; ASIR, 32.8%;
MBIR, 31.7%; p=0.53). Image quality was significantly (p<0.001) worse if calcification was present. Regarding images with presence of calcifications, 87/369 images (23.6%) were considered to show no blooming, 267/369 images (72.4%)
were considered to have blooming artifacts but allowing luminal visualization, and 15/369 images (4.1%) were considered to have blooming artifacts rendering luminal visualization impossible. No differences among FBRR, ASIR, and MBIR were revealed (p=0.95).
Image noise was significantly lower by ASIR as compared to FBPR (p<0.01) and was further reduced by MBIR as compared ASIR (p<0.001). Image sharpness with MBIR was significantly improved with MBIR as compared to ASIR (p<0.001) and FBPR (p<0.001); however, ASIR and FBP were comparable (p=0.61).
Quantitative image analysis: Inter- and intra-reader correlation coefficients ranged from 0.65 to 0.91 and 0.79 to 0.94, respectively. Mean luminal CT number was 297±27 HU and higher (on average 6-10 HU) in images reconstructed with MBIR than in those reconstructed with FBPR and ASIR (p<0.05, both). Mean image noise was 16.0±5.1 HU in images reconstructed with FBPR, 14.5±4.3 HU in images reconstructed with ASIR, and 10.2±4.0 HU in images reconstructed with MBIR. Quantitative assessment of image noise correlated significantly with the qualitative image noise score (r=0.43, p<0.001).
Mean CNR was 26±9 HU in images reconstructed with FBPR, 29±15 HU in images reconstructed with ASIR, and 44±19 HU in images reconstructed with MBIR. The image noise and CNR among the three reconstruction techniques were significantly different (p<0.001, both). Image noise was highest using FBPR and lowest using MBIR (p<0.05, all); whereas CNR was lowest using FBPR and highest using MBIR (p<0.05, all). MBIR increased the CNR by 51-69% while decreased the noise by 30-36% as compared to both other techniques.
3. Effect of image reconstruction on automated CT plaque assessment
A total of 2,313 CTA cross-sections with an increment of 0.5 mm were assessed from the proximal 40 mm of nine coronary arteries for this sub-study, each reconstructed by FBPR, ASIR and MBIR. Of those, data were co-registered and available in 2,295 cross-sections (99.6%). Average measured plaque area was 8.46±3.50 mm2 with a plaque burden of 51.7±13.8%.
Nearby two-third (59.5%) of the cross-sections contained no calcification, one-third moderate calcification (32.6%) and less than a tenth (7.9%) severe calcification.
Any corrections of the outer or of the inner vessel-wall boundaries were performed in a total of 712 cross-sections (31.0%), while the outer vessel-wall boundary was corrected in 400 cross-sections (17.4%) and the inner in 381 cross-sections (16.6%). For both the outer and the inner vessel-wall, the boundary circumference was on average reduced by the manual corrections (delta of -0.58±1.76 mm for the outer, and delta of -0.92±1.11 mm for the inner vessel-wall comparing the boundary circumference before and after the manual corrections, both p<0.0001). The correction of one boundary (inner or outer) lasted on average for 21±4 seconds, for both boundaries 46±5 seconds. Corrections of vessel-wall boundaries were performed with a similar frequency for all three vessel territories (p=0.98), whereas more often performed at the side of moderate and severe calcification (p<0.0001).
The minimal luminal diameter was smaller whereas the cross- sectional vessel area and the plaque burden were larger in cross-sections with boundary corrections as compared to those without any corrections (all p≤0.001). No difference was observed regarding the distance from the ostium (p=0.11).
Comparing the portion of cross-sections with boundary corrections (of the inner or / and the outer vessel-wall) between
FBPR, ASIR and MBIR, a stepwise reduction of corrected cross-sections was observed using MBIR as compared to ASIR and FBPR (26% and 34% relative reduction, respectively; all p≤0.0003. The difference between FBPR and ASIR was marginally non significant (p=0.09). Similarly, the percentage of cross-sections with inner vessel-wall boundary corrections was not different between FBPR and ASIR (p=0.79), while MBIR demonstrated again a smaller percentage of corrected cross-sections for the inner vessel wall boundaries when compared to FBPR and ASIR (27% and 29% relative reduction, respectively; all p≤0.009). For the outer vessel wall boundaries, the cross-sections with boundary corrections were reduced in ASIR as compared to FBPR and further reduced in MBIR (20% and 25% relative reduction, respectively; all p≤0.03). In cross-sections with any corrections, the degree of manual adjustments to the boundary circumference (in mm) did not differ between FBPR, ASIR and MBIR (all p>0.64).
On a per-vessel level, 32.5% (median, IQR: 27.5-48.1) of the entirely assessed vessel length was corrected in FBPR, 29.2%
(median, IQR: 23.8-43.0) in ASIR and 19.1% (median, IQR:
11.4-36.3) in MBIR. This resulted in a significant reduction of the corrected vessel length in MBIR as compared to ASIR and to FBPR (p=0.008 and p=0.004, respectively), while the difference between ASIR and FBPR was marginal (p=0.05).
On a per cross-section level of co-registered triplets (n = 765), 53.6% required no corrections in any of the three image reconstruction algorithms. In contrast, 16.3% of the co- registered triplets were corrected in all three image reconstruction algorithms.
Comparing the cross-sections where a benefit of MBIR was observed over FBPR (n=132) to those with no differences between MBIR and FBPR (n=597), only the extent of calcification was independently associated. The odds for the benefit of MBIR over FBPR increased by about 3-folds for the
presence of moderate calcification (OR: 2.9 [95%CI: 1.9-4.5], p<0.0001), and by about 6-folds for the presence of severe calcification (OR: 5.7 [95%CI: 2.6-12.7], p<0.0001). Minimal luminal diameter, plaque area and burden did not show any association with the benefit of MBIR over FBPR for the automated delineation of vessel-wall boundaries (all p≥0.45).
A similar pattern was observed for the benefit of MBIR over ASIR.
4. Characterization of coronary atherosclerotic plaque with MRI
59 plaque cross sections could be co-registered with corresponding high-field MRI datasets (T1, T2, UTE). All sections had evidence of atherosclerotic disease with calcification present in 48% (28/59) and lipid-rich necrotic core in 56% (33/59). We used 31 co-registered sections to study plaque characteristics and 28 were used for the analysis.
The image quality of the UTE images was high, averaging 4.1±0.7, and was diagnostic in all cases. Multicontrast MRI had an excellent sensitivity (100%), specificity (90%) and both positive (80%) and negative (100%) predictive values for the identification of calcium. The sensitivity, specificity, positive and negative predictive values for lipid-rich necrotic core recognition with MRI were 90%, 75%, 90% and 75 %, respectively. MRI failed to identify lipid-rich necrotic areas in two plaques; however, both these lesions were classified histologically as early lesions with only very small lipid-rich necrotic cores.
For the comparison of plaque classification by MRI and histology, complete agreement was seen in 22/28 cases. Type I-II lesions were identified correctly by MRI in all cases. Two sections with Type III plaques by histology were misclassified by MRI as having small lipid-rich necrotic cores. It should be
noted that prior to the consensus discussion, 2/3 readers had classified these plaques as Type III by MRI as well. Among Type IV-V lesions, 2 plaques were falsely classified as calcified by MRI. Overall only 6/28 lesions were misclassified by MRI, resulting in a good correlation between MRI and histology (κ value of 0.69). Excellent inter-observer agreement was found for the detection of calcified and necrotic core plaque components by MRI with a κ value of 0.80 and 0.82, respectively (p<0.0001). Inter- observer agreement was excellent for overall MRI plaque classification (κ=0.78, p<0.0001).
CONCLUSIONS
Coronary atherosclerotic plaques with a napkin-ring sign in CT have a distinct histopathological appearance primarily characterized by a large necrotic core with a large fibrous component often associated with neovascularization. Because these features have been associated with advanced atherosclerotic and rupture-prone lesions in histology, the napkin-ring sign can possibly serve as a marker for advanced lesions in coronary CT angiography.
Our initial results regarding image reconstruction of CT suggest that use of MBIR algorithm, as compared with ASIR and a standard FBPR reconstruction algorithm, leads to significantly improved image quality accompanied with a substantial decrease in image noise and increase of the CNR.
These findings and the ability to achieve better vessel sharpness using MBIR compared with ASIR or FBPR may have an important clinical implication in the evaluation of the coronary artery tree that needs to be validated in vivo.
Applying automated plaque assessment in CT angiography, a significant portion of the automatically fitted vessel-wall boundaries must be corrected manually. The need for boundary
correction is reproducible and shows a local relationship.
However, MBIR leads to a significantly reduced need for correcting the automatically fitted boundaries compared to other reconstruction algorithms, especially at the site of calcifications. Thus, MBIR leads to a shorter assessment time and may improve the robustness of automated plaque assessment in coronary CTA.
Furthermore, in our study we applied a novel combination of MRI contrast (T1, T2, and UTE) to image atherosclerotic plaque in human coronary arteries. We showed that plaque classification with this approach compares extremely favorably with histology. The addition of UTE MRI adds significant value by allowing plaque calcification to be accurately detected. Our study further underscores the potential of coronary plaque classification by MRI and its potential use to define the clinical stage of coronary atherosclerosis and guide patient management.
Publications closely related to the present thesis
1. Károlyi M, Seifarth H, Liew GY, Schlett CL, Maurovich- Horvat P, Stolzmann P, Dai G, Huang S, Georgen CJ, Nakano M, Otsuka F, Virmani R, Hoffmann U, Sosnovik DE. (2013) Classification of Coronary Atherosclerotic Plaques Ex Vivo with T1, T2 and Ultrashort Echo Time CMR. JACC Cardiovasc Imaging, 6: 466-74.
IF: 6.986 IF: 6.986
2. Seifarth H, Schlett CL, Nakano M, Otsuka F, Károlyi M, Liew G, Maurovich-Horvat P, Alkadhi H, Virmani R, Hoffmann U. (2012) Histopathological correlates of the napkin-ring sign plaque in coronary CT angiography.
Atherosclerosis, 224: 90-6.
IF: 3.706
3. Scheffel H, Stolzmann P, Schlett CL, Engel LC, Major GP, Károlyi M, Do S, Maurovich-Horvat P, Hoffmann U.
(2012) Coronary atherosclerotic plaques: Cardiac CT with model-based and adaptive-statistical iterative reconstruction technique. Eur J Radiol, 81: 363-9.
IF: 2.512
4. Puchner SB, Ferencik M, Károlyi M, Do S, Maurovich- Horvat P, Kauczor HU Hoffmann U, Schlett CL. (2013) The Effect of Iterative Image Reconstruction Algorithms on the Feasibility of Automated Plaque Assessment in Coronary CT Angiography. Int J Cardiovasc Imaging. 29:
1879-8.
IF: 2.322
Publications not related to the present thesis
1. Stolzmann P, Schlett CL, Maurovich-Horvat P, Maehara A, Ma S, Scheffel H, Engel LC, Károlyi M, Mintz GS, Hoffmann U. (2012) Variability and accuracy of coronary CT angiography including use of iterative reconstruction algorithms for plaque burden assessment as compared with intravascular ultrasound-an ex vivo study. Eur Radiol, 22:
2067-75.
IF: 3.548
2. Ghoshhajra BB, Engel LC, Károlyi M, Sidhu MS, Wai B, Barreto M, Shanmugam U, Hoffmann U, Brady TJ, Kalra M, Abbara S. (2013) Cardiac computed tomography with automatic tube potential selection. Effects on radiation dose and image quality. J Thorac Imaging, 28: 40-8.
IF: 1.489
3. Ghoshhajra BB, Engel LC, Major GP, Verdini D, Sidhu M, Károlyi M, Abbara S, Hoffmann U, Karla M, Brady TJ. (2011) Direct chest area measurement: A potential anthropometric replacement for BMI to inform cardiac CT
dose parameters? J Cardiovasc Comput Tomogr; 5: 240-6 IF: N/A
4. Engel LC, Ferencik M, Liew GY, Karolyi M, Sidhu MS, Lee AM, Wai B, Blankstein R, Abbara S, Hoffmann U, Ghoshhajra BB. (2012) Ultra-Low Dose Cardiac CT Angiography at 80 kV using Second Generation Dual- Source CT: Assessment of Radiation Dose and Image Quality. J Med Diag Met, 1:1
IF: N/A IF: N/A