Abstract
Reducing sugar content of marzipan samples were measured by analytical method (Schrool-Regenbogen method - for control), texture analysis was done by penetrometry, electric properties were measured by conductometry and hyperspectral images were taken regularly for 16 days. The main wavelengths which gave the best discrimination results among the days of storage were between 960 and 1100 nm. The type of the marzipan was easy to distinguish with the hyperspectral data; the biggest differences were to be found at 1200 and 1400 nm. The spatial distribution of penetrometric, electric and spectral properties were also characteristic to fructose content.
Keywords
hyperspectral imaging, marzipan, fructose content, conductometry, penetrometry
1. Introduction
Marzipan is a delicacy which is made primarily from almond and sugar. In some countries it can contain other nuts (e.g. apricot kernel) as well. Blanched almonds are mixed with sugar-glucose or sugar-invert syrup mixtures in different sugar-almond ratios. For its significant taste bitter almonds are also used in the production (up to 1% of the total nut weight should be bitter). According to the Codex Alimentarius Hungaricus the marzipan products are classified according to their sugar-almond ratios, the sugar content (expressed in sucrose, on dry base) is 35, 50, 67 or 75 w/w%.
Although during the ageing of marzipan the total sugar content is not altering, the ratio of the different sugar components changes. Invertase enzyme transforms the non-reducing sucrose into glucose and fructose molecules [1].
Unlike saccharose (sucrose) fructose is highly hygroscopic;
therefore the drying out of the marzipan is reduced.
The reducing sugar content (fructose) is measured in general by titrimetric or iodometric analytical methods (e.g. the Schoorl Regenbogen method) [2], which are time and solvent consuming, and require analytical skills.
Other techniques such as HPLC and ion chromatography are also used in direct sugar analysis. However to use these methods
the sample preparation is crucial, as most methods of sugar analysis requires a clean aqueous extract to work on [3], and in marzipan sugar is present in a matrix of lipid and protein.
Christensen et al. [4] used in their study a set of 32 marzipan samples of nine different recipes to measure their composition with different types of NIR spectrometers. The marzipan samples were analyzed chemically and measured on six different spectrometer set-ups. Partial least squares regression (PLSR) method was used to make calibrations to moisture and sugar content. In their model the root mean square error of cross-validation (RMSECV) for the prediction of the moisture was found to be 0.36% w/w moisture (range 7–19%). The sugar content was predicted with a RMSECV of 1.43% w/w (range 33–68%) [4].
The same data set was used for the work of Westad et al. [5], where relevant wavelengths data were searched for the best differentiation. Sugar and water constitute the two major chemical components in the marzipan data, and as expected the spectral pattern reveals a distinction between O H vibrations (sugar and water) and C H vibrations (sugar). For instance, the broad water bands in the NIR regions at 800–1100 nm (O H stretch, 2.
overtone) and around 1900 nm (O H stretch/deformation combination) are well correlated to the O H deformation band in the 700–800 cm−1 region of the IR spectra. The 1200 nm NIR region (CH stretch, 2. overtone), on the other hand, show significant correlations to IR bands around for instance 820 cm−1 (CH deformation) and 1030 cm−1 (CO stretch). Last, the NIR bands around 1400–1500 nm are related to both O H stretch vibrations and C H combinations [5].
Hyperspectral imaging has been used on different food products; for example to measure the moisture content of carrots [6, 7], ham [8] and soy beans [9]. The same technique was used on plants, too [10].
Aim of the present study was to evaluate of the use of hyperspectral imaging technique, conductometry and penetrometry to follow the changes induced by altering fructose content of marzipan during storage.
2. Materials and Methods
Marzipan samples of 3 different sugar: almond ratios (1:1, 2:1, 3:1) were produced under the same manufacturing parameters.
Prismatic samples (rods) of the same geometry were cut out of HUNGARIAN AGRICULTURAL ENGINEERING
N° 34/2018 39-43
Published online: http://hae-journals.org/
HU ISSN 0864-7410 (Print) / HU ISSN 2415-9751(Online) DOI: 10.17676/HAE.2018.34.39
Research Letter
ALTERING OF MARZIPAN FOLLOWED UP BY PHYSICAL MEASUREMENTS
Author(s):
K. Badak-Kerti1– Sz. Németh – F. Firtha2 Affiliation:
1Department of Grain and Industrial Crop Technology, Szent István University, Villányi út 29-43., 1118 Budapest, Hungary
2Department of Physics and Automation, Szent István University, Somlói út 16., 1118 Budapest, Hungary Email address:
badakne.dr.kerti.katalin@etk.szie.hu, firtha.ferenc@etk.szie.hu
PERIODICAL OF THE COMITTEE OF AGRICULTURAL AND BIOSYSTEM ENGINEERING OF
THE HUNGARIAN ACADEMY OF SCIENCES and
SZENT ISTVÁN UNIVERSITY Faculty of Mechanical Engineering Received: 2017.10.17.; Accepted: 2018.10.13.
the marzipan blocks. Samples were stored at constant temperature of 17°C in a closed cabinet. Storage lasted to 16 days after production, as this time is enough to finish the sucrose inversion.
Measurements were taken on day 1, 3, 7, 10, 14, 16 days after production.
Reducing sugar content was measured by the Schrool Regenboogen method according to the Hungarian standard MSZ 20900/5-1989.
Hyperspectral imaging were done using Headwall push broom system (900-1700 nm range, 256*320 InGaAs sensor matrix, 14 bit A/D, 800 nm/155 band = 5.16 nm/px spectral resolution, 214*100 mm field of view: 686*320 px image size, 100 mm/320 px = 312 µm/px spatial resolution, 45/0 illumination geometry, Headwall Photonics, Inc, Fitchburg, MA, USA) and Argus calibration and data acquisition software [11]. The stable setup,
proper calibration method and pixel-noise handling provided the same result for a flat surface, as a conventional spectrophotometer. The mean spectra of selected region of interests (ROI) were preprocessed and saved by Cubrowser Matlab algorithm as Figure 1 shows [11].
Texture analyser Ta-Xt2 was used for penetrometric texture analyses. The maximal force (rupture point) was measured along drying rod at 7 points during 4 weeks of storing.
Conductivity of the samples was measured with HP4284A Precision LCR Meter that acquires data in 20 Hz to 1 MHz test frequency range. Tests were made on 48 selected frequencies at 7 points of drying rod during storage time.
For statistical analyses discriminant analysis and principal component analyses in SPSS program were used.
Figure 1. The spectral crossection at 1445nm of a hypercube in Cubrowser algorithm
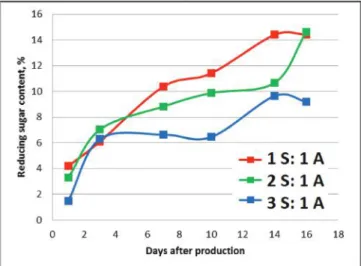
Figure 2. Changing of the reducing sugar content during storage of different marzipan samples (ratios of S- sugar, A-almond)
3. Results and Discussion
During the storage of the marzipan samples as expected sucrose inverted into glucose and fructose, as it can be followed on Figure 2. The speed of conversion was the highest in the first 3 days of storage. In case of a 2 sugar: 1 almond sample (67% of sugar in
the recipe) it seems, that the conversion has not ended after 16 days, which is not in harmony with the literature data. At the end of the storage, the reducing sugar content has reached a maximum of 14.3% in case of 1 sugar: 1 almond marzipan and a maximum of 9.5% in 3 sugar: 1 almond marzipan.
Correlation of storage time and hyperspectral data
The images of the marzipan prisms were divided into 7 regions.
The spectra of these regions were averaged and further used for the evaluation Evaluations were done on the raw data, the first derivate and on the normalized raw data and its first derivate using Argus software developed by Firtha [11]. These data were then used for further analysis to define correlations between storage time and hyperspectral data and type of marzipan and spectral data.
In the first analysis the correlation was studied between the day of storage and the spectral data, not taken into account which sugar to almond ratio the marzipan sample had. During the storage of marzipan the shape of the spectra have not changed significantly, independently from the type of marzipan. The measured values on day 3 were outstanding most probably connected to a measurement failure, and therefore those values were left out from further analyses.
Using the discriminant functions a classification was done, where 88.6% of the original grouped cases were correctly classified, and using randomly selected data a cross validation
resulted also in a good classification (83.8% of samples groups were correctly classified).
The discriminant function coefficients show, that the lower wavelenghts (960-1100 nm) are the most useful to define how many days were gone after production.
Correlation of sugar to almond ratios and hyperspectral data
Figure 3 shows the spectral data of the different marzipan samples after the first and sixteenth day of storage. The biggest differences can be seen around 1200 nm, which is, where oils are absorbing the most light according to the literature data. In the marzipan, where the same amount of sugar and almond was, the oil content is the highest among the samples, so its reflectance is the biggest on this wavelength. Above 1400 nm the spectra of the 1 sugar: 1 almond sample is smooth, where the other samples show peaks.
According to literature data in this region sugars and water significantly form the reflectance values [12].
Figure 3. Reflectance spectra of marzipan samples day 1 and day 16 after production, red line 1S:1A, green line 2S:1A, blue line 3S:1A, where S is sugar,
A is almond, ratios on dry matter base
Figure 4. Weights of the wavelengths as independent variables in PCA With discriminant analysis a clear classification could be done
among sample groups according to their sugar content. The group centroids are in case of 2 and 3 marzipan samples (2 sugar : 1 almond and 3 sugar: 1 almond ratios) closer to each other, then in case of sample 1 (1 sugar : 1 almond). Along function 1 better dicrimination has been reached, then along function 2. There was
a 100% success in the classification of the groups,also in cross- validation.
In this analysis not only the earlier mentioned 1200 nm (oil content related region) can be found as a significant wavelength for the discrimination, but also the lower regions (960-1000 nm) are important factors.
Using discriminant analysis we could distinguish among the marzipan samples of different sugar content. With principal component analysis (PCA) we identified the wavelengths which gave the biggest significant differences between the studied samples (Figure 4) Wavelengths of which weight is above 0.25, have a significant effect in the components of the discrimination in PCA. It is interesting to see, that the signs of each component is changing at the wavelengths which were mentioned earlier in the discriminant analysis.
Discussion of the penetrometric, electric and hyperspectral data
Hardness of marzipan can be described as the maximum force needed to rupture the surface of the sample. Conductivity of
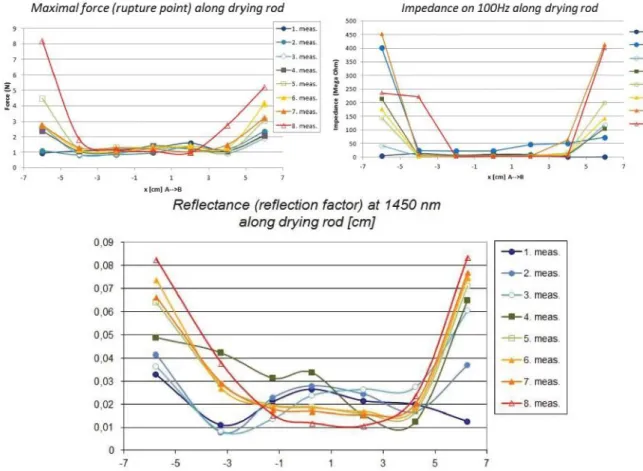
marzipan is directly connected to the bound state of water. In Figure 5, three graphs can be seen representing the hardness, the impedance and the reflectance values of the marzipan rods, measured 2 times a week during a 4 week storage period. On the x axis the dimension of the marzipan rod is described. 0 in this case means the middle point of the rod. Although the force/impedance/spectral values do not give an exact representation of the fructose content, the spatial distribution of the data shows, how the sides are drying out more, then the inner parts of the rods. In the middle of the rods, where the fructose could withhold the drying out of marzipan, hardness remained lower, impedance of the samples were smaller and the spectral data showed also lower values at 1450 nm, which is the region connected to water.
Figure 5. Hardness (maximal force), impedance and reflectance at 1450 nm of marzipan rods during storage at 17°C, represented as measured on the surfcae of a marzipan rod from side to side Measuring fructose content of marzipan by optical methods
faces many obstacles. Polarimetry is not of use, because there are more sugar components and therefore the diffuse reflection of the surface disperses the polar plane.
Spectroscopy is also not suitable, because one can differentiate only between monosaccharides and disaccharides, but not between sugar type as glucose and fructose (both are monosaccharides, with similar spectra).
However as the fructose is hygroscopic, it attracts and binds water, the spatial distribution of properties, which are depending on the water content (like absorption at 1450 nm), is characteristic.
The moisture content of a drying wall from a normal material is cosine-like (see Fourier). In case of hygroscopic material, like fructose, the spatial distribution is constant in the middle and changes on the edges only. This can be followed by hyperspectral method, thus it allows checking the fructose content of a marzipan sample.
4. Conclusions
Hyperspectral imaging has the advantage, that samples can be measured without polluting them. Although this measurement cannot give exact data about the fructose content of marzipan, the spatial distribution of the electric, penetrometric and hyperspectral data were similar.
With discriminant analyses we were able to make classifications according to the sugar content of the marzipan and it was possible to distinguish among the days of storage as well.
The fructose content of marzipan cannot be measured by usual optical ways (polarimetry, spectroscopy), but since fructose is hygroscopic, the spatial distribution of spectral properties can be characteristic.
Further research is needed to see, if hyperspectral technique can be used on packed samples, too.
Acknowledgements
The Project has been supported by the European Union and co- financed by the European Social Fund (grant agreement no.
EFOP-3.6.3-VEKOP-16-2017-00005).
References
[1] Chandrasekaran, M.: 2015. Enzymes in Food and Beverage Processing, CRC Press, Boca Raton.
[2] Mohos, F.: 2010. Confectionery and Chocolate Engineering:
Principles and Applications, John Wiley & Sons, UK.
[3] Edwards, W.P.:2000. The Science of Sugar Confectionery, Royal Society of Chemistry, UK.
[4] Christensen, J., Nørgaard, L., Heimdal, H., Pedersen, J.G.
and Engelsen, S.B.: 2004. Rapid Spectroscopic Analysis of Marzipan – Comparative Instrumentation. Journal of Near Infrared Spectroscopy, Vol. 12. pp. 63–75.
http://dx.doi.org/10.1255/jnirs.408
[5] Westad, F., Afseth, N. K., Bro, R.: 2007. Finding relevant spectral regions between spectroscopic techniques by use of cross model validation and partial least squares regression. Analytica Chimica Acta Vol. 595. No. 1-2. pp. 323–327.
http://dx.doi.org/10.1016/j.aca.2007.02.015
[6] Firtha, F.: 2007. Development of data reduction function for hyperspectral imaging. Progress in Agricultural Engineering
Sciences, Vol. 3. No. 1. pp. 67-88.
http://dx.doi.org/10.1556/Progress.3.2007.4
[7] Firtha, F., Fekete, A., Kaszab, T., Gillay, B., Nogula-Nagy, M., Kovács, Z., Kántor, D.: 2008. Methods for improving image quality and reducing data load of NIR hyperspectral images.
Sensors (Basel) Vol. 8. No. 5. pp. 3287-3298.
http://dx.doi.org/10.3390/s8053287
[8] Talens, P., Mora, L., Morsy, N., Da-Wen Sun, L.:2013.
Prediction of water and protein contents and quality classification of Spanish cooked ham using NIR hyperspectral imaging. Journal of Food Engineering, Vol. 117. No. 3. pp. 272–280.
http://dx.doi.org/ 10.1016/j.jfoodeng.2013.03.014
[9] Huang, M., Wang, Q., Zhang, M., Zhu, Q.: 2013. Prediction of color and moisture content for vegetable soybean during drying using hyperspectral imaging technology. Journal of Food Engineering, Vol. 128. pp. 24-30.
http://dx.doi.org/10.1016/j.jfoodeng.2013.12.008
[10] Jung, A., Kardeván, P., Tőkei, L.: 2007. Hyperspectral Technology in Vegetation Analysis. Progress in Agricultural Engineering Sciences, Vol. 2. No. 1. pp. 95–117.
http://dx.doi.org/10.1556/Progress.2.2006.1.5
[11] Firtha, F.: 2010. Argus and Cubrowser Algortithms.
ftp://fizika2.kee.hu/FFirtha/Argus-Cubrowser.pdf (Accessed 20 April 2015).
[12] Burns, D.A., Ciurczak, E.W.:(eds.) (2007): Handbook of Near-Infrared Analysis. CRC Press, Boca Raton.