Journal of the European Ceramic Society, 2018; DOI: 10.1016/j.jeurceramsoc.2018.02.033
The structural and mechanical characterization of TiC and TiC/Ti thin films grown by DC magnetron sputtering
Zsolt Fogarassy1, Nikolett Oláh1, Ildikó Cora1, Zsolt Endre Horváth1, Tamás Csanádi2, Attila Sulyok1, Katalin Balázsi1
1Institute for Technical Physics and Materials Science, Centre for Energy Research, Hungarian Academy of Sciences, Konkoly-Thege M. str. 29-33, 1121 Budapest, Hungary
2Institute for Materials Research, Slovak Academy of Sciences, Watsonova 47, 040 01 Kosice, Slovakia
Keywords
TEM, TiC, DC magnetron sputtering, Hardness, Nanocomposite Abstract
The formation of TiC and Ti phases and their influence on their mechanical properties was studied in this work. Thin layers were deposited by DC magnetron sputtering at room temperature in ultrahigh vacuum from Ti and C targets.
Cubic TiC phase (c-TiC) was formed from 58 to 86 at% Ti content. First formation of hexagonal Ti (h-Ti) occurred from 86 at% Ti content. The c-TiC disappears from 90 at% Ti content. Films with 86 at% Ti content the c-TiC structure can transform to h-Ti by sequential stacking faults. Dominance of c-TiC(111) texture with increasing Ti content was observed.
The hardness of thin films agree with structural observations. The highest hardness value (~26GPa) showed the c-TiC thin film with 67 at% Ti content. The nanohardness values showed decreasing character with increasing Ti content over 70 at%. The lowest values of nanohardness (~10GPa) was observed for thin films with only h-Ti phase.
1. Introduction
One of the most promising hard coating material is the TiC. Many methods have been developed for preparation of TiC thin films. Magnetron sputtering is a standard method for industrial TiC coating deposition. For preparing TiC coatings with magnetron sputtering two main ways are followed in the literature: 1) Ti target is used in reactive acetylene [1] [2] [3]
[4] [5] [6] [7] [8] [9], 2) titanium and carbon targets were sputtered at the same time [10] [11]
[12] [13] [14]. The room temperature is the most used temperature for sputtering of TiC coatings, because it is commonly useable for industry [1] [2] [4] [10] [11] [15]. For replace the heat energy effect mostly bias is used on the substrate, but for growing of TiC films at room temperature (RT) it is not a criterion [10].
The mechanical property of TiC coatings or films deposited at RT, namely hardness, is typically ranged between 17 and 35 GPa [3] [5] [10] [12] [15]. In these publications it was common that the maximum hardness value was obtained at ~40 at% Ti content and the structure was formed from c-TiC nanocrystals with 5–20 nm size separated by few nanometer thin amorphous matrix [1]. This type of structures is well known about its high hardness [16].
Around the composition with this maximum hardness numerous publications studied the formed c-TiC / a-C two phase structures and its effect on the mechanical properties, but the film structures and mechanical properties with higher Ti content is less studied. Oláh et al.
demonstrated the hardness as a function of Ti content between 0 to 57 at.%. In deposited thin films with the maximum hardness, TiC nanocrystals were formed in amorphous carbon matrix [13] [17] [18]. Sedlackova et al. showed that the hardness depends on the width of the TiC columns and thickness of amorphous carbon matrix separating the crystallites [19]. With increasing Ti content c-TiC ceramics can be formed, and with higher Ti content layers with h- Ti structure form [10]. Hardness mostly reduced with the increase of the Ti content, but as previous shown that there is a compositional range, where the hardness of the samples increase with the increasing Ti concentration [13].
In function of the composition, a sharp change in the structure is presupposed between the formation of c-TiC and h-Ti phase based on XRD studies [10], in these layers the hardness is greatly reduced, therefore the ceramic/metal multiphase thin film has received much less attention. Nevertheless, in some applications where flexibility is important addition to the hardness and the presence of amorphous carbon is undesirable this composition range can also be interesting.
In this work, thin films were deposited in the compositional range of 57 to 95 at.% Ti concentration by DC magnetron sputtering at room temperature in ultrahigh vacuum from two targets (Ti and C) in order to structurally and mechanically characterize these ceramics in this less studied compositional range. Our aim was to reveal the conditions of formation and the influence of the structure and texture of the films on the mechanical properties (e.g.
nanohardness). The structure characterization was carried out by XRD, TEM and HRTEM analyses. The investigated composition range was chosen to continue our previous work [13]
which focuses on the structure transitions between the TiC / a-C and the TiC phases. Here the transition of the TiC and TiC / Ti phases with higher Ti content will be shown. This is the first
comprehensive (TEM and mechanical) study of magnetron sputtered TiC layers with such a high Ti content.
2. Experiment
Ultrahigh vacuum sputtering system with background pressure of 3*10-8 mbar were used for film deposition from two separate targets; C with 99.999% and Ti with 99.995%, target purity. The argon gas pressure was 2,5*10-3 mbar during the sputtering. Before sputtering the background pressure was around 3*10-8 mbar. The substrate during the sputtering was not biased or heated. An approx. 300 nm thick amorphous SiO2 layer was used as a substrate, which was located on a single crystal Si. The thickness of the grown layers was kept at constant values (±10 nm). For the nano-hardness measurements the layer thicknesses were around 600 nm, while for the TEM and HRTEM studies mostly 150 nm thick layers were studied. The composition of the samples was controlled by the sputtering power. In the case of the carbon target altered between 25-150W while in the case of the Ti target it was between 70-150W. Based on preliminary calibration (The titanium and carbon growth velocity were determined by sputtering only Ti or carbon target for a period of time using different sputtering powers. The thickness of the layers was determined by TEM on cross-sectional TEM samples. Depending on the sputtering power, the thickness of the layers divided by the growth time namely the growth velocity was linearly varied, so the growth rates could be determined at the used sputtering powers in the work.), with such target powers the growth velocities were the follows for each samples: VC = 0.07 to 0.41 Å / s, VTi = 1.12 to 2.4 Å / s and the Ti composition of the layers varied between 58-95 at.%. However, for these calculated concentration the self-sputtered growth velocity of the carbon and titanium was used, due to that the real composition can be different because of the distinct adhesion.
The films were investigated by X-ray Photoelectron Spectroscopy (XPS) using Al-anode. The 5 x 5 mm sized specimens were cut out and introduced for the analysis. The oxidation from the deposited film surface was removed by Ar ion bombarding in order to detect the internal composition of the films. Glancing angle (80° angle of incidence) ion beam and low ion energy (1 keV) were used to limit the possible damage of the top surface of the films. The XPS spectra were acquired using special CMA with retarding field (type DESA 105 made by Staib Instruments Ltd). Constant energy resolution of 1.5 eV was applied for all measurements. Composition was determined from the main XPS lines of the constituents as follows: C - 1s at 284.4 eV, Ti - 2p ½ + 3/2 at 454.0 eV, O - 1s at 530.0 eV and Ar - 2p at 242 eV.
The mechanical properties of the deposited films were investigated by nanoindentation technique. The nanohardness (H) and elastic modulus (E) of the nanocomposite coatings were measured by a Nanoindenter Agilent G200 (USA) device with a Berkovich diamond indenter at room temperature. Clear areas were selected for indent investigation and 4 x 4 indents were performed on each sample with a distance of 20 µm between the indents. Prior to the indentation the tip was calibrated on a fused silica reference sample resulting reliable data from the depth of ~ 20 - 40 nm. It is important to note that the measured hardness values belonging to the depth range of 10% depth of total film’s thickness corresponds indeed to the
coating properties but the elastic modulus is most probably influenced by the substrate effect even at lower depths. Continuous stiffness measurement (CSM) mode with depth limit of 500 nm was applied for continuous registration of load, displacement and stiffness to determine the coating’s properties and to separate the effect of the substrate. Depth control mode was used during CSM method with standard frequency (f), amplitude (A) and strain rate (ε ̇) of f = 45 Hz, A = 2 nm and ε ̇ = 0,05 1/s, respectively. The used Young’s modulus and Poisson’s ratio parameters of diamond tip were Etip = 1141 GPa and νtip = 0.07, respectively. The hardness and the elastic modulus values were automatically calculated according to the measuring standards based on the work of Oliver and Pharr [20]. Poisson’s ratio of the coatings was set to ν=0.28 uniformly but its selection (in the range of 0.2-0.4) has an influence of only a couple of percent on the evaluated elastic modulus. Visibly aberrant data were neglected from the averaging. More details about the applied CSM method and the evaluation process can be found elsewhere [20] [21].
The structure of the thin films was investigated by transmission electron microscopy (TEM, Philips CM20 operated at 200 kV accelerating voltage) and high resolution transmission electron microscopy (HRTEM, JEOL 3010 operated at 300 kV accelerating voltage). The cross-sectional TEM samples were prepared by conventional Ar ion beam milling. For evaluation of the selected area electron diffraction (SAED) patterns, the ProcessDiffraction program was also used [22] [23] [24].
The phase composition and the lattice parameters of the deposited films were determined by X-ray diffraction (XRD), using a Bruker AXS D8 Discover diffractometer equipped with a Göbel-mirror and a scintillation detector using Cu Kα radiation. Measurements were performed over the interval of 2θ=30-43° with a step size of 0.05° and speed of 0.15°/min.
3. Results 3.1. Composition
The composition of the samples was measured by XPS analysis, and also was calculated from the pre-growth rates. The compositions of the samples are summarized in Figure 1. As anticipated, the measured and calculated results are not the same, however strictly following the same trend. It is similar to Inoue et al. [10]. Because of the lack of random error in the concentration lines, it refers to systematic errors in the methods. The difference of concentration values provided by the two methods can be explained reasonably by the followings.
First, at the calculation of the composition, the concentration of Ti was calculated using the following formula:
𝐶 = ∙ /
∙ / ∙ / ,
where ρC, ρTi are the carbon and the titanium density, MC, MTi are the molar mass of carbon and titanium, while the vC and vTi are the carbon and the titanium growth velocity [nm/s] at one power, which was defined sputtering only Ti and only carbon respectively. However,
separate adhesion during the sputtering may differ from that when the targets sputtered together, so with the calculation may be a composition with a systematic errors was determined. Prior to the XPS measurement the sample surface is bombarded with Ar+ ions to eliminate the surface oxide, during that the enrichment of the carbon on the surface is possible due to preferential sputtering as published e.g. [18]. So in that way the measured carbon concentration can be a slightly larger than the real one. It may resulted in a systematic error of C concentration is about 3-5%. Additionally, the usage of weight factors from the literature can be also yield a 5% systematic error.
From now on, we will refer to each sample with the calculated composition based on the growth velocity.
Beside of detecting the average composition, the XPS spectra could provide some information about the chemical bound of C component because of the 3eV shift of carbide state. In the early experiments it was found [13] at higher C content layers, that the carbon partly bound to Ti forming TiC and partly remained in elemental state forming an amorphous C layer between the TiC grains. Executing a peak shape analysis of C 1s line of the current layers, we found only two distinguishable components. These were true carbide C at 282 eV and an intermediate carbide C at 283.5 eV. The latter is the result of a decay of TiC using ion bombardment. Because no elemental carbon was detected by XPS in the layers, it means that non-binding carbon amount is below the sensitivity of the measurement. Though the detection limit of C by XPS is far below 1%, the confidence interval of the decomposition of a peak shape is about 3 % if the component in question is near to another intense component.
Fig. 1 The Ti concentration of the thin films deposited at various sputtering powers determined from calculation of grow velocities and XPS measurement.
3.2. Mechanical behavior of deposited films
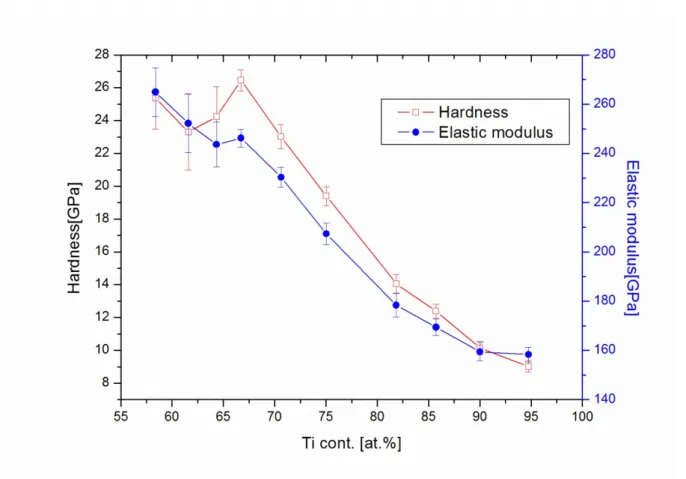
The results of the nano-hardness and elastic modulus measurements are shown in Figure 2.
The minimum Ti content was at least 58 at.% in the samples which were tested in this work.
The mechanical properties of TiC/a-C layer with lower Ti content, but with the same growth conditions are summarized in an earlier work [13].
The hardness of samples are around 25 GPa between 58 at.% and 70 at.% Ti content. The maximum hardness was measured to 26 GPa in the layer with 67 at.% Ti content. After that, the measured nano-hardness is decreasing near linearly with the increasing Ti content. The nano-hardness value falls below 10 GPa only in the case of the sample containing 95 at.% Ti, which value is still 2-4 times larger than the micro-hardness of the pure nano or ultrafine titanium [25].
The elastic modulus varies similarly with the hardness. With the increase of the Ti composition it was decreasing. Its value decreases from 260 GPa to 160 GPa with increasing of Ti content in deposited films.
Fig. 2 The nano-hardness and elastic modulus in the function of the Ti content.
3.3. Structural characterization
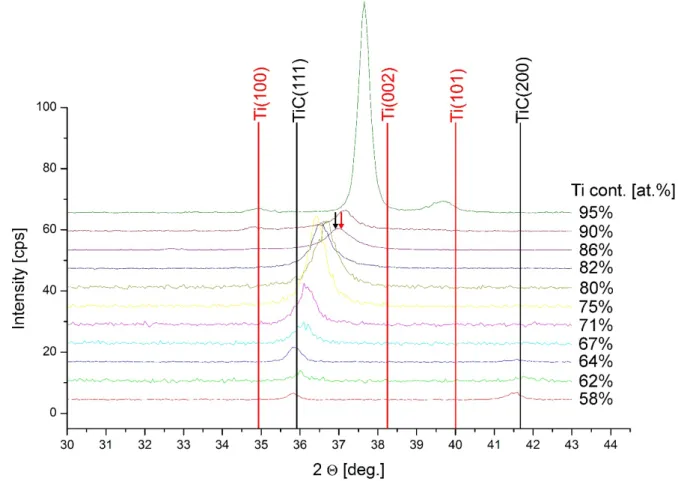
Based on the XRD patterns (Fig. 3) and the TEM study (Fig. 5), only two types of phases were formed in the sputtered samples. The c-TiC structure is formed in the layers with 58-85 at.% Ti content, while in the sample containing 86 at.% Ti the h-Ti structure also appear. In the case of the layer with 90 at.% of Ti content and more, only the h-Ti structure was present.
Since the more interesting peaks of these two structures are relatively close to each other, a smaller angular range was examined in more detail by XRD. By increasing the Ti content from 58 at.% to 82 at.% {111} texture appears in the layers with c-TiC phase, that can be observed on the cross-sectional selected area electron diffraction (SAED) patterns in Figure 5 and on the texture coefficients calculated from XRD shown on Figure 4., and Also the Ti-rich c-TiC layers XRD reflections are shifted. This fact is well known in the literature [10]. With increasing Ti content, the lattice periodicities (d111, d001) of the c-TiC are increasing (summarized in Figure 4). In layers with h-Ti structure, the d001 differs from that of pure titanium. This difference decreases with increasing titanium content. There is also a significant {001} texture in these layers. For a sample with 86% titanium, the TiC (111) and h-Ti (001) XRD peaks are so close that they cannot be resolved. Only the widening of the peak and the presence of the very weak Ti (100) peak suggests that there are two phases. This statement is confirmed by the HRTEM results, presented later.
Fig. 3 XRD patterns of samples with different composition. c-TiC was formed in the layers with 58 and 86 at.% Ti content, c-TiC and h-Ti co-formation was observed in the layers with
86 at.% Ti. Only h-Ti phase was observed for films with 90 at% and higher Ti content.
Fig. 4 The change of the lattice distance of the c-TiC, and the h-Ti structure and the texture coefficient (TC) [26] as the function of Ti content based on the XRD peaks shifts. The texture
coefficient was calculated from the XRD patterns using the TiC(111) and TiC(200) peaks from the layers with c-TiC, in the case of the layers with h-Ti the Ti(100) and the Ti(002)
peaks were used.
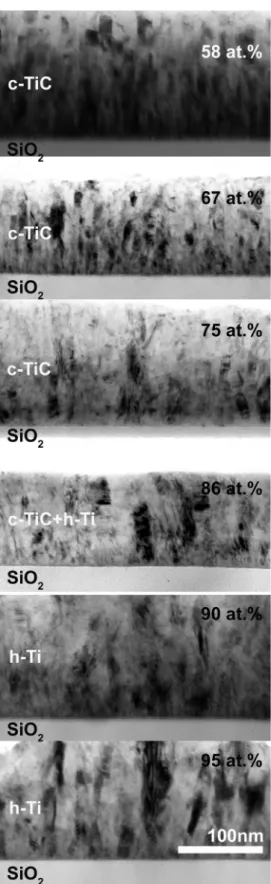
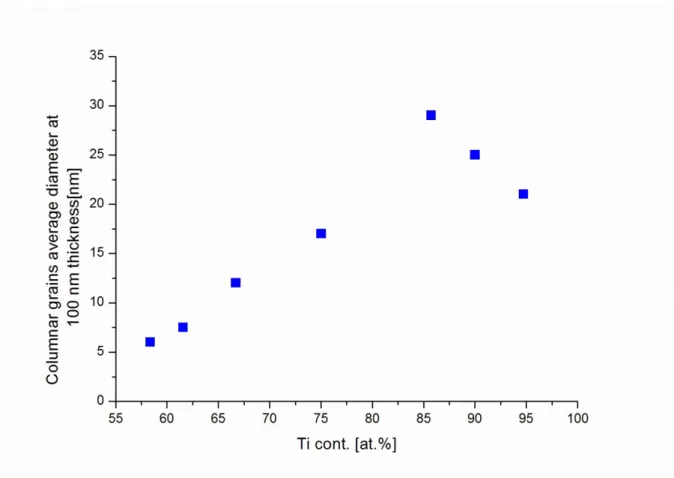
The structural investigations of the films clearly show the formation of columnar crystallites (Fig. 6). The widening of the columnar crystals is common going up in the layer. The rate of the widening and the average cross diameter of the crystals are higher in the c-TiC films with higher Ti concentration. The width of the grains measured at 100 nm thickness versus titanium concentration is shown in Figure 7.
Both the h-Ti structure and the c-TiC structure can be formed in the layer with 86 at.%
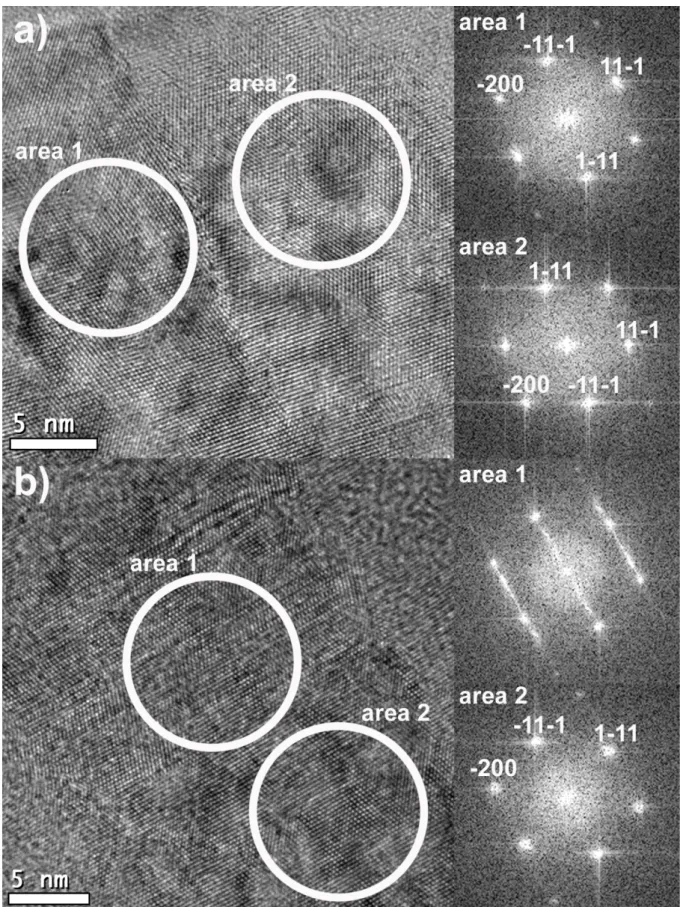
titanium content based on SAED (Figure 5) and XRD patterns (Figure 3). The HRTEM investigation shows that dominantly c-TiC structures are formed in the layer. However, c-TiC grains contain several stacking faults. There are some areas where after a single stacking fault the orientation of the grain changes in one part of the grain (see Fig. 8.a right). In such areas where the two grains with different orientations meet, they form (112) type incoherent twin boundary perpendicular to the surface of the substrate (see Fig. 8). In certain areas the density of stacking faults increases in certain areas and locally the crystal structure of c-TiC can pass through h-Ti structure, as shown in Figure 8.b.
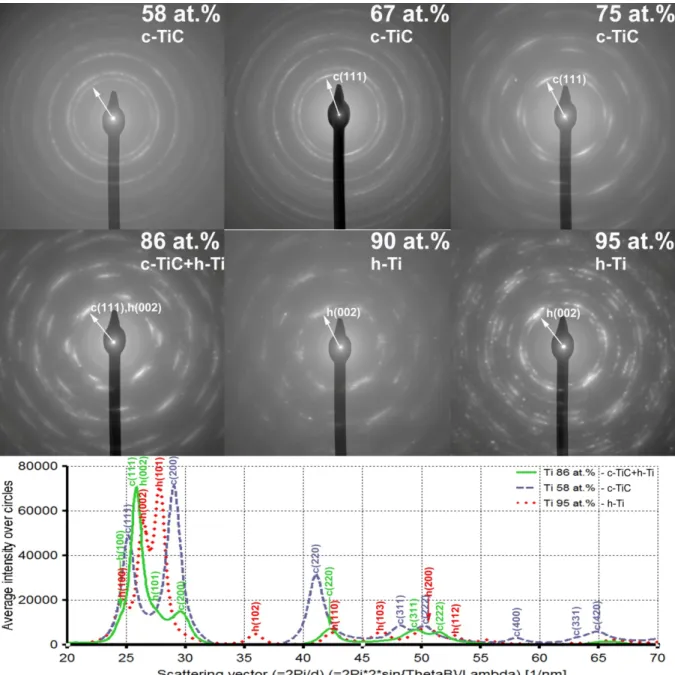
Fig. 5 SAED patterns of magnetron sputtered TiC layers with different Ti concentrations. The white arrows are perpendicular to the substrate surface. Significant (111) texture is formed in the c-TiC layers with the Ti concentration increase. On the bottom of the image the circularly integrated intensity is presented of tree different layer (films with Ti content of 58, 86 and 95
at.%). The present of three different phases (c-TiC, c-TiC+h-Ti, h-Ti) was showed.
Fig. 6 Bright field TEM images of magnetron sputtered TiC layers with different Ti concentrations. Columnar grains were formed in each sample with column diameters
increasing with Ti concentration.
Fig. 7 The average diameter of columnar grains at 100 nm far from the substrate surface as the function of Ti content.
Fig. 8 HRTEM images of the TiC layer with 86 at % Ti content. In the a) HRTEM image a incoherent twin boundary and the FFTs from twin boundary two side. In the b) HRTEM image, stacking faults in the c-TiC are forming h-Ti structure, as seen on its associated FFTs
(in one FFT area are from twin boundaries, in the other FFT area twin boundaries are not present).
4. Discussion
Based on our previous study [13], a TiC layer with a hardness maximum of 25-28 GPa can be formed in a narrow composition range around 44 at.% Ti content. In these layers, the crystalline c-TiC particles are embedded in an amorphous carbon matrix [13]. By increasing the Ti content beyond this composition, a decrease in hardness can be noticed and at 58 at.%
Ti content re-increase of the hardness appears [13]. Based on our investigations, a c-TiC layer with a hardness of about 25 GPa can be formed with a Ti content of 58-71 at.%. This value is comparable with H of bulk TiC ~ 25 GPa [mems.org]. With the increase of Ti content from 71 at.% to 86 at.% Ti content, the hardness of the layers is nearly linearly decreasing.
Based on the structural investigations, in this concentration range the c-TiC lattice periodicities (d111, d100) decrease until the 86-at.% Ti layer where the hexagonal structure is formed in the c-TiC grains based on the TEM and HRTEM observations. The hardness is fall down to 10GPa in the layers containing 90 at.% Ti content, when only the h-Ti structure is formed. In the case of 95 at.% Ti content, the measured nano hardness exceeds the hardness of TiAl6V4 alloys used for implants (3-7GPa) [27].
In the investigated composition range, strong {111} type texture was formed in the c-TiC layers perpendicular to the surface of the substrate. The rate of the texture was increasing with the Ti concentration. In addition to the formation of the texture, the increase of the diameter of the c-TiC columnar grains can also be observed with higher Ti concentration. The deposition was carried out in the zone 1, based on the Zone Model [28]. The substrate temperature (Ts≈300K), and both the c-TiC melting point (TmTiC = 3430K) and the melting point of h-Ti (TmTi = 1941K) were taken into account. The ratio of the substrate and melting point of two phases in the layers (Ts/TmTiC≈0.09, Ts/TmTi≈0.15) is less than 0.2 which means that the deposition is in the zone 1 region [28]. In this growth region, based on the zone model, the surface diffusion processes determine the formation of the structure of the layers;
the bulk diffusion has no significant impact. No significant texture forms during the growth of the grains. The grain boundaries run relatively parallel if the growth of the columnar grains is not inhibited by the contamination. The grown c-TiC layers with 58-65 at.% Ti concentration were formed according to zone 1 from Zone model [28]. However, by increasing the Ti content, <111> textures are starting to form. The formation of the texture may be due to the decrease of the melting point of the layers, moving away from the stoichiometric structure, so that get closer to the T zone region of the Zone model where a texture is typically formed with competing growth, and this is also supported by the fact that the diameter of the grains also increases with increasing titan content. However, typical V-shaped grains from the zone-T region appear less on TEM images. Another reason can be the formation of the texture if special orientation of the grains formed during nucleation by minimizing interfacial energies, but this would not explain the increase of the diameter of the columnar grains in the function of the Ti concentration.
Lattice periodicities of the c-TiC layers gradually decrease with increasing Ti content. The h- Ti c-cell parameter behaves similarly, it increases with decreasing Ti content. The two phases are formed simultaneously at 86 at.% Ti content.
The d111 of c-TiC is reduced so much and parallel the d0001 of h-Ti increases so that the two values are nearly the same. As a result of these the two phases can grow epitaxial on each other (HRTEM Fig. 8), exchanging by stacking faults. It is assumed that the carbon content of these areas may fluctuate. This epitaxial growth also facilitated by the h-Ti <0001> texture that is formed due to the carbon. When only pure Ti was deposited with no carbon at room temperature no significant texture was formed [29].
5. Conclusion
The c-TiC and h-Ti thin films can be formed by DC magnetron sputtering of carbon and titanium targets with Ti content between 58 and 95 at.%. It was shown, that c-TiC structure was formed between 58-86 at.% Ti content. The first presence of hexagonal phase, namely h- Ti structure, was observed at 86 at%. The c-TiC structure can transform to h-Ti structure with stacking faults. Only h-Ti was grown at and above 90 at.% Ti content. The correlation between structure and mechanical properties was showed. The hardness of thin films agrees with structural observations. The hardness ~ 25GPa was measured in films with c-TiC columns. The highest hardness (~26 GPa) showed the c-TiC thin film with 67 at.% Ti content.
Previously, layers with similar hardness values were achieved by similarly grown condition containing about 45 at.% Ti, but at these layers the c-TiC particles are embedded in an amorphous carbon matrix. At higher Ti content no amorphous C was found in the deposited layer. The nano-hardness values showed decreasing character for films with the co-existence of c-TiC and h-Ti. The lowest values of nano-hardness (~ 10 GPa) was observed for thin films with only h-Ti phase.
The films with pure cubic TiC phase exhibited two times higher hardness values than films with the softer hexagonal Ti phase. It was proven, that the lowest hardness value of around 10 GPa in films with 90-95 at% Ti is still 2-4 times higher than the hardness of various Ti alloys like the TiAl6V4 alloy that is often used as implant material.
6. References
[1] T. Zehnder and J. Patscheider, Nanocomposite TiC/a–C:H hard coatings deposited by reactive PVD, Surface and Coatings Technology 133–134 (2000) 138–144.
[2] T. Zehnder, P. Schwaller, F. Munnik, S. Mikhailov, J. Patscheider, Nanostructural and mechanical properties of nanocomposite nc-TiC/a-C:H films deposited by reactive unbalanced magnetron sputtering, J. Appl. Phys. 95 (2004) 4327.
[3] W. Gulbiński, S. Mathur, H. Shen, T. Suszko, A. Gilewicz, B. Warcholiński, Evaluation of phase, composition, microstructure and properties in TiC/a-C:H thin films deposited by magnetron sputtering, Applied Surface Science 239 (3-4) (2005) 302–310.
[4] S. Zhang, X. L. Bui, J. Jiang, X. Li, Microstructure and tribological properties of magnetron sputtered nc-TiC/a-C nanocomposite, Surface and Coatings Technology 198 (2005) 206-211.
[5] Y.T. Pei, D. Galvan, J.T.M. De Hosson, A. Cavaleiro, Nanostructured TiC/a-C coatings for low
friction and wear resistant applications, Surface and Coatings Technology 198 (2005) 44-50.
[6] Y. Hu, L. Li, X. Cai, Q. Chen, P. K. Chu, Mechanical and tribological properties of TiC/amorphous hydrogenated carbon composite coatings fabricated by DC magnetron sputtering with and without sample bias, Diamond and Related Materials 16 (2007) 181-186.
[7] P. Vašina, P. Souček, T. Schmidtová, M. Eliáš, V. Buršíková, M. Jílek, M. Jílek Jr., J. Schäfer, J.
Buršík, Depth profile analyses of nc-TiC/a-C:H coating prepared by balanced magnetron sputtering, Surface and Coatings Technology 205 (2011) S53-S56.
[8] P. Souček, T. Schmidtová, L. Zábranský, V. Buršíková, P. Vašina, O. Caha, M. Jílek, A. E. Mel, P.-Y.
Tessier, J. Schäfer, J. Buršík, V. Peřina, R. Mikšová, Evaluation of composition, mechanical properties and structure of nc-TiC/a-C:H coatings prepared by balanced magnetron sputtering, Surface and Coatings Technology 211 (2012) 111-116.
[9] J. Daniel, P. Souček, L. Zábranský, V. Buršíková, M. Stupa, On the effect of the substrate to target position on the properties of titanium carbide/carbon coatings, Surface and Coatings Technology 328 (2017) 462-468.
[10] E. Kusano, A. Sato, N. Kikuchi, H. Nanto, A. Kinbara, Preparation of TiC films by alternate deposition of Ti and C layers using a dual magnetron sputtering source, Surface and Coatings Technology 120-121 (1999) 378-382.
[11] S. Inoue, Y. Wada, K. Koterazawa, Deposition of TiC films by dual source dc magnetron sputtering, Vacuum 59 (2000) 735–741.
[12] A. Mani, P.l Aubert, F. Mercier, H. Khodja, C. Berthier, P. Houdy, Effects of residual stress on the mechanical and structural properties of TiC thin films grown by RF sputtering, Surface and Coatings Technology 194 (2000) 190-195.
[13] N. Oláh, Zs. Fogarassy, A. Sulyok, J. Szívos, T. Csanádi, K. Balázsi, Ceramic TiC/a:C protective nanocomposite coatings: Structure and composition versus mechanical properties and tribology, Ceramics International 42 (10) (2016) 12215–12220.
[14] K. Balázsi, M. Vandrovcová, L. Bačáková, C. Balázsi, I. Bertóti, F. Davin, G. Z. Radnóczi,
Mechanical Behavior of Bioactive TiC Nanocomposite Thin Films, Materials Science Forum 729 (2013) 296-301.
[15] J. Tang, J. S. Zabinski, J. E. Bultman, TiC coatings prepared by pulsed laser deposition and magnetron sputtering, Surface and Coatings Technology 91 (1997) 69-73.
[16] J. Musil and J. Vlček, Magnetron sputtering of hard nanocomposite coatings and their properties, Surface and Coatings Technology 142-144 (2001) 557-566.
[17] N. Oláh, Z. Fogarassy, A. Sulyok, M. Veres, G. Kaptay, K. Balázsi, TiC crystallite formation and the role of interfacial energies on the composition during the deposition process of TiC/a:C thin
films, Surface and Coatings Technology 302 (2016) 410-419.
[18] N. Oláh, M. Veres, A. Sulyok, M. Menyhárd, J. Gubicza, K. Balázsi, Examination of nanocrystalline TiC/amorphous C deposited thin films, Journal of the European Ceramic Society 14 (2014) 3421- 3425.
[19] K. Sedláčková, R.O. Grasin, T. Ujvári, I. Bertóti, G. Radnóczi, Carbon-metal (Ni or Ti)
nanocomposite thin films for functional applications, Solid State Sciences 11 (2009) 1815-1818.
[20] W.C. Oliver and G.M. Pharr, An improved technique for determining hardness and elastic modulus using load and displacement sensing indentation experiments, J. Mater. Res. 7 (1992) 1564–1583.
[21] W.C. Oliver and G.M. Pharr, Measurement of hardness and elastic modulus by instrumented indentation: Advances in understanding and refinements to methodology, J. Mater. Res. 19 (2004) 3-20.
[22] J.L. Lábár, Electron Diffraction Based Analysis of Phase Fractions and Texture in Nanocrystalline Thin Films, Part I: Principles, Microsc. Microanal. 14 (2008) 287-295.
[23] J.L. Lábár, Electron Diffraction Based Analysis of Phase Fractions and Texture in Nanocrystalline Thin Films, Part II: Implementation, Microsc. Microanal 15 (2009) 20-29.
[24] J.L. Lábár, M. Adamik, B.P. Barna, Zs. Czigány, Zs. Fogarassy, Z.E. Horváth, O. Geszti, F. Misják, J.
Morgiel, G. Radnóczi, G. Sáfrán, L. Székely, T. Szüts, Electron Diffraction Based Analysis of Phase Fractions and Texture in Nanocrystalline Thin Films, Part III: Application Examples, Microsc.
Microanal. 18 (2012) 406-420.
[25] A.V. Sergueeva, V.V. Stolyarov, R.Z. Valiev, A.K. Mukherjee, Advanced mechanical properties of pure titanium with ultrafine grained structure, Scripta Materialia 45 (2001) 747-752.
[26] C. S. Barrett and T. B. Massalski, Structure of Metals, Third Edition: Crystallographic Methods, Principles and Data. Oxford: Pergamon Press, 1980.
[27] A.C. Sekkal, C. Langlade, A.B. Vannes, Tribologically transformed structure of titanium alloy (TiAl6V4) in surface fatigue induced by repeated impacts, Materials Science and Engineering: A 393 (2005) 140–146.
[28] P.B. Barna and M. Adamik, Fundamental structure forming phenomena of polycrystalline films and the structure zone models, Thin Solid Films 317 (1998) 27–33.
[29] C.-C. Ting, S.-Y. Chen, D.-M. Liu, Structural evolution and optical properties of TiO2 thin films prepared by thermal oxidation of sputtered Ti films, Journal of Applied Physics 88 (2000) 4628- 4633.
[30] B.V. Christ, Handbook of Monochromatic XPS Spectra, The Elements and Native Oxides.
Wilmington: Wiley, 2000.
[31] H.J. Kang, Y. Matsuda, R. Shimizu, Preferential sputtering of TIC under keV Ar+ ion
bombardment: Simultaneous sputtering-ISS measurement with He+ and Ar+ ions, Surface Science 134 (1983) L500-L504.
![Fig. 4 The change of the lattice distance of the c-TiC, and the h-Ti structure and the texture coefficient (TC) [26] as the function of Ti content based on the XRD peaks shifts](https://thumb-eu.123doks.com/thumbv2/9dokorg/1394948.116297/8.892.199.709.142.494/change-lattice-distance-structure-texture-coefficient-function-content.webp)