0139–3006 © 2019 Akadémiai Kiadó, Budapest DOI: 10.1556/066.2019.48.3.7
KOMBUCHA TEA BEVERAGE: MICROBIOLOGICAL CHARACTERISTIC, ANTIOXIDANT ACTIVITY, AND
PHYTOCHEMICAL COMPOSITION
E. IVANIŠOVÁa*, K. MEŇHARTOVÁa, M. TERENTJEVAb, L. GODOČÍKOVÁc, J. ÁRVAYd
and M. KAČÁNIOVÁc,e
aDepartment of Plant Storage and Processing, Faculty of Biotechnology and Food Science, Slovak University of Agriculture in Nitra, Tr. A. Hlinku 2, SK-949 76. Slovakia
bInstitute of Food, Environmental Hygiene, Faculty of Veterinary Medicine, University of Life Sciences and Technology, Jelgava, 8 K. Helmaņa iela, Jelgava, LV-3004. Latvia
cDepartment of Microbiology, Faculty of Biotechnology and Food Sciences, Slovak University of Agriculture in Nitra, Tr. A. Hlinku 2, SK-949 76. Slovakia
dDepartment of Chemistry, Faculty of Biotechnology and Food Science, Slovak University of Agriculture in Nitra, Tr. A. Hlinku 2, SK-949 76. Slovakia
eDepartment of Bioenergetics and Food Analysis, Faculty of Biology and Agriculture, University of Rzeszow, Zelwerowicza St. 4, 35-601 Rzeszow. Poland
(Received: 31 October 2018; accepted: 1 February 2019)
The aim of the present study was to determine the microbial composition, antioxidant activity, and content of phytochemicals in prepared kombucha tea beverage. Microbiota was identifi ed by MALDI-TOF mass spectrometry, antioxidant activity of beverage was tested by ABTS and phosphomolybdenum method, the total content of phytochemicals (polyphenols, fl avonoids, and phenolic acids) was measured by colorimetric methods. The major phenolic acids, fl avonoids, and methylxanthines were detected by high performance liquid chromatography (HPLC).
Candida krusei, Sphingomonas melonis, Sphingomonas aquatilis, Brevibacillus centrosporus, and Gluconobacter oxydans were the most abundant microorganisms. Antioxidant activity of kombucha tested by ABTS and phosphomolybdenum method was 1.16 mg TEAC/ml and 2.04 mg TEAC/ml, respectively, which values were higher than in black tea 0.67 and 0.81 mg TEAC/ml, respectively. Also, content of total polyphenols (0.42 mg GAE/
ml), fl avonoids (0.13 mg QE/ml), and phenolic acids (0.19 mg CAE/ml) was higher in kombucha than in black tea (0.18 mg GAE/ml; 0.02 mg QE/ml; 0.05 mg CAE/ml, respectively). Gallic, chlorogenic, syringic, and protocatechuic acids, and rutin and vitexin from fl avonoids were dominant in kombucha beverage detected by HPLC. Strong difference in caffeine contents, 217.81 μg ml–1 (black tea) and 100.72 μg ml–1 (kombucha beverage), was observed.
The amounts of theobromine were similar in black tea and kombucha, but theophylline was detected only in black tea in trace amount (0.52 μg ml–1).
Keyword: black tea, tea fungus, fl avonoids, phenolic acids, methylxanthines
Kombucha is a popular beverage consumed throughout the world. This health-promoting drink is a result of biotransformation of sugared tea by yeasts, fungi, and acetic acid bacteria (FU et al., 2017). The word ‘kombucha’ is derived from Japanese ‘seaweed’ (kombu) and
‘tea’ (cha). Microbial composition of kombucha depends on the original microbiota, geographic and climatic growth conditions, and the yeasts and bacteria species used (MALBAŠA
et al., 2014). Acetobacter xylinum is the most abundant among bacteria, while Zygosaccharomyces, Schizosaccharomyces, Candida, and Pichia are the predominant yeast
* To whom correspondence should be addressed.
Phone: +421376414421; e-mail: eva.ivanisova@uniag.sk
species (FU et al., 2017). Cultivation of kombucha beverage is preformed aerobically usually for 7–10 days under household conditions (ESSAWET et al., 2015). The sweetened black tea or green tea is the main substrate of the beverage, but herbal teas can be used also (FU et al., 2017). Acetic and lactic acid bacteria produce a variety of bioactive compounds during fermentation, which supplement the functional properties of kombucha established by tea polyphenols, sugars, organic acids, ethanol and water soluble vitamins (AMARASINGHE et al., 2018). Consumption of kombucha has been shown to have benefi cial effects on gastric, intestinal, and glandular activities, treatment of arteriosclerosis, toxin excretion, diabetes, nervousness, and aging problems (MALBAŠA et al., 2014). The main objective of the present study was to investigate microbial composition, antioxidant activity, and phytochemical composition of kombucha beverage prepared under laboratory conditions.
1. Materials and methods
1.1. Preparation of kombucha tea beverage
Kombucha culture was obtained from the local inhabitants of Liešťany, Slovakia, and was maintained in sugared black tea. The tea infusion was prepared traditionally by boiling 1 l of distilled water with 30 g of white sugar and 5 g of black tea leaves (Darjeeling, India) for 5 min and left to steep for 15 min. The sweetened tea was strained to remove the leaves while transferring to a sterile glass jar (2 l). After cooling to 22 °C, the tea was inoculated with the kombucha culture (pellicle). The jar was covered with paper towel. Fermentation was conducted at 22 °C for up to 7 days. In order to study the effect of multiple replicate fermentations on the quality characteristics of kombucha tea, procedure was prepared three times with the same conditions.
1.2. Chemicals
All chemicals used were of analytical grade and were purchased from Sigma-Aldrich (USA) and CentralChem (Slovakia).
1.3. Microbial analysis of kombucha tea beverage
An amount of 5 ml of kombucha tea beverage was diluted with 45 ml of sterile physiological saline (0.85%), and stirred on a horizontal shaker for 30 min to achieve a tenfolddilution.
Plate count agar (PCA) (Oxoid, UK) for bacteria, Malt extract agar base (MEA) (Oxoid, UK) supplemented with bromocresol green (0.020 g l–1) for yeasts were inoculated with 0.1 ml of suspension. Bacteria were incubated at 37 °C for 24–48 h and yeasts at 25 °C for fi ve days.
Growing colonies were recultivated on TSA at 30 °C for 48 h (Tryptic Soya agar, Oxoid, UK) and used for identifi cation with MALDI-TOF MS (KAČÁNIOVÁ et al., 2017).
1.4. Sample preparation and identifi cation with MALDI-TOF MS measurement
One colony of each isolate was transferred into an Eppendorf vial and mixed with a 300 μl of sterile water. After addition of ethanol (900 μl), the suspension was mixed and centrifuged (13 000×g, 2 min). The supernatant was removed and the pellets were dried at room temperature at least for 5 min. The pellets were resuspended in 20–50 μl of formic acid (70%) and the same amount of acetonitrile. After centrifugation (2 min at 13 000×g), 1 μl of
supernatant was spotted onto a sample position of a polished steel MALDI target plate and dried at room temperature. A 1 μl of MALDI matrix (solution of α-cyano-4- hydroxycinnamic acid (HCCA) in 50% acetonitrile/2.5% trifl uoro-acetic acid) was added to the spot and dried.
MALDI-TOF mass spectrometer was used (Microfl exTM, Bruker, USA) for automated measurement and data interpretation. MALDI Biotyper 3.0 software was used for profi le mass spectra processing. The logarithm of the score (log[score]) was displayed as the matching result. The MALDI Biotyper output was a log(score) between 0 and 3.0, which was calculated from a comparison of the peak list from an unknown isolate with the reference MSP in the database. A log(score) ≥1.7 indicated identifi cation at the genus level, log(score)
≥2.0 was set as the threshold for a match at the species level. Isolates with ≥2.0 were accepted as a correct identifi cation (KAČÁNIOVÁ et al., 2017).
1.5. ABTS radical cation decolorization assay
ABTS radical cation decolorization assay was determined by the method of RE and co- workers (1999) with slight modifi cations. Trolox (100–1000 mg l–1; R2=0.9991) was used as standard, and the results were expressed in mg ml–1 of Trolox equivalents.
1.6. Reducing power
Reducing power of beverage was determined by the phosphomolybdenum method of PRIETO
and co-workers (1999) with slight modifi cations. Trolox (10–1000 mg l–1; R2=0.998) was used as standard, and the results were expressed in mg TEAC/ml.
1.7. Total polyphenol content
Total polyphenol content was measured according to SINGLETON and ROSSI (1965)using Folin–Ciocalteu reagent. Gallic acid (25–300 mg 1–1; R2=0.998) was used as standard, and the results were expressed in mg GAE/ml.
1.8. Total fl avonoid content
Total fl avonoids were determined using the modifi ed method of WILLETT (2002). Quercetin (0.5–20 mg l–1; R2=0.989) was used as standard, and the results were expressed in mg QE/ml.
1.9. Total phenolic acid content
Total phenolic acid content was determined using the method of FARMAKOPEA POLSKA (1999).
Caffeic acid (1–200 mg l–1, R2=0.999) was used as standard, and the results were expressed in mg CAE/ml.
1.10. Determination of polyphenols and methylxanthines compositions by HPLC-DAD method
Polyphenols and methylxanthines compositions were determined using separation gradient method RP-HPLC/UV-DAD by Agilent 1260 Infi nity high performance liquid chromatograph (Agilent Technologies, Waldbronn, Germany). Separation was achieved on a Purosphere reverse phase C18 column (4 mm×250 mm×5 μm) (Merck, KGaA, Darmstadt, Germany).
The mobile phase for polyphenols consisted of acetic acid in methanol (A) (50/1000 ml); (B) acetic acid in HPLC grade water (50/1000 ml). The following gradient program was
employed: 0–5 min isocratic elution (20% A and 80% B), 5–11 min linear gradient elution (60% A and 40% B), and 80% A and 20% B 11–20 min. The mobile phase for methylxanthines consisted of HPLC methanol (A) and 0.1% formic acid in HPLC water (B). The following gradient program was employed: isocratic elution (20% A and 80% B) for 0–2 min, linear gradient elution (40% A and 60% B) for 2–15 min, and 40% A and 60% B for 15–20 min. The fl ow rate was 1 ml min–1. Column oven temperature was set to 25 °C, and the samples were kept at 4 °C in the Peltier sample manager. The DAD signal was received at 220–400 nm with preferred wavelength 330 nm for quantitative purposes with data acquisition rate of 5 Hz (NOVÁKOVÁ et al., 2010).
1.11. Statistical analysis
The experimental data were subjected to analysis of variance (Duncan’s test) at the confi dence level of 0.05, by the use of software SAS; correlation coeffi cients were calculated by CORR analysis (SAS, 2009).
2. Results and discussion
2.1. Microbial analysis of kombucha tea beverage
MALDI-TOF mass spectrometry revealed the presence of Candida krusei, Sphingomonas melonis, Sphingomonas aquatilis, Brevibacillus centrosporus and Gluconobacter oxydans in kombucha beverage. Candida sp. was found in a great number as well. RAMADANI and ABULREESH (2010) isolated and identifi ed Candida guilliermondi, Candida colleculosa, Candida kefyr, and Candida krusei in local kombucha. A broad spectrum of yeasts has been reported including species of Saccharomyces, Saccharomycodes, Schizosaccharomyces, Zygosaccharomyces, Brettanomyces/Dekkera, Candida, Torulospora, Kloeckera, Pichia, Mycotorula, and Mycoderma (JAYABALAN et al., 2014). KUMAR and JOSHI (2016) described also presence of Bacterium gluconicum, B. xylinum, Pichia fermentans, and P.
membranaefaciens in kombucha. The predominant acetic acid bacteria found were Acetobacter xylium, A. pasteurianus, A. aceti, and Gluconobacter oxydans. Gluconacetobacter sp. A4, which possesses a strong ability to produce D-saccharic acid-1,4-lactone, was the key functional bacterial species isolated from a preserved kombucha by YANG and co-workers (2010).An investigation by MARSH and co-workers (2014) indicated that the dominant bacteria in fi ve kombucha samples (two from Canada, one from Ireland, the United States, and the United Kingdom) belonged to Gluconacetobacter (over 85% in most samples) and Lactobacillus (up to 30%) species. Acetobacter was determined in very small numbers (lower than 2%). Kombucha can be safely prepared by households, without any health risk, if done correctly. The product is relatively acidic (pH 2.5), which limits the growth of many other microorganisms, including pathogens.
2.2. Antioxidant activity
Antioxidant activity of kombucha beverage tested by two different methods (ABTS and reducing power – RP) was compared with the activity of black tea without fermentation.
Results showed that the activity of fermented kombucha tea was several times higher in comparison with non-fermented black tea (Table 1). FU and co-workers (2017) tested antioxidant activity of kombucha tea prepared from black and low cost green teas by DPPH
and reducing power methods and found the highest activity in low-cost green tea with both methods. In the study of AMARASINGHE and co-workers (2018), no increase in the activity of fermented compared to non-fermented black tea was found determined by ORAC and DPPH methods. PURE and PURE (2016) reported that fermented black tea had higher antioxidant activity (15.65%) by DPPH method than non-fermented black tea (26.16%). According to ESSAWET and co-workers (2015), the main antioxidants in fermented kombucha tea beverages were not only tea polyphenols but also some tea fungus metabolites, such as vitamins and organic acids. The antioxidant ability was determined also by key extracellular enzymes that were involved in the structural modifi cation of the compounds during kombucha fermentation.
For this reason kombucha fermented tea usually expresses higher antioxidant potential compared to non-fermented tea.
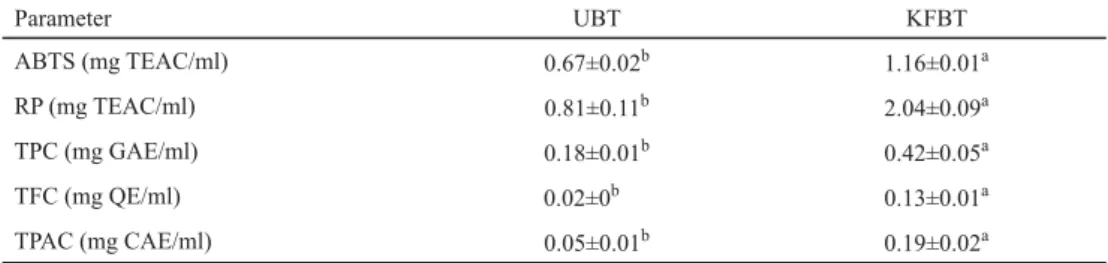
Table 1. Antioxidant activity and content of total polyphenol, fl avonoid, and phenolic acid in kombucha and black tea samples
Parameter UBT KFBT
ABTS (mg TEAC/ml) 0.67±0.02b 1.16±0.01a
RP (mg TEAC/ml) 0.81±0.11b 2.04±0.09a
TPC (mg GAE/ml) 0.18±0.01b 0.42±0.05a
TFC (mg QE/ml) 0.02±0b 0.13±0.01a
TPAC (mg CAE/ml) 0.05±0.01b 0.19±0.02a
UBT: non-fermented black tea; KFBT: kombucha fermented black tea; ABTS: radical cation decolorization assay;
RP: reducing power; TPC: total polyphenol content; TFC: total fl avonoid content; TPAC: total phenolic acid content;
mean ± standard deviation; different letters in column denote mean values that statistically differ from one another
2.3. Total polyphenol (TPC), fl avonoid (TFC), phenolic acid contents (TPAC) and HPLC analysis
Total polyphenol content in kombucha tea was higher in comparison to non-fermented black tea (Table 1). Similar tendencies were observed in contents of total fl avonoid and phenolic acid (Table 1). Complex phenolic compounds might be subjected to degradation in the acidic environment of kombucha and by the enzymes produced by bacteria and yeasts. Degradation of epicatechin isomers during kombucha fermentation was reported by LOBO and co-workers (2017). DUENAS and co-workers (2007) demonstrated that the bioactive polyphenolic compounds of lentils were modifi ed by exogenous application of enzymes like phytase, α-galactosidase, and tannase; their application increased antioxidant activity of enzyme- treated raw materials. Bacterial and yeast enzymes produced during kombucha fermentation initiate a degradation of complex polyphenols to small molecules, which could increase the content of total phenolic compounds. AIDOO (2015) reported that kombucha tea, at concentrations of 2.5 and 5.0 mg ml–1, had signifi cantly (P<0.05) higher (r=0.898), 2.4-fold and 7.3-fold, phenolic content than non-fermented tea. Statistically signifi cant (P<0.05) regression coeffi cient was observed in our study for the amount of phenolic compounds and antioxidant activity determined by ABTS and reducing power method (r= 0.999).
Major polyphenols of investigated samples were identifi ed and quantifi ed by HPLC analysis. The observed amounts of gallic, chlorogenic, protocatechuic, p-coumaric, and
ellagic acids were signifi cantly higher (P<0.05; r=0.879) in kombucha tea compared to non- fermented black tea. Also, ESSAWET and co-workers (2015) found higher contents of gallic acid and isoferulic acid in fermented black tea after nine days of fermentation. These authors also determined the amounts of catechins in black tea and fermented tea, and found that catechins and their active metabolites act in diverse ways, subsequently increasing the versatility of catechins for potential therapeutic interventions. Additionally, four catechins – epicatechin, epicatechin gallate, epigallocatechin, and epigallocatechin gallate (as well as other complex polyphenols) – can be biotransformed by the enzymes extracted from tea fungus cells. Catechins are released from acid-sensitive cells during black tea kombucha fermentation, which could lead to an increase in polyphenols content of tea. Amounts of ferulic and syringic acids were higher in non-fermented black tea than in kombucha in our study. RAZAK and co-workers (2015) found that ferulic acid can be biologically transformed into smaller compounds, such as vanillic acid, and so this may be the reason why the amount of ferulic and syringic acids was higher in non-fermented black tea. Fungal enzymes contribute to the modifi cation of substrate compositions during fermentation. Amount of rutin, vitexin, and resveratrol was signifi cantly higher (P<0.05; r=0.987) in kombucha tea than in non-fermented black tea. In studies of ESSAWET and co-workers (2015) and VELIĆANSKI
and co-workers (2014), higher amount of rutin in kombucha was found in black tea and kombucha lemon balm tea in comparison with non-fermented tea.
For the methylxanthine group, signifi cant decrease (P<0.05; r=0.988) in caffeine content was observed in our study. The amount of caffeine in black tea was 217.81±1.35 μg ml–1 compared to 100.72±1.58 μg ml–1 in kombucha tea. Tea infusion caffeine stimulates the bacterial cellulose synthesis, causing decrease in caffeine content during fermentation. Black tea contains high amount of methylxanthines, especially caffeine, so it is the most suitable substrate for preparing kombucha beverages. Signifi cant decrease of caffeine content in kombucha tea was also observed in the study of CHAKRAVORTY and co-workers (2016).
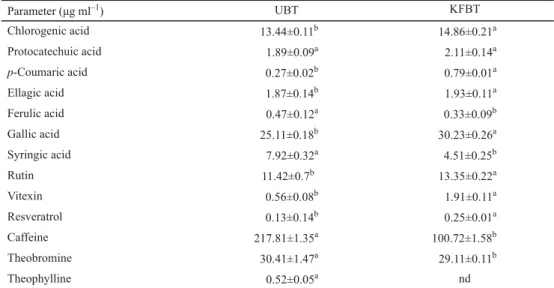
Table 2. The contents of individual polyphenolic compounds and methylxanthines in tested samples
Parameter (μg ml–1) UBT KFBT
Chlorogenic acid 13.44±0.11b 14.86±0.21a
Protocatechuic acid 1.89±0.09a 2.11±0.14a
p-Coumaric acid 0.27±0.02b 0.79±0.01a
Ellagic acid 1.87±0.14b 1.93±0.11a
Ferulic acid 0.47±0.12a 0.33±0.09b
Gallic acid 25.11±0.18b 30.23±0.26a
Syringic acid 7.92±0.32a 4.51±0.25b
Rutin 11.42±0.7b 13.35±0.22a
Vitexin 0.56±0.08b 1.91±0.11a
Resveratrol 0.13±0.14b 0.25±0.01a
Caffeine 217.81±1.35a 100.72±1.58b
Theobromine 30.41±1.47a 29.11±0.11b
Theophylline 0.52±0.05a nd
UBT: non-fermented black tea; KFBT: kombucha fermented black tea; mean ± standard deviation; nd: not detected;
different letters in column denote mean values that statistically differ from one another
3. Conclusions
Sweetened black tea infusion is a very good medium for kombucha fermentation. Kombucha beverage showed higher antioxidant activity against ABTS radical as well as reducing power compared to non-fermented black tea. Also, total amount of polyphenols, fl avonoids, and phenolic acids was higher than that of non-fermented black tea. Bioactive compounds responsible for antioxidant activity are probably gallic, chlorogenic, protocatechuic, p-coumaric, ellagic acids, rutin, vitexin, resveratrol, and kombucha metabolites. According to the results of our study, kombucha beverage can be good alternative medicine material with health benefi ts to human body.
Confl icts of interest
All authors declare no confl icts of interest.
*
This work was co-funded by the European Community project no 26220220180: Building the Research Centre
‘AgroBioTech’ (50%) and VEGA 1/0411/17 (50%).
References
AIDOO, E. (2015): Studies on the cytotoxicity and antioxidant activity of tea kombucha. MSc. Dissertation, University of Ghana. 65 pages.
AMARASINGHE, H., WEERAKKODY, N.S. & WAISUNDARA, V.Y. (2018): Evaluation of physicochemical properties and antioxidant activities of kombucha ‘tea fungus’. Food Sci. Nutr., 6, 659–665.
CHAKRAVORTY, S., BHATTACHARYA, S., CHATZINOTAS, A., CHAKRABORTY, W., BHATTACHARYA, D. & GACHHUI, R. (2016):
Kombucha tea fermentation: Microbial and biochemical dynamics. Int. J. Food Microbiol., 220, 63–72.
DUENAS, M., HERNANDEZ, T. & ESTRELLA, I. (2007): Changes in content of bioactive polyphenolic compounds of lentils by the action of exogenous enzymes. Effect on their antioxidant activity. Food Chem., 101, 90–97.
ESSAWET, N.A., CVETKOVIC, D., VELICANSKI, A., ČANADANOVIČ-BRUNET, J., VULIC, J., MAKSIMOVIC, V. & MARKOV, S.
(2015): Polyphenols and antioxidant activities of kombucha beverage enriched with CoffeeBerry® extract.
Chem. Ind. Chem. Eng. Q., 21, 399–409.
FARMAKOPEA POLSKA (1999): The Polish Pharmaceutical Society: 5th ed., PTFarm., Warszawa. pp. 880–881.
FU, C., YAN, F., CAO, Z., XIE, F. & LIN, J. (2017): Antioxidant activities of kombucha prepared from three different substrates and changes in content of prebiotics during storage. Food Sci. Tech.-Brazil, 34, 123–126.
JAYABALAN, R., MALBAŠA, R.V., LONČAR, E.S., & VITAS, J.S. & SATHISHKUMAR, M. (2014): A review on kombucha tea- microbiology, composition, fermentation, benefi cial effects, toxicity and tea fungus. Comp. Rev. Food Sci. F.
14, 538–550.
KAČÁNIOVÁ, M., TERENTJEVA, M., GODOČÍKOVÁ, L., PUCHALSKI, C., KUNOVÁ, S., KLUZ, M., KORDIAKA, R. & HAŠČÍK, P.
(2017): Identifi cation of lactic acid bacteria in milk and milk products with MALDI-TOF mass spectrometry.
Scientifi c Papers Animal Science and Biotechnologies, 50, 115–120.
KUMAR, V. & JOSHI, V.K. (2016): Kombucha: Technology, microbiology, production, composition and therapeutic value. Intl. J. Food. Ferment. Technol., 6, 13–24.
LOBO, R.O., DIAS, F.O. & SHENOY, C.K. (2017): Kombucha for healthy living: Evaluation of antioxidant potential and bioactive compounds. Int. Food Res. J. (IFRJ), 24, 541–546.
MALBAŠA, R.V., VITAŠ, J.S., LONČARIE, E., GRAHOVAC, J. & MILANOVIČ, S. (2014): Optimisation of the antioxidant activity of kombucha fermented milk products. Czech J. Food Sci., 32, 477–484.
MARSH, A.J., O’SULLIVAN, O., HILL, C., ROSS, R.P. & COTTER, P.D. (2014): Sequence-based analysis of the bacterial and fungal compositions of multiple kombucha (tea fungus) samples. Food Microbiol., 38, 171–178.
NOVÁKOVÁ, L., SPÁČIL, Z., SIFRTOVÁ, M., OPLETAL, L. & SOLICH, P. (2010): Rapid qualitative and quantitative ultra high performance liquid chromatography method for simultaneous analysis of twenty nine common phenolic compounds of various structures. Talanta, 80, 1970–1979.
PRIETO, P., PINEDA, M. & AGUILAR, M. (1999): Spectrophotometric quantitation of antioxidant activity through the formation of a phosphomolybdenum complex: specifi c application to the determination of vitamin E. Anal.
Biochem., 269, 337–341.
PURE, A.E. & PURE, M.E. (2016): Antioxidant and antibacterial activity of kombucha beverages prepared using banana peel, common nettles and black tea infusions. Applied Food Biotechnology (Iran), 3, 125–130.
RAMADANI, A.S. & ABULREESH, H.H. (2010): Isolation and identification of yeast flora in local kombucha sample: Al Nabtah. Umm Al-Qura Univ. JAS., 2, 42–51.
RAZAK, D.L.A., RASHID, N.Y., JAMALUDDIN, A., SHARIFUDIN, S.A. & LONG, K. (2015): Enhancement of phenolic acid content and antioxidant activity of rice bran fermented with Rhizopus oligosporus and Monascus purpureus.
Biocatal. Agr. Biotechnol., 4, 33–38.
RE, R.N., PELLEGRINI, A., PROTEGGENTE, A., PANNALAM-YANG, R. & RICE, C. (1999): Antioxidant activity an improved ABTS radical cation decolorization assay. Free Radical Bio. Med., 26, 1231–1237.
SAS (2009): Users Guide Version 9.2. SAS/STAT (r). SAS Institute Inc. Cary, NC, USA. 2009
SINGLETON, V.L. & ROSSI, J.A. (1965): Colorimetry of total phenolics with phosphomolybdic-phosphotungstic acid reagents. Am. J. Enol. Viticult., 6, 144–158.
VELIČANSKI, A., CVETKOVIČ, D., MARKOV, S.L., ŠAPONJAC, V.T.T. & VULIČ, J.J. (2014): Antioxidant and antibacterial activity of the beverage obtained by fermentation of sweetened lemon balm (Melissa offi cinalis L.) tea with symbiotic consortium of bacteria and yeast. Food Technol. Biotech., 52, 420–429.
WILLETT, W.C. (2002): Balancing life-style and genomics research for disease prevention. Science, 296, 695–698.
YANG, Z., ZHOU, F., JI, B., LI, B., LUO, Y., YANG, L. & LI, T. (2010): Symbiosis between microorganisms from kombucha and kefi r. Potential signifi cance to the enhancement of kombucha function. Appl. Biochem.
Biotech., 160, 446–455.