LC-ESI-MS/MS methods in profiling of flavonoid glycosides and phenolic acids in traditional medicinal plants: Sempervivum tectorum L. and
Corylus avellana L.
Ph.D. Dissertation
Ágnes Alberti-Dér
Semmelweis University
Doctoral School of Pharmaceutical Sciences
Supervisor: Dr. Ágnes Kéry, Ph.D.
Reviewers:
Chair of final examination committee: Dr. Sylvia Marton, Ph.D.
Members of final examination committee: Dr. Imre Máthé, D.Sc.
Dr. Éva Sátory, D.Sc.
Budapest
2013
T
ABLE OF CONTENTSTABLE OF CONTENTS ... 2
LIST OF ABBREVIATIONS ... 5
1. INTRODUCTION ... 7
2. LITERATURE OVERVIEW ... 9
2.1.PLANT PHENOLICS ... 9
2.1.1. Phenolic acids ... 10
2.1.2. Flavonoids ... 11
2.2.BIOLOGICAL ACTIVITIES ... 13
2.3.EXTRACTION AND ANALYSIS OF PHENOLIC ACIDS AND FLAVONOIDS ... 14
2.3.1. Sample preparation ... 14
2.3.2. Extraction ... 14
2.3.3. Purification and fractionation ... 15
2.3.4. Separation ... 16
2.3.5. HPLC detection ... 17
2.3.6. LC-MS/MS in structural characterization of phenolics ... 20
2.3.6.1. Negative ionization collision-induced dissociation of phenolic acids ... 21
2.3.6.2. Negative ionization collision-induced dissociation of flavonol aglycones and glycosides ... 22
2.4.SEMPERVIVUM TECTORUM L. ... 31
2.4.1. Taxonomic classification ... 31
2.4.2. Morphology ... 32
2.4.3. Traditional use ... 33
2.4.4. Biological activities ... 34
2.4.5. Phytochemical characterization ... 36
2.4.5.1. Carbohydrates ... 36
2.4.5.2. Organic acids, the crassulacean acid metabolism ... 36
2.4.5.3. Flavonoids ... 38
2.4.5.3.1. Flavonoids in other species of the Crassulaceae family ... 38
2.4.5.4. Procyanidins, anthocyanins and other polyphenols ... 39
2.4.5.4.1. Polyphenols in the Crassulaceae family ... 39
2.4.5.5. Alkaloids ... 40
2.4.5.5.1. Alkaloids in the Crassulaceae family ... 40
2.4.5.6. Amino acids ... 40
2.5.CORYLUS AVELLANA L. ... 41
2.5.1. Taxonomic classification ... 41
2.5.2. Morphology ... 41
2.5.3. Traditional use ... 42
2.5.4. Pharmacological effects ... 42
2.5.5. Phytochemical characterization ... 43
2.5.5.1. Flavonoids ... 43
2.5.5.2. Phenolic compounds: hydroxycinnamic acids, proanthocyanidins ... 44
2.5.5.3. Fatty acids ... 44
2.5.5.4. Other compounds... 44
3. OBJECTIVES ... 45
4. MATERIALS AND METHODS ... 47
4.1.1. Sempervivum tectorum L. ... 47
4.1.2. Corylus avellana L. ... 47
4.2.SOLVENTS AND CHEMICALS ... 47
4.3.SAMPLE PREPARATION ... 48
4.3.1. Preparation of S. tectorum extracts ... 48
4.3.2. Separation of S. tectorum 80% (v/v) methanolic extract ... 48
4.3.3. Preparation of S. tectorum decoction ... 49
4.3.4. Preparation of S. tectorum leaf juice ... 50
4.3.5. Preparation of C. avellana extracts ... 50
4.4.QUANTITATIVE PHYTOCHEMICAL ANALYSES... 51
4.5.ANTIOXIDANT ACTIVITY ASSAYS ... 51
4.5.1. ABTS and DPPH scavenging activity ... 51
4.5.2. Peroxynitrite scavenging activity ... 52
4.6.HPLC AND LC-MS/MS EXPERIMENTS –INSTRUMENTATION ... 53
4.7.HPLC AND LC-MS/MS EXPERIMENTS –QUALITATIVE ANALYSES ... 54
4.7.1. HPLC evaluation of S. tectorum extracts... 54
4.7.2. LC-MS/MS evaluation of S. tectorum 80% (v/v) methanolic extract ... 55
4.7.3. LC-MS/MS evaluation of fractions of S. tectorum 80% (v/v) methanolic extract ... 55
4.7.4. LC-MS/MS evaluation of S. tectorum leaf juice ... 56
4.7.5. LC-MS/MS evaluation of S. tectorum ethanolic extract... 57
4.7.6. LC-MS/MS evaluation of C. avellana extracts ... 58
4.8.HPLC AND LC-MS/MS EXPERIMENTS –QUANTITATIVE ANALYSES ... 58
4.8.1. Determination of hydroxycinnamic acid derivatives in S. tectorum leaf juice by an HPLC- UV method ... 58
4.8.1.1. Validation - Calibration plot, precision and quality control samples ... 59
4.8.1.2. Method recovery test ... 59
4.8.2. Determination of kaempferol glycosides in S. tectorum leaf juice by HPLC-DAD and LC-ESI-MS/MS methods ... 60
4.8.2.1. Isolation of the flavonoid compounds of interest ... 60
4.8.2.2. NMR spectroscopy ... 63
4.8.2.3. HPLC-MS/MS conditions ... 63
4.8.2.4. Validation - Calibration plot, precision and quality control samples ... 64
4.8.2.5. Method recovery test ... 65
5. RESULTS ... 66
5.1.QUANTITATIVE PHYTOCHEMICAL ANALYSES... 66
5.2.ANTIOXIDANT ACTIVITY ASSAYS ... 67
5.2.1. DPPH and ABTS scavenging activity ... 67
5.2.2. Peroxynitrite scavenging activity ... 70
5.3.QUALITATIVE HPLC AND LC-MS/MS ANALYSES ... 71
5.3.1. S. tectorum 80% (v/v) methanolic extract ... 71
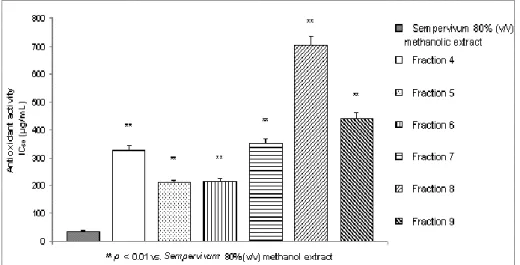
5.3.2. Fractions of S. tectorum 80% (v/v) methanolic extract ... 72
5.3.3. S. tectorum leaf juice ... 76
5.3.4. S. tectorum ethanolic extract ... 78
5.3.5. C. avellana ethyl acetate and methanolic extracts ... 81
5.4.QUANTITATIVE ANALYSES ... 83
5.4.1. Determination of hydroxycinnamic acid derivatives in S. tectorum leaf juice ... 83
5.4.1.1. Quantitative analysis and method validation ... 84
5.4.2. Determinatin of kaempferol glycosides in S. tectorum leaf juice ... 87
5.4.2.1. Isolation with column chromatography ... 87
5.4.2.2. Quantitative analysis and method validation ... 88
6. DISCUSSION... 90
6.1.ANTIOXIDANT ACTIVITY ASSAYS ... 90
6.1.1. DPPH and ABTS scavenging activity ... 90
6.1.2. Peroxynitrite scavenging activity ... 93
6.2.QUALITATIVE ANALYSES ... 94
6.2.1. S. tectorum 80% (v/v) methanolic extract ... 94
6.2.2. Fractions of S. tectorum 80% (v/v) methanolic extract ... 99
6.2.3. S. tectorum leaf juice ... 99
6.2.3.1. Characterization of phenolic acids ... 100
6.2.3.2. Characterization of flavonol glycosides ... 101
6.2.4. S. tectorum ethanolic extract ... 102
6.2.4.1. Characterization of phenolic acids ... 102
6.2.4.2. Characterization of flavonol glycosides ... 103
6.2.5. C. avellana ethyl acetate and methanolic extract... 104
6.2.5.1. Characterization of flavonol glycosides ... 104
6.2.5.2. Characterization of hydroxycinnamic acid derivatives ... 107
6.3.QUANTITATIVE ANALYSES ... 107
6.3.1. Determination of hydroxycinnamic acid derivatives in S. tectorum leaf juice ... 107
6.3.2. Determination of kaempferol glycosides in S. tectorum leaf juice ... 108
6.3.2.1. Isolation with column chromatography ... 108
6.3.2.2. Quantitative analysis and method validation ... 108
7. CONLCUSIONS ... 110
8. SUMMARY ... 112
9. ÖSSZEFOGLALÁS ... 113
REFERENCES ... 114
LIST OF PUBLICATIONS ... 132
ACKNOWLEDGEMENTS ... 134
L
IST OF ABBREVIATIONSABTS 2,2’-azino-bis(3-ethylbenzothiazoline-6-sulfonic acid)
ALP alkaline phosphatase
amu atomic mass unit
APCI atmospheric pressure chemical ionization API atmospheric pressure ionization
APPI atmospheric pressure photo ionization
BPC base peak chromatogram
CAM crassulacean acid metabolism CE capillary electrophoresis
CEC capillary electrokinetic chromatography CID collision-induced dissociation
DAD diode array detector
DART direct analysis in real time ionization DESI desorption electrospray ionization DPPH 2,2-diphenyl-1-picrylhydrazyl ESI electrospray ionization
FAB fast atom bombardment
FT-ICR Fourier-transform ion cyclotron resonance
GC gas chromatography
GGT gamma-glutamyl transpeptidase GPT glutamate-pyruvate transaminase HDL high-density lipoprotein
HPLC high-performance liquid chromatography IC50 half maximal inhibitory concentration
i.p. intraperitoneal
IT ion trap mass analyzer
LC liquid chromatography
LC-MS liquid chromatography coupled to mass spectrometry MALDI matrix-assisted laser desorption ionization
MS mass spectrometry
MS/MS tandem mass spectrometry MSn multiple stage mass spectrometry MSPD matrix solid-phase dispersion m/z mass-to-charge ratio
NI negative ionization
NMR nuclear magnetic resonance spectroscopy
NO• nitric oxide radical
O2•-
superoxide radical
•OH hydroxyl radical
ONOO- peroxynitrite anion
PEP-C phosphoenolpyruvate-carboxylase
PI positive ionization
Q quadrupole mass analyzer
QQQ triple-quadrupole mass analyzer
Q-TOF quadrupole – time-of-flight mass analyzer
RDA retro-Diels-Alder
RP-HPLC reversed-phase high-performance liquid chromatography
s.c. sub cutan
S.D. standard deviation
S.E.M. standard error of the mean SFE supercritical fluid extraction
SPE solid-phase extraction
SPME solid-phase micro-extraction SRM single reaction monitoring mode TEAC trolox equivalent antioxidant capacity TIC total ion current chromatogram TOF time-of-flight mass analyzer
TLC thin layer chromatography
UHPLC ultrahigh-pressure liquid chromatography
UV ultraviolet light
vis visible light
VLDL very-low density lipoprotein
1. I
NTRODUCTIONIn recent years a number of medicinal plants have been proved to offer an alternative to synthetic drugs in preventing and treating diseases. Quality control of standardized herb extracts is an essential part of investigations regarding safety, efficacy and therapeutical reproducibility. However, it is not an easy task, because medicinal plant extracts or preparations comprising several herbs are complex mixtures of numerous different compounds among which a substantial proportion is unknown. This applies particularly to extracts containing plant phenolics, since these are present in plant material in great structural variability. Characterization of quality includes phytochemical screening of medicinal plants with the objectives of authentication and relevation of diagnostic compounds to avoid adulteration.
In order to develop modern evidence-based phytomedicines or registered herbal extracts, standardization is a crucial step. It comprises identification and determination of the active substances in a herbal remedy, as well as development of validated methods for comprehensive chemical characterization and quantification of the main compounds. However, pharmacological effects often can not be attributed to a certain active substance, but a sort of constituents contribute to them or a synergistic effect between compounds exists.
For all these phytoanalytical challenges provides mass spectrometry (MS) coupled to high-performance liquid chromatography (HPLC) an adequat tool. Mass spectrometry offers great selectivity and sensitivity and with the separative power of high- performance liquid chromatography enables simultaneous structural analysis of compounds present in complex matrices.
Evaluation of two taditional medicinal plants, Sempervivum tectorum L. and Corylus avellana L. has been chosen as scope of our work. Mainly kaempferol glycosides have been reported for Sempervivum tectorum, however, its phytochemical characterization is incomplete. Its flavonoid profile has been studied only at the aglycone level, although glycosyl substitution can have a great impact on bioavailability of compounds.
Phenolics in kernels of Corylus avellana have been studied extensively, nevertheless data regarding leaves are less detailed.
Phenolics are present in plant material in great structural variability and have been reported by some recent studies to exhibit various pharmacological activities, such as anti-inflammatory, anti-cancer, hepatoprotective, anti-atherogenic, antimicrobial and estrogenic effects. Flavonoids and phenolic acids have drawn considerable attention because of their biological activities mentioned above. In addition, phenolics are considered as chemotaxonomic markers in plants and are regarded as chemical markers for authentication of herbal extracts and pharmaceutical preparations. Due to the great structural variety of flavonoids and phenolic acids and their presence as complex mixtures in medicinal plants, their qualitative and quantitative phytochemical characterization requires sensitive and reliable analytical methods. HPLC-MS is the method of choice for phenolic analysis, since it provides a powerful, robust, versatile and available technique.
2. L
ITERATURE OVERVIEW2.1. Plant phenolics
Phenolics form a vast group of secondary metabolites in plants and are characterized by the presence of at least one aromatic ring substituted by at least one hydroxyl group, free or engaged in another function: ether, ester, or glycoside. However, structural requirements are insufficient to characterize plant phenolics, since these would include many other substances, which belong to different phytochemical groups, e.g. alkaloids, terpenes, etc. Therefore a definition based on biosynthetic origin is necessary. Plant phenolics originate from two main aromatization pathways.
Shikimate pathway:
The most common pathway leads from D-erythrose-4-phosphate and phosphoenol-pyruvate via shikimate to aromatic amino acids, then by deamination of the latter, to cinnamic acids and their derivatives: benzoic acids, acetophenones, lignans, lignins and coumarines.
Acetate pathway:
The pathway leads from acetate to poly-β-ketoesters (polyketides) of variable length, then by cyclization (Claisen or aldol condensation) of the latter to chromones, isocoumarins, depsides, xanthones and quinones.
Due to the combination of both pathways compounds of mixed origin, e.g. flavonoids, stilbenes, pyrones and xanthones are generated. In less frequent cases a third pathway, the mevalonate pathway is involved. These mixed derivatives of shikimate and mevalonate pathways are certain quinones, furano- and pyrano-coumarins, while those of acetate and mevalonate pathways are cannabinoids [1].
Phenolic compounds can be cathegorized into several classes including simple phenols, hydroxybenzoic acid derivatives, hydroxycinnamic acid derivatives, xanthones, stilbenes, flavonoids, lignans, lignins and condensed tannins (Table 1.) [2].
Table 1. Classes of phenolics in plants [2].
Classes of phenolic compounds in plants Structure
Simple phenolics, benzoquinones C6
Hydroxybenzoic acids C6-C1
Acetophenones, phenylacetic acids C6-C2 Hydroxycinnamic acids, phenylpropanoids
(coumarins, isocoumarins, chromones, chromenes) C6-C3
Naphtoquinones C6-C4
Xanthones C6-C1-C6
Stilbenes, anthraquinones C6-C2-C6
Flavonoids, isoflavonoids C6-C3-C6
Biflavonoids (C6-C3-C6)2
Lignans, neolignans (C6-C3)2
Lignins (C6-C3)n
Condensed tannins (proanthocyanidins) (C6-C3-C6)n
2.1.1. Phenolic acids
Phenolic acids are widely distributed in the plant kingdom. The term phenolic acid applies theoretically to all organic compounds with at least one carboxyl group and one phenolic hydroxyl group, however according to the current practice, this term is reserved to benzoic and cinnamic acid derivatives only.
Hydroxycinnamic acids, also called phenylpropanoids are compounds with a C6-C3
skeleton. They are the most common metabolites of shikimic acid. Though their side chains may be in different degrees of oxidation (alcohol, aldehyde, propene or other), they all derive from cinnamic acid. They may occur in the free acid form only exceptionally, combined states are more prevalent, e.g. esters of aliphatic alcohols (mono- and dicaffeoyltartaric acids, caffeoylmalic acid), esters of quinic acid (chlorogenic acid), depsides (rosmarinic acid). However most frequently they are linked through ester, ether or acetal bonds to other metabolites, such as flavonoids,
anthocyanins, saponins, proteins, cellulose, glucose, etc. Furthermore, the phenylpropanoid moiety may cyclize (coumarins), dimerize (lignans), polymerize (lignins), or undergo side chain elongation (stilbenes, flavonoids) [1, 3-4].
Fig.1. Structures of the most common hydroxybenzoic and hydroxycinnamic acids [3].
Hydroxybenzoic acids are C6-C1-type compounds and they may arise whether from shikimic acid (like gallic acid) or universally from side chain degradation of the corresponding cinnamic acids. They are quite common in the free state, as well as combined into esters or glycosides [1, 4]. Structures of the most common hydroxybenzoic and hydroxycinnamic acids are shown in Fig. 1.
Although the role of phenolic acids in plants is not fully explained, they have been associated with nutrient uptake, protein synthesis, enzyme activity, photosynthesis and allelopathy [3].
2.1.2. Flavonoids
Flavonoids are a widely distributed group of structurally related compounds with a 2-phenylchromane skeleton with a phenyl substituent in the C2 or C3 position. They are divided into subclasses depending on the degree of oxidation of the central pyran ring, the main subclasses are shown in Fig. 2.
Fig. 2. Structure of the main flavonoid subclasses [1].
Flavonoids are often hydroxylated in positions 3, 5, 7, 3’, 4’ and 5’. Frequently, one or more of the hydroxyl groups are methylated, acetylated, prenylated or sulphated.
Although sometimes they are found as their aglycones, in plants flavonoids most commonly occur as O-glycosides and less frequent as C-glycosides. Flavones,
flavanones and isoflavones are usually glycosylated at the 7-hydroxyl group, flavonols and flavanols at the 3- and 7-hydroxyl groups, while common glycosylation sites in anthocyanidins are 3- and 5-hydroxyls. C-glycosides have their sugar groups bound to a carbon of the aglycone, usually at C-6 or C-8. The most common sugar moieties are glucose, galactose, rhamnose, xylose and arabinose, while they include allose, apiose, glucuronic acid and galacturonic acid, too. Flavonoids occur frequently as diglycosides, very common disaccharides are neohesperidose and rutinose containing glucose and rhamnose, (1 → 6) linked and (1 → 2) linked, respectively. Disaccharides containing two glucose units are also familiar: (1 → 6) linked in sophorose and (1 → 2) linked in gentiobiose. There are also flavonoid tri- or tetraglycosides, where sugar units can be linear or branched. The sugars are often further substituted by p-coumarate, malonate or acetate [1, 5-8].
Flavonoids are of biological and physiological importance, they play an important role in plants as defense and signalling compounds in reproduction, pathogenesis and symbiosis. Flavonoids are sources of flower, fruit and leaf colouring pigments, e.g.
chalcones, aurones and yellow flavonols are yellow, anthocyanins may be red, blue or purple. There are not directly visible flavonoids which can contribute to the colour as co-pigments by protecting anthocyanins, while near-UV absorbing flavonoids attract insects and in this way ensure pollen transport. Flavonoids are involved also in tissue protection against UV radiation [1, 5-6].
2.2. Biological activities
Phenolic acids and especially flavonoids have been reported by some recent studies to exhibit various effects including antioxidant [9-14], anti-cancer [15-21], anti-allergic [22-25], anti-inflammatory [26-30], antimicrobial [31-34], anti-atherogenic [35-36], anti-thrombotic and vasodilatory [36-40], estrogenic [41-43] and capillary fragility and permeability decreasing [44] actions.
2.3. Extraction and analysis of phenolic acids and flavonoids
Flavonoids and phenolic acids have drawn considerable attention because of their pharmacological activities. In addition, phenolics are considered as chemotaxonomic markers in plants and are regarded as chemical markers for authentication of herbal extracts and pharmaceutical preparations. The number of identified phenolic compounds mounts up to several thousands and is still increasing. Due to the great structural variety of flavonoids and phenolic acids and their presence as complex mixtures in medicinal plants, for their qualitative and quantitative phytochemical characterization sensitive and reliable analytical methods are required.
2.3.1. Sample preparation
Sample preparation is the initial and crucial step of both qualitative and quantitative analyses. According to the classification of de Rijke et al. [6] and Stalikas [3], there are three main types of phenolic-containing matrices: plants, food and liquid samples (including biological samples and beverages). Sample pretreatment steps may vary to a great extent, depending on the matrix of the particular sample. Several liquid samples such as urine, serum, plasma, and some beverages can be injected directly into the separation system after filtration and / or centrifugation [3, 6-7], while solid samples are usually first air-dried or freeze-dried then subjected to milling or grinding and homogenization before further extraction and purification steps [3, 6].
2.3.2. Extraction
Solvent, liquid-liquid and Soxhlet extraction are frequently used procedures for isolation or enrichment of phenolic acids and flavonoids, while supercritical fluid extraction (SFE) offers an alternative technique for extraction of lipophylic flavonoids [3, 6, 47]. Biesaga studied the effect of extraction methods (reflux heating, sonication, maceration and microwave) on the stability of maize flavonoids belonging to four subgroups (flavonols, flavones, flavanones and isoflavones) [45]. Degradation of flavonoids was influenced by the extraction mode, as well as by their chemical
structure. The highest stability was achieved by heated reflux extraction within 30 minutes and by microwave assisted extraction under 160 W for 1 minute. Degradation of flavonoids was inhibited by smaller number of substituents, furthermore a sugar moiety also stabilized flavonoids.
Commonly used extraction solvents are alcohols (methanol, ethanol), acetone, diethyl ether, ethyl acetate and acetonitrile [3, 6-7, 46-47]. For more polar compounds, e.g.
hydroxycinnamic acid derivatives, flavonoid tri- or tetraglycosides, the use of aqueous methanol or aqueous acetone is recommended [3]. Depending on the purpose of the analytical evaluation a hydrolysis step can be included in sample preparation. Chemical hydrolysis is employed to release insoluble phenolic acids and to remove the sugar moieties from flavonoid aglycones. Usually it is performed with hydrochloric acid (or formic acid) at reflux or above reflux temperatures in aqueous or alcoholic solvents [3, 6, 47]. Alternatively, enzymatic hydrolysis with pectinases, cellulases or amylases for phenolic acids and with β-glucuronidase or β-glucosidase for flavonoids can be used [3, 6-7, 47]. If soluble phenolic acids or flavonoids in their conjugated forms are the target analytes, hydrolysis should be prevented, thus harsh extraction conditions and heating should be avoided [6].
2.3.3. Purification and fractionation
There are many phenolics present in low concentrations in plant extracts, which remain unidentified but whose significance may far outweigh their concentration level.
Isolation and structure elucidation of these compounds are the initial steps to understand their significance and action [48].
Solid-phase extraction (SPE) is widely used for purification, analyte isolation and concentration from crude plant extracts or biological samples. Most frequently, the sorbent is C18-bonded silica and the sample solution and solvents are usually slightly acidified to prevent ionization of the phenolics, which could reduce their retention [3, 6]. Column chromatography has been frequently employed for fractionation of phenolics, with polyamide, Silicagel and Sephadex LH-20 as the most common stationary phases [46, 49-50].
Application of other sample preparation techniques is also discussed in the literature. By the use of solid-phase micro-extraction (SPME) considerable analyte enrichment can be achieved besides reduced organic solvent consumption. It is usually combined with gas chromatography (GC) for the extraction of (semi-) volatile organic compounds, and is therefore less suitable for extraction of highly polar and non-volatile flavonoids and phenolic acids. Matrix solid-phase dispersion (MSPD) enables simultaneous sample extraction and clean-up [3, 6].
2.3.4. Separation
Since the early 1960’s thin layer chromatography (TLC) has been widely used in the analysis of plant phenolics. Though it has losen on significance, TLC still plays a distinct role in phenolic analysis, since it provides rapid preliminary screening of many samples simultaneously prior to detailed analysis by instrumental techniques [3, 50].
Gas chromatography affords high resolution and low detection limit, though it has some disadvantages in phenolic analysis, i.e. the need for derivatization of phenolics to improve their thermal stability and increase their volatility. It has to be mentioned that analysis of highly polar, non-volatile and thermally unstable flavonoid glycosides by conventional GC is very difficult even after derivatization. Other separation technique in phenolic analysis is capillary electrophoresis (CE), while promising new fields are capillary electrokinetic chromatography (CEC) and chip technology [3, 6, 50-51].
High-performance liquid chromatography (HPLC) is by far the most relevant and important separation technique in phenolic analysis. LC is usually performed in the reversed-phase mode, on C8- or C18-bonded silica columns. Both isocratic and gradient elution systems are applied. Gradient elution is generally performed with binary solvent systems, i.e. with water containing acetate or formate buffer, and methanol or acetonitrile as organic modifier [3, 6]. Though for separation of complex mixtures of phenolics such as flavonoid conjugates – glycosides, malonates and acetates – is usually gradient elution and run times of up to 2 hours necessary, Zgórka and Kawka [52] could separate free phenolic acids using a simple isocratic mobile phase. LC is usually performed at room temperature, but in some cases the use of thermostated columns (up
to 40 °C) is recommended to reduce analysis time and improve repeatability of elution times [3, 6].
Abad-García and co-workers [8] studied retention times of different phenolics using RP-HPLC. The polar the compounds were the early they eluted, in the following order:
hydroxybenzoic acids, flavan-3-ols, hydroxycinnamic acids, coumarins, flavanones, dihydrochalcones, flavonols and flavones. However, because of the structural diversity of the compounds, overlap of the individual members of different classes is usually observed. Within the same polyphenol class: a) the retention time decreased with the increase of hydroxyl groups, b) the retention time increased when apolar substituents, e.g. methoxy groups were present, c) phenolic glycosides eluted before their corresponding aglycones, d) the retention time increased when sugar moieties were acylated, e) the retention time decreased when quinic acid and tartaric acid substituents were present. The glycosylation affected retention times differently, based on the nature and position of the glycan substitution. For glycosylated phenolics, with the sugar moiety in the same bond position, elution order was: di-O-glycoside, O-galactoside, O-glucoside, O-rutinoside, O-neohesperidoside, O-rhamnoside, aglycones. However, the position of the sugar substitution was also important for the retention times, showing the following elution order for glucosides: 8-C, 6-C, 3’,7-di-O, 7-O, 4’-O and 3-O.
2.3.5. HPLC detection
All phenolics contain conjugated double and aromatic bonds and exhibit consequently absorption in the UV or UV / vis region. Hydroxybenzoic acids have their maxima in the 200-290 (255-280) nm range which is attributed to the benzoyl group as chromophore. Hydroxycinnamic acid derivatives show an absorption band from 270 to 360 (310-325) nm due to the additional conjugation of the cinnamoyl system.
Flavonoids exhibit two major absorption bands. Band I is associated with absorption due to the cinnamoyl system of B-ring, while band II is ascribed to the absorption involving the benzoyl system in A-ring. Evaluation of UV spectra of flavonoid glycosides offers additional information for structural characterization. Characteristic absorption maxima of different flavonoid classes are as follows [6, 8, 49]:
Flavones and flavonols exhibit band I usually in the 300-380 nm region and band II from 240 to 280 nm. Depending on the B-ring oxidation pattern, band II can be observed as either one or two peaks, for 4’-oxygenated and for 3’,4’,(5’)- oxygenated flavones and flavonols, respectively.
Isoflavones, flavanones, and dihydroflavonols exhibit an intense band II absorption with a shoulder or low intensity peak representing band I, as a result of the absence of conjugation between the A- and B-rings. Isoflavones exhibit band II in the 245-270 nm region, while that of dihydroflavonols and flavanones occurs in the 270-295 nm range.
Chalcones exhibit an intense band I absorption from 340 to 390 nm, while band II appears as a minor peak in the 220-270 nm range. Aurones show the major band I absorption in the 370-430 nm region.
Anthocyanins exhibit two major absorption bands due to the aromaticity of C-ring: band II in the 275-285 nm UV region and band I in the 520-545 nm visible region.
Furthermore, information on substitution pattern of flavonoids can be gained by evaluation of their UV / vis spectra. Additional hydroxyl groups in A- or B-ring are responsible for bathochromic shifts (i.e. to longer wavelengths) of band II or I, respectively. Glycosylation or methylation of 3-, 5- or 4’-hydroxyl groups on the flavone or flavonol nucleus causes hypsochromic shifts (i.e. to shorter wavelengths), especially in band I [8, 49]. Additionally, intensity of band I (347-370 nm) in UV spectra of 3-O-glycosylated flavonols is lower than that of band II (250-267 nm) [8].
Fluorescence detection is rarely used in phenolic analysis because of the limited number of phenolic compounds exhibiting native fluorescence. This group includes, e.g.
isoflavones without 5-hydroxyl group, methoxylated flavones, 3-hydroxylated flavonoids and it can be extended by derivatization of other phenolics. Due to the presence of phenolic groups, most phenolics are electroactive, thus electrochemical detection can also be used [3, 6, 53].
Mass spectrometric (MS) detection coupled to HPLC has become the dominating technique in phenolic analysis. Different mass analyzers: quadrupole (Q), triple- quadrupole (QQQ), time-of-flight (TOF), ion trap (IT), Orbitrap and Fourier-transform ion cyclotron resonance (FT-ICR), as well as hybrid, e.g. quadrupole – time-of-flight (Q-TOF) instruments are applied. Single-stage MS is usually used in combination with UV detection to confirm identity of known components in plant extracts with the help of literature data and reference compounds. Because of its better sensitivity and the access to more detailed structural information, leading role of single-stage MS in phenolic analysis has recently been taken over by tandem mass spectrometry (MS/MS or MSn) which can be used for the identification and quantification of unknown constituents. In tandem mass spectrometry only the ion of interest is transmitted by the first analyzer which is then analyzed by the second one. MS/MS experiments can be achieved on, e.g. quadrupole – time-of-flight (Q-TOF), time-of-flight – time-of-flight (TOF-TOF) or QQQ instruments, application of an IT analyzer, however, allows also MSn analyses. Combination of multi-stage MS techniques with the improved performance of ultrahigh-pressure liquid chromatography (UHPLC) systems has led to extremely high resolution, sensitivity and throughput [6-7, 51, 54-57].
In the LC-MS of phenolics atmospheric pressure ionization (API) interfaces, such as ESI (electrospray ionization) and APCI (atmospheric pressure chemical ionization) are almost exclusively applied. They complement one other regarding polarity and molecular mass of analytes, as ESI is suitable for polar/very polar compounds with high molecular weights, while APCI is suitable for non-polar compounds with molecular weights up to several thousands Da [57-58]. Other ionization techniques employed include fast atom bombardment (FAB), atmospheric pressure photo ionization (APPI) and matrix-assisted laser desorption ionization (MALDI). Ambient ionization techniques, e.g. direct analysis in real time (DART) and desorption electrospray ionization (DESI) have been proposed for the direct evaluation of molecules present in food without using HPLC and with a minimal or no sample preparation [56].
Despite of the wide range of information provided by mass spectrometry, unambiguous structural identification can only be carried out by combining nuclear magnetic resonance spectroscopy (NMR) with LC-DAD and LC-MS/MS. On-line coupling of
HPLC and NMR is also gaining in importance in the analysis of plant-derived compounds [6-7, 51, 54-55].
2.3.6. LC-MS/MS in structural characterization of phenolics
Regarding the structural characterization of phenolics, tandem mass spectrometry with combination of collision-induced dissociation can present more detailed information beyond molecular mass of the analytes. Information can be obtained on [8, 59]:
the aglycone moiety
the types of sugar moieties (mono-, di-, tri- or tetrasaccharides and hexoses, desoxyhexoses or pentoses) and other substituents
the stereochemical assignment of terminal monosaccharide units
the sequence of the glycan part
the interglycosidic linkages
the attachment points of the substituents to the aglycone.
As mentioned above, application of ESI and APCI ionization is dominating in the analysis of phenolics. For both techniques negative ionization (NI) mode provides better sensitivity, however – despite the stronger background noise – positive ionization (PI) mode can also be employed. The method of choice for the analysis of low-molecular- mass phenolics is yet HPLC-(–)-ESI-MS/MS [6, 58, 60-61].
Mass spectrometry, particularly MS/MS provides high sensitivity and selectivity, even for complex biological matrices, e.g. phenolic-containing extracts comprising a number of target analytes of analogous structures. Mauri and Pietta analyzed different plant extracts without prepurification and chromatographic separation, by direct infusion into an ESI-MS apparatus with the aim to obtain their finger-prints [62]. Gioacchini et al.
concluded also that use of the ESI-MS system with selected ion monitoring mode (i.e. when only selected ions pass through the first analyzer and are then analyzed by the second one) did not required complete HPLC separation of the phenolic acids and aldehydes studied, unless isomers were to be identified [63]. Nevertheless, sample purification and chromatographic separation should not be neglected, since co-eluting components may cause problems with the MS response due to ion suppression and other
matrix effects. HPLC-ESI-MS/MS methods are adversely affected by matrix effects in terms of sensitivity, accuracy and precision. Consequently, almost all mass spectrometric methods in phenolic analysis include a high-performance separation method, as adequate chromatographic resolution improves LC-MS sensitivity [58, 64-65].
It should be kept in mind that in all four operation modes: (–)-ESI, (+)-ESI, (–)-APCI and (+)-APCI, composition and pH of the LC eluent and the nature of the buffer components added can have a distinct influence on analyte responses and ionization efficiency. The most common additives in LC-MS are acetic acid, formic acid, ammonium-acetate and ammonium-formate [6-7]. Trifluoroacetic acid is also used, despite its ion suppressing effects due to ion-pairing with basic analytes and its adverse effect on efficient spray formation due to its high surface tension [6-7]. Phosphate buffers are not employed, because of contamination of the ion source [6, 54]. However, sensitivity of ESI is improved when the organic content in the mobile phase exceeds 20% (v/v) [48].
2.3.6.1. Negative ionization collision-induced dissociation of phenolic acids
Gioacchini and co-workers developed a selective and sensitive negative ionization ESI- MS/MS method for the determination of phenolic acids and aldehydes [63].
Neutral losses of small molecules, such as CO2 (-44 amu), CO (-28 amu) and H2O (-18 amu), as well as those of methyl radicals (-15 amu) – generating the formation of [M-CH3]•- ions – commonly occur in negative ion collision-induced dissociation of phenolic acids and their methoxylated derivatives, respectively [66-67].
Product ions at m/z 191 and m/z 173 refer to quinic acid esters, with the former representing the deprotonated quinic acid and the latter the [quinic acid-H-H2O]- ion.
CID spectra of caffeic acid derivatives contain product ions at m/z 179 (deprotonated caffeoyl moiety), m/z 161 [caffeic acid-H-H2O]- and m/z 135 [caffeic acid-H-CO2]-, for those of coumaric acid derivatives are fragments at m/z 163 (deprotonated coumaroyl moiety) and m/z 119 [coumaric acid-H-CO2]- characteristic [66], while ferulic acid derivatives exhibit product ions at m/z 193 (deprotonated feruloyl moiety) and m/z 149 [ferulic acid-H-CO2]- [68-70].
Clifford et al. [71] unambiguously identified caffeoylquinic acid isomers by evaluation of their negativ ion CID spectra. According to their substantially different fragmentation behaviour, three compounds showing an [M-H]- ion at m/z 353 were assigned to 5-caffeoylquinic acid (chlorogenic acid), 3-caffeoylquinic acid (neochlorogenic acid) and 4-caffeoylquinic acid (cryptochlorogenic acid). Results were corroborated also by the elution order of the compounds. The fragmentation of 5-caffeoylquinic acid yielded product ions at m/z 191 and 179, with the quinic acid moiety representing the base peak and the caffeoyl moiety being present only with minor intensities, while that of 3-caffeoylquinic acid resulted in a base peak corresponding to the quinic acid moiety (m/z 191) and a comparatively intense signal from caffeic acid (m/z 179). The [quinic acid-H-H2O]- ion at m/z 173 as base peak was detected only for 4-caffeoylquinic acid with a prominent signal at m/z 179 resulting from caffeic acid. The 5-caffeoylquinic acid and 3-caffeoylquinic acid isomers were devoid of the [quinic acid-H-H2O]- ion, which has been explained by their particular stereochemistry, not allowing 1,2-acyl participation during fragmentation.
2.3.6.2. Negative ionization collision-induced dissociation of flavonol aglycones and glycosides
Although negative ionization CID spectra of flavonoids is considered to be more difficult to interpret, negative ionization mode experiments provide better sensitivity for flavonoids [6, 58, 60-61], therefore exclusively results of studies applying negative ionization techniques are discussed in this work dealing primarily with flavonol glycosides. Di Stefano and co-workers [56] concluded that the main fragmentation paths of flavonoids are independent of the ionization mode (ESI, APCI, or MALDI) and the type of analyzer applied (QQQ, IT, or QTOF), therefore, works employing these techniques are discussed. However, relative fragment abundances significantly varied when different instrumentation was used, thus instead of evaluating relative intensities of fragment ions, methods based on detecting the presence or absence of distinctive fragment ions should be preferred.
The nomenclature proposed by Domon and Costello [72] for glycoconjugates is commonly adopted to denote fragment ions deriving from collision-induced dissociation
of flavonoid glycosides (see Fig. 3.). Ions containing the aglycone are labeled k,lXj, Yj
and Zj, where j is the number of the interglycosidic bond broken, counting from the aglycone, and the superscripts k and l indicate the cleavages within the carbohydrate rings. The glycosidic bond linking the glycan part to the aglycone is numbered 0. For product ions deriving from the fragmentation of the aglycone the nomenclature proposed by Ma and co-workers [73] is usually applied. m,nA0 and m,nB0 labels are used to refer to product ions containing intact A- and B-rings, respectively, where the superscripts m and n denote the C-ring bonds that have been broken. The subscript 0 is used to avoid confusion with the Ai and Bi (i ≥ 1) labels which are used to designate carbohydrate fragments containing terminal sugar unit.
Fig.3. Nomenclature proposed by Domon and Costello [72] and Ma and co-workers [73] to denote fragment ions deriving from CID of flavonoid glycosides.
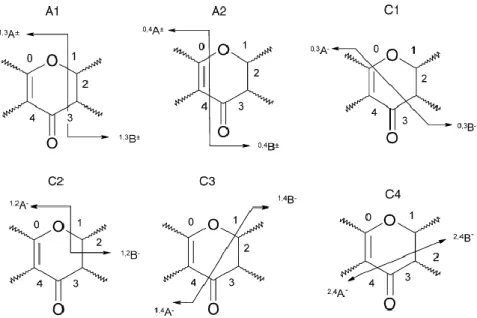
Tandem MS techniques are useful for structural elucidation in analysis of flavonoids [58]. Careri and co-workers concluded [51] that CID-MS/MS experiments cause the fragmentation of the flavonoid molecules according to fixed pathways. Thus flavonols, flavones and flavanones can be discriminated according to their CID spectra, on the basis of three types of ring cleavages in the pyran ring of the molecules. However, de Rijke and co-workers found in their more recent review work [6] that most retro-Diels-Alder (RDA) C-ring cleavages in negative ion CID experiments (shown in Fig. 4.) were observed for all classes of flavonoids, thus fragments deriving from RDA fragmentation mechanisms can be proposed as diagnostic ions for flavonoid classes only reservedly.
Fig. 4. Fragmentation pathways for flavonoids caused by cleavage of C-ring bonds; (A) in both PI and NI: (A1) 1 and 3, (A2) 0 and 4; (C) in NI: (C1) 0 and 3, (C2) 1 and 2,
(C3) 1 and 4, (C4) 2 and 4 [6].
The negative ion ESI-MS/MS behaviour of flavonol aglycones was studied in detail by Fabre and co-workers [74]. The fragments obtained from flavonol aglycone pseudomolecular anions exhibit losses of small neutral molecules, such as CO (-28 amu) and CO2 (-44 amu) that may be attributed to C-ring. Neutral loss of C2H2O (-42 amu) involving A-ring occurs only for flavonol aglycones mono- or unhydroxylated in B-ring. The successive loss of these molecules may also be prominent. Cleavage of C-ring by RDA mechanism leads to m,nA- and m,nB- ions, providing information on the number and type of substituents in A- and B-rings [59].
Hydroxylation of B-ring has an impact on the fragmentation: in the CID spectra of flavonols containing two or more hydroxyl groups in B-ring, e.g. quercetin and myricetin, ions corresponding to [1,2A-H]- and [1,2B-H]- can be seen, while to obtain fragmentation of flavonols unsubstituted in B-ring much higher collision energy is required, which leads to numerous product ions [59].
Although ESI-MS/MS is not suitable for the unambiguous structural identification of flavonoid glycosides (e.g. stereochemistry of the glycan part), it provides sufficient information regarding the aglycone structure, the attachment point of substituents and the monosaccharide units of the glycan sequence. Fragmentation pathway of
O-glycosylated flavonoids starts with the cleavage of the glycosidic bonds and elimination of the sugar moieties with charge retention on the aglycone or sugar fragments [55]. In the CID spectra of deprotonated flavonol glycosides, ions corresponding to the deprotonated aglycones, [Y0]- at m/z 285, 301 and 317 generated by the loss of sugar units, furthermore the following fragment ions for aglycones are detected: [Y0–H]•- at m/z 284, 300 and 316, [Y0–H–CO–H]- at m/z 255, 271 and 287 for kaempferol, quercetin and myricetin, respectively [75]. Other characteristic ions [76-77]
observed in the product spectra of kaempferol, quercetin and myricetin aglycones and glycosides are shown in Table 2.
Table 2. Familiar fragment ions deriving from negative ionization CID of flavonol glycosides [74-77].
Fragment ions (m/z) Aglycone structure
Kaempferol Quercetin Myricetin
[Y0]- 285 301 317
[Y0–H]•- 284 300 316
[Y0–2H]- 283 299 315
[Y0–CO]- 257 273 289
[Y0–H–CO–H]- 255 271 287
[Y0–H–CO2]- 241 257 273
[Y0–H–CO2–H]- 239 255 271
[Y0–H–2CO–H]- 227 243 n.d.
1,2A- 179 179 179
1,3A- 151 151 151
n.d. No data
The glycoside moieties attached to flavonoid aglycones and phenolics through an O-glycosidic bond can be identified in tandem mass spectrometry, according to the neutral losses of sugar units [78]. Difference of 162 amu indicates a hexose, 146 amu denotes a desoxyhexose, 132 amu represents a pentose and 176 amu refers to a glucuronic acid moiety, while identification of neutral losses of di-, tri- and tetrasaccharides can be achieved by adding the neutral losses of the adequate glycan
units, e.g. neutral loss of a familiar disaccharide, rutinose (α-L-rhamnopyranosyl- (1→6)-β-D-glucopyranose) is 308 amu (146 amu + 162 amu).
Additionally, the two types of glycosidic bonds, C- and O-glycosylation can be distinguished easily, as ESI-MS/MS fragmentation patterns of C-glycosyl flavonoids is different from those of O-glycosyl flavonoids. Neutral losses of 96, 120 and 150 amu were observed for 6-C- and 8-C-glycosyl flavonoids by Kazuno and co-workers [79].
According to the results of Hvattum and Ekeberg [80], the nature and position of the sugar substitution also affects the fragmentation of flavonol O-glycosides rendering radical aglycone product ions. The authors studied formation of the radical aglycone product ion after CID of the deprotonated flavonoid O-glycosides. Product ion spectrum of rutin representing product ions from both heterolytic and homolytic cleavages is shown in Fig. 5. The authors remarked that stable flavonoid radicals are also obtained when the compounds are acting as antioxidants by donation of a hydrogen atom to free radicals.
Fig. 5. Product ion spectrum of deprotonated rutin (quercetin 3-O-rutinoside). The homolytic cleavage of the 3-O-glycosidic bond produces [Y0-H]•- ion (m/z 300), while
the [Y0]- ion (m/z 301) derives from heterolytic cleavage [59].
Relative abundance of the stable radical aglycone [Y0-H]•- obtained by homolytic cleavage of the flavonol 3-O-glycosidic bond compared to that of the aglycone product ion [Y0]- deriving from the heterolytic cleavage increased with the increase in collision energy, as well as with the increase in the number of OH substituents in B-ring (Fig. 6.).
The opposite behaviour is observed for flavone 7-O-glycosides, where less OH substitution in B-ring favours the formation of radical aglycone. However, Davis and Brodbelt [76] drew attention to inconsistency of the correlation between B-ring hydroxylation and the formation of radical aglycone after CID of flavonol 3-O-glycosides. Kaempferol 3-O-glycosides were the most affected.
Fig. 6. Product ion spectra of [M-H]- ions of a) kaempferol 3-O-rhamnoside, b) quercetin 3-O-rhamnoside and d) myricetrin-3-O-rhamnoside [77].
Ablajan and co-workers confirmed that relative abundance of the radical aglycone anion [Y0–H]•-, deriving from a homolytic cleavage, compared to that of the aglycone anion [Y0]-, deriving from a heterolytic cleavage is in correlation with the position of glycosylation [75]. Fragmentation scheme of flavonol 3-O-glycosides showed more abundant [Y30-H]•- ions compared to [Y30]- ions, in contrast to flavonol 7-O-glycosides where abundance of [Y70-H]•- ions was lower relative to [Y70]- ions (Fig. 7.).
Fig. 7. [M-H]- product ion spectra of (a) kaempferol 3-O-glucoside and (b) kaempferol 7-O-glucoside [75].
MSn evaluation of flavonol 3-O- and 7-O-glycosides revealed that the second generation product ions of [Y0-H]•- and [Y0]- ions are different, the [Y0-H]•- ion is the precursor of [Y0–H–CO–H]- and [Y0–H–CO2–H]- ions, while the [Y0]- ion is the precursor of the [Y0–CO]- ion. Consequently, isomeric flavonol 3-O- and 7-O-glycosides can be differentiated on the basis of formation and relative abundance of [Y0-H]•- and [Y0]- ions and by comparing the diagnostic ions formed by retro-Diels–Alder reactions [75].
However, MS3 spectra of flavonol 3-O-glycosides are to match sagely with MS/MS spectra of the adequate aglycones, the aglycone part of flavonol glycoside compounds can not always be determined by simple comparison with the adequate aglycones (Fig. 8.) [76]. Familiar product ions of kaempferol, quercetin and myricetin glycosides
Fig. 8. CID spectra of quercetin and quercetin 3-O-glucoside. (a) MS/MS spectrum of deprotonated quercetin, (b) MS3 spectrum of quercetin 3-O-glucoside using the [Y0]- ion as the precursor; (c) MS3 spectrum of quercetin 3-O-glucoside using the [Y0-H]•- ion
as the precursor [76].
Lu et al. found [81] that relative abundance ratio of [Y0-H]•- and [Y0]- ions deriving from homolytic and heterolytic cleavages of the sugar moieties from kaempferol 3-O-glycosides may be influenced by the length of the saccharide substituent. Negative ion CID of kaempferol 3-O-monoglycosides induced a predominant homolytic cleavage, while kaempferol 3-O-di- and -triglycosides, similarly to flavonol 7-O-glycosides, gave abundant heterolytic cleavage fragments. The authors concluded that the differences in the fragmentation pathways may be attributed to the length of the saccharide chains, as electron-donating effect from the B-ring was reduced by the large steric hydrance caused by the long saccharide chains.
Ablajan and co-workers concluded [75] that product ion spectra of flavonol 3,7-di-O-glycosides substantially differ from those of their isomeric flavonol mono-O-diglycosides. In order to characterize a flavonoid as a flavonol 3,7-di-O-glycoside, both [Y30-H]•- ion formed by homolytic cleavage of the 3-O-glycosidic bond and [Y0-2H]- ion generated by the elimination of two glycosyl radicals at the 3-O and 7-O positions successively should be present in the [M-H]- spectrum. Product ion spectra of kaempferol, quercetin and myricetin 3,7-di-O-glycosides containing both [Y30-H]•- and [Y0-2H]- ions are shown in Fig. 9.
Fig. 9. Product ion spectra of deprotonated (a) kaempferol 3-O-glucoside- 7-O-arabinoside, (b) quercetin 3-O-arabinoside-7-O-glucoside and (c) myricetin 3,7-di-O-glucoside showing [Y0-H]•- and [Y0-2H]- ions formed by homolytic cleavages
of the glycosidic bonds [75].
Furthermore, the glycan sequence, which is either (1 → 2) or (1 → 6), also has a significant influence on the relative abundances of [Y0-H]•- and [Y0]- ions. Cuyckens and Claeys [82] found that intensity ratio of [Y0-H]•- and [Y0]- ions deriving from CID of isomeric flavone 7-O-diglycosides was distinctly different. Rhoifolin (apigenin 7-O-neohesperidoside) and isorhoifolin (apigenin 7-O-rutinoside) differ only in the interglycosidic linkage between the terminal rhamnose and the internal glucose residues, which is (1 → 2) and (1 → 6) for rhoifolin and isorhoifolin, respectively.
Ferreres and co-workers could also differentiate the (1 → 2) and (1 → 6) interglycosidic linkages and discern between isomeric di-, tri- and tetraglycosylated flavonoids by evaluation of characteristic product ions in the (–)-ESI-MS/MS spectra of flavonoid isomers [83]. The (1 → 2) linkage was characterized by high relative abundance of the Y1-
(-162 amu) ion and the Z1-
(-180 amu) ion, while for compounds with the (1 → 6) linkage Y1-
was observed at very low abundance and Z1-
was not detected.
However, because of the numerous factors affecting the formation of radical and non-radical product ions during CID of flavonoid glycosides, Cuyckens and Claeys concluded [82] that the [Y0-H]•- : [Y0]- ion ratio can be used only for suggesting the position of the glycan substitution, especially in the case of flavonol 3-O-glycosides, rather than as a diagnostic tool for the characterization of the glycosylation position in unknown flavonoid O-glycosides.
2.4. Sempervivum tectorum L.
2.4.1. Taxonomic classification
Sempervivum tectorum L., common houseleek is a wild-growing succulent belonging to the family of Crassulaceae. Sempervivum is a genus of some 30 species mostly native to Mediterranean and highland areas of Europe. S. tectorum is spread from the Pyrenees, through the Alps up to the northern regions of the Balkan Peninsula. It grows under very poor soil conditions, primarily on rocks, roofs, old walls and chimneys [84-87].
Fig. 10. Sempervivum tectorum L.
Name of the plant derives from the Latin words semper (= ever), vivum (vivere = to live) and tectum (= roof) and refers to the fact that it is an evergreen perennial plant, as well as to its use in the ancient times. Houseleek was known and cultivated already by the ancient Romans on ridges and copings of houses from clay and straw mortar as protection against wash-out. The observation that fires caused by lightnings hardly damaged houses that were grown houseleek on their roofs, led on the belief that the plant protects from thunderbolts. This persuasion was kept by some of its common names of German origin, e.g. Dimerkraut (Dimer = storm, thunder-shower; Kraut = plant/herb). The name Donnerkrut comes from the name of Donar, a Germanic god associated with thunder, lightning and storms.[84-85].
2.4.2. Morphology
S. tectorum is a robust succulent herb (Fig. 10.). Leaves are crowded in perennial basal rosettes 8-15 cm in diameter. Houseleek is a self-propagating plant, it produces offshoots around its base. Offshoots are 3-6 cm long, chunky, leafy. The succulent basal leaves are obovate-lanceolate, with the apex pointed, green, but tinged intense red on the upper surface. The plant blooms from July to September, the flowering stems are 20-40 cm tall, robust, covered with glandular hair all over. S. tectorum is a hapaxanthic plant, after fruiting, the leaves senesce and the plant dies. The flowers are regular, hermaphrodite, up to 3 cm in diameter, arranged in a panicle with more than 30 flowers.
Number of sepals, petals and carpels is 12-16, that of stamens is the double. Petals are lanceolate, reddish, fused from the base for a short distance. The fruit is a group of follicles.
S. tectorum has been planted on roofs and stone-walls since the antiquity. It often grows wild, follicles of wild-grown varieties are sterile. The stock species growing wild are to find in Hungary solely in the Villányi-mountain, on Jura-limestone rock lawns of Szársomlyó, consequently, the plant is protected [88-90].
2.4.3. Traditional use
Sempervivum species were already referred to by Theophrastus, Diuscurides and Plinius as remedy against burns and wounds. Charlemagne ordered cultivation of houseleek in his Capitulare de villis for the officials of the crown lands [84]. Sedum or Sempervivum spp. leaves were practical drugs used by medieval (10-14th century) Mediterranean communities according to prescriptions, lists of materia medica and letters of physicians from the Cairo Genizah, a collection of Jewish manuscript fragments found in the genizah (store room) of the Ben Ezra Synagogue in Old Cairo. Indications were: eye diseases, fever, bleeding and kidney pains [91-92]. A Sempervivum species, S. maius was comprised in the first official German Pharmacopoeia [93]. Internal use of leaf juice was indicated only against raging fever, intense diarrhoea and to free from worms, otherwise external use was preferred for burst of fury, eye-boils, ear-flow, pain by inflammation of the liver and the kidney, podagra and burns. Local use was recommended by erysipelas, inflammation of the eyes, burns, spreading ulcers, swellings / tumidity. In traditional folk medicine smashed leaves and leaf juice of houseleek were used against rash eruptions, open wounds, bee-stings, burns [84], itching of the skin, intermittent fever and scrofulous ulcers [85]. Leaf juice of S. tectorum was furthermore applied against corns and freckles, internally against sore throat, dys- and amenorrhoea [84], uterus neuralgia, gastric ulcer, dysentery and haemorrhage [85]. In Denmark it was used internally against bladder complaints, in Poland as mucilaginosum for ulcers, in Hungary against fever, epilepsy and warts.
Leaves allowed to infuse for a while in cold water resulted in a cooling drink which was used by fever and catarrhal diseases of the respiratory system. Covering with smashed leaves or rubbing in with the leaf juice was thought to be useful against warts, freckles, burnings, inflammations of the eyes, erysipelas, ulcers and corns [85].
Leaves mixed with fat were used as a goitre ointment, remedy for catarrh of the eyelids, against chapped, rough skin and earache. Infusion of the herb was used against fever, the leaves put into carious tooth relieved the pain. In some regions leaves and young sprouts were consumed as a salad [84]. In Bosnia and Herzegovina S. tectorum leaves were applied internally for anxiety by children, insomnia, epilepsy, ear inflammations, stomach ulcers, menstruation ailments and as a tincture for renal ailments, externally for
warts, ulcers, skin rash, corns and sunspots [94-95]. In Serbia houseleek was used for earache as a compress made from leaf juice applied to the sore area, for stomach and intestinal ulcers (eaten one leaf a day). The juice obtained from cutting the leaf longitudinally was applied to the area with Herpes zoster [96]. In Danish traditional medicine medication prepared from aerial parts of houseleek with distilled spirits was applied for epilepsy [97].
In Italy fresh leaves of S. tectorum were used to insect bites, latex was applied to warts as keratolytic, defoliated, mashed aerial parts were used to haematomas, while beaten aerial parts were placed on the brow with handkerchief for headache [98-99]. In the Italian alpine area, similarly to S. tectorum, a number of different medications prepared from S. montanum has been applied: infusion from fresh leaves as a diuretic and appetizer drink or as a rinse for sore throat, smashed leaves – besides the usual application purposes, i.e. burns, wounds, insect bites – as a compress or poultice for headache and nose-bleeding [100]. Veterinary use is also known: cattle and sheep were fed leaves of houseleek by gastrointestinal problems, especially by tympanism, when rumination is blocked by overingestion of alfalfa and other fresh plants [101].
Recently the old custom of planting houseleek on roofs can be revived in an up-to-date form by using houseleek or other Crassulaceae species as green roof plants. Green roofs have the potential to function as islands of biodiversity within urban environments.
Crassulaceae succulents are highly tolerant of the harsh roof-top environment, e.g.
summertime water deficit and heat stress, additionally, they can increase performance of neighbouring plant species [102].
2.4.4. Biological activities
Lyophilized leaf juice of S. tectorum displayed dose-dependent H2O2/•OH scavenger activity in an in vitro chemiluminescence test, moreover its scavenger activity against Fenton type •OH radicals was proved by electronspinresonance studies [103].
A further study of the research group confirmed superoxide (O2•-
) scavenger activity of lyophilized S. tectorum leaf juice. In the same study the leaf juice inhibited in vitro non- enzimatically (by ascorbic acid and FeCl3) induced lipidperoxidation [104].
![Table 2. Familiar fragment ions deriving from negative ionization CID of flavonol glycosides [74-77]](https://thumb-eu.123doks.com/thumbv2/9dokorg/1372154.112503/25.892.188.704.501.882/table-familiar-fragment-deriving-negative-ionization-flavonol-glycosides.webp)
![Fig. 5. Product ion spectrum of deprotonated rutin (quercetin 3-O-rutinoside). The homolytic cleavage of the 3-O-glycosidic bond produces [Y 0 -H] •- ion (m/z 300), while](https://thumb-eu.123doks.com/thumbv2/9dokorg/1372154.112503/26.892.226.688.594.818/product-spectrum-deprotonated-quercetin-rutinoside-homolytic-cleavage-glycosidic.webp)
![Fig. 6. Product ion spectra of [M-H] - ions of a) kaempferol 3-O-rhamnoside, b) quercetin 3-O-rhamnoside and d) myricetrin-3-O-rhamnoside [77]](https://thumb-eu.123doks.com/thumbv2/9dokorg/1372154.112503/27.892.296.606.325.973/product-spectra-kaempferol-rhamnoside-quercetin-rhamnoside-myricetrin-rhamnoside.webp)
![Fig. 8. CID spectra of quercetin and quercetin 3-O-glucoside. (a) MS/MS spectrum of deprotonated quercetin, (b) MS 3 spectrum of quercetin 3-O-glucoside using the [Y 0 ] -ion as the precursor; (c) MS 3 spectrum of quercetin 3-O-glucoside using the [Y 0](https://thumb-eu.123doks.com/thumbv2/9dokorg/1372154.112503/29.892.274.600.132.419/quercetin-quercetin-glucoside-deprotonated-quercetin-quercetin-glucoside-precursor.webp)
![Fig. 9. Product ion spectra of deprotonated (a) kaempferol 3-O-glucoside- 3-O-glucoside-7-O-arabinoside, (b) quercetin 3-O-arabinoside-7-O-glucoside and (c) myricetin 3,7-di-O-glucoside showing [Y 0 -H] •- and [Y 0 -2H] - ions formed by homolytic cleava](https://thumb-eu.123doks.com/thumbv2/9dokorg/1372154.112503/30.892.302.586.170.740/deprotonated-kaempferol-glucoside-glucoside-arabinoside-quercetin-arabinoside-glucoside.webp)