0139–3006 © 2019 Akadémiai Kiadó, Budapest DOI: 10.1556/066.2019.0006
VARIABILITY OF BIOACTIVE PROPERTIES AND ANTIOXIDANT ACTIVITY IN COMMERCIALLY GROWN CHERRY TOMATO (SOLANUM LYCOPERSICUM VAR. CERASIFORME) CULTIVARS
GROWN IN INDIA
P.K. K a*, N. P b, R. A b, M.K. M a, V.S. M c, B. B a,
K. J a and N. N c
aCentral Institute of Post-Harvest Engineering and Technology, Abohar, Punjab. India
bIndian Agricultural Research Institute, New Delhi. India
cNational Bureau of Plant Genetic Resources, New Delhi. India (Received: 23 March 2019; accepted: 19 July 2019)
In this study, six commercial cherry tomato cultivars were analysed for variations in biochemical and technological parameters. Signifi cant diff erences were observed among cultivars with respect to their technological and functional quality attributes. About 2.48-fold variation in titratable acidity, 2.47-fold variation in total phenolics, 4.13-fold variation in total carotenoid and 7.68-fold variation in lycopene contents were recorded. The total antioxidant activity and respiration rate were also found to vary about 1.85-fold and 1.48-fold, respectively. The highest antioxidant activity and total phenolic content were found in the Cherry tomato hybrid no.1 followed by Pusa cherry tomato-1. Hierarchical cluster analysis revealed that Cherry tomato hybrid no. 1, Pusa cherry tomato-1, and Nagmoti cultivars were abundantly rich in phytochemical and bioactive compounds.
Keywords: antioxidant activity, ascorbic acid, hierarchical cluster analysis, total carotenoids, total phenolics
Daily consumption of fruits and vegetables should be increased in the diet as they are important sources of biologically active compounds. Most edible fruits and vegetables supply a balanced combination of bioactive molecules like vitamins C and E, polyphenols and carotenoids, along with complex carbohydrates and dietary fi bre. Dietary consumption of bioactives has several health benefi ts as well as having anticarcinogenic, anti-mutagenic, and anti-infl ammatory molecules (B et al., 2018). Oxidation is required for the energy production in plants, but overproduction of reactive oxygen species (ROS) damages cells and hampers their normal functions. These ROS attack DNA and proteins, which ultimately cause ageing of cells (A et al., 2008). Consumption of dietary antioxidants can detoxify excess ROS and protect the organs against oxidative damage.
In recent years, popularity of cherry tomatoes (Solanum lycopersicum var. cerasiforme) has increased due to the generally higher sugar content and concentrations of many health- promoting bioactives (antioxidants, carotenoids, ascorbic acid, phenolic compounds, etc.) than conventional tomatoes (B et al., 2003; L et al., 2006; H et al., 2008).
Similarly to others, colour of the ripe berries ranges from red to yellow, green, and black due to the introgression of a wide range of spontaneous or induced colour mutations (I et al., 2019). The fruit are attached to long panicles, and their diameters vary from 1.5 to 3.5 cm.
* To whom correspondence should be addressed.
Phone: +016342224024; e-mail: pankajkannaujia@ymail.com
Quality components such as size, fi rmness, colour, taste, and nutritional value are signifi cant for marketing of tomato fruit (I et al., 2018).
The aim of the present work was to evaluate the variation of health-promoting bioactive compounds among the six cherry tomato cultivars grown inside a polyhouse. The eff ect of these compounds of selected cultivars in terms of their correlation coeffi cient was also evaluated and presented.
1. Materials and methods
1.1. Experimental material and treatments
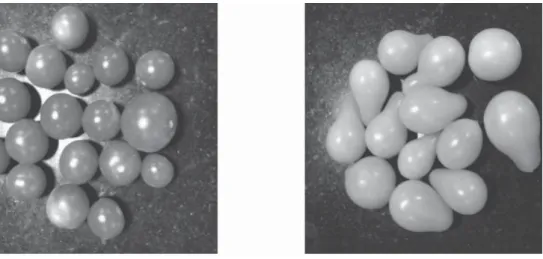
Cherry tomato cultivars, namely Cherry tomato hybrid no.1, Wild Texas, Pusa cherry tomato-1, Yellow pear, NSL cherry, and Nagmoti were grown inside a polyhouse at the Centre for Protected Cultivation Technology, Indian Agricultural Research Institute (IARI), New Delhi, India. Seedlings were germinated in multi celled plastic plug trays. A well decomposed and sterilized soil-less medium containing cocopeat, vermiculite, and perlite (3:1:1) was used as substrate. 30-day-old seedlings were transplanted in a semi climate controlled polyhouse of 30×30×6 m size. Flowering started 3 months after transplanting of seedlings. After observing the visual appearance, fruit were harvested at commercial ripened maturity (Fig. 1), pre-cooled at room temperature. Healthy and uniform fruit were selected for further experiments.
Fig. 1. Pictorial view of (a) Pusa cherry tomato-1 (b) Yellow pear at stage of maturity
1.2. Chemicals
Chemicals and reagents of analytical grade used for the study were procured from Merck India, Ltd.
1.3. Physical and physiological parameters
Dry matter (%) was determined by drying a known weight of the whole tomato reduced into identical pieces in oven at 60±5 °C to constant weight. Respiration rate was measured by placing 500 g of fresh fruit in an airtight container having twist-top lid fi tted with a silicone rubber septum at the center of the lid. After 4 h, the headspace gas was sucked through a hypodermic hollow needle and placed in an auto gas analyser (Model: Checkmate 9900 O2/ CO2, PBI Dansensor, Denmark) and the results were expressed as ml CO2 kg–1 h–1.
1.4. Biochemical and functional parameters
Total soluble solids content (%) of homogenized tomatoes were estimated using Fisher hand refractometer (0–50 °Brix) at 20 °C. Titratable acidity (%) was estimated by standard titration method with 0.1 N NaOH using phenolphthalein indicator. Ascorbic acid (mg/100 g) was estimated by AOAC (2000) method. Lycopene from homogenized tomato extracts was estimated as reported by B and co-workers (2003). Total carotenoids (mg/100 gof fruit weight) were determined by method described by S and co-workers (1999).Total phenolic content (mg GAE/100 g) was determined by method of S and R (1965).
Antioxidant capacity (μmol Trolox equiv./g) was determined by “CUPRAC” method, as standardized by A and co-workers (2008).
1.5. Statistical analysis
The experiment was conducted in a completely randomized design, taking thirty fruit of each cultivar with three replicates. Results were analyzed using analysis of variance, and the mean values were compared by Duncan’s multiple range test (DMRT). Two-way analysis of variance was performed using PROC GLM of SAS 9.3 software (SAS Institute, Cary, NC, USA), and signifi cant eff ects (P<0.05) were noted. Further, a signifi cant diff erence amongst the means was determined by Tukey’s HSD test. Principal component analysis (PCA) was carried out to fi nd the linear relationship among the diff erent variables to identify the trait that causes maximum proportion of variability in the cultivars.
2. Results and discussion
2.1. Dry matter
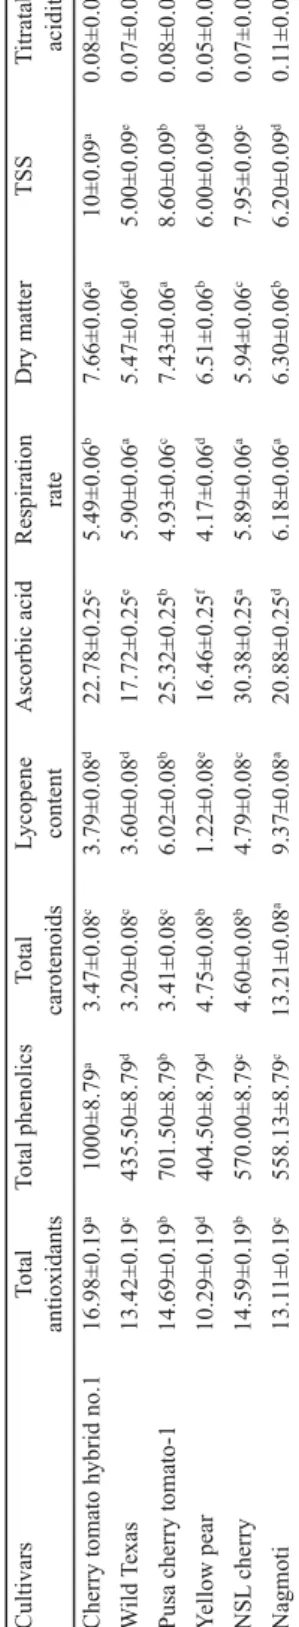
The highest dry matter content was found in Cherry tomato hybrid no.1 (7.66%) followed by Pusa cherry tomato-1 (7.43%), while the lowest (5.47%) content was found in Wild Texas (Table 1). The results substantiated that Cherry tomato hybrid no.1 is having better processing characteristics owing to its higher dry matter and soluble solids contents. M and co- workers (1995) also reported that TSS is the main component of dry matter. The other possibility of high dry matter content could be linked with higher fruit fi rmness, total sugars and soluble solids contents. The observed results were in agreement with those reported by R and co-workers (2016), where the dry matter and soluble solids contents of tomatoes ranged from 5.645 to 7.670% and 3.98 to 5.25%, respectively. A -N and co-workers (2018) reported signifi cant variation in dry matter contents of the six varieties of tomatoes cultivated in Brong Ahafo region of Ghana.
Table 1.Biochemical and technological parameters in diff erent cherry tomato cultivars Total antioxidantsTotal phenolicsTotal carotenoids Lycopene contentAscorbic acidRespiration rateDry matter TSSTitratable acidity 16.98±0.19a1000±8.79a3.47±0.08c3.79±0.08d22.78±0.25c5.49±0.06b7.66±0.06a10±0.09a0.08±0.0008b ild Texas13.42±0.19c435.50±8.79d3.20±0.08c3.60±0.08d17.72±0.25e5.90±0.06a5.47±0.06d5.00±0.09e0.07±0.0008c 14.69±0.19b701.50±8.79b3.41±0.08c6.02±0.08b25.32±0.25b4.93±0.06c7.43±0.06a8.60±0.09b0.08±0.0008b ellow pear10.29±0.19d404.50±8.79d4.75±0.08b1.22±0.08e16.46±0.25f4.17±0.06d6.51±0.06b6.00±0.09d0.05±0.0008d cherry14.59±0.19b570.00±8.79c4.60±0.08b4.79±0.08c30.38±0.25a5.89±0.06a5.94±0.06c7.95±0.09c0.07±0.0008c 13.11±0.19c558.13±8.79c13.21±0.08a9.37±0.08a20.88±0.25d6.18±0.06a6.30±0.06b6.20±0.09d0.11±0.0008a cantly deff erent at P<0.05
2.2. Respiration rate
Table 1 shows that cv. Nagmoti had higher respiration rate (6.18 ml CO2 kg–1 h–1) followed by Wild Texas (5.90 ml CO2 kg–1 h–1),while Yellow pear had the lowest value (4.17 ml CO2
kg–1 h–1). Reduction in respiration rate could be attributed to the higher fi rmness of fresh cherry fruit due to lower activity of cell wall degrading enzymes (Y & B , 2002). The lower rate of respiration and lower pH values positively correlated with each other. The higher metabolic rate of fresh tomato could be a cause for the faster rate of reduction of titratable acidity and increased pH values (T et al., 2013).
2.3. Total soluble solids
Cherry tomato hybrid no.1 showed highest TSS (10.0 °Brix) followed by Pusa cherry tomato-1 (8.60 °Brix), while the lowest value was obtained in Wild Texas (5.0 °Brix) (Table 1). This variation in TSS content was mainly due to the presence of higher dry matter content as also substantiated by M and co-workers (1995). The TSS of diff erent cherry tomato cultivars ranged from 5.83 to 9.27 °Brix (C et al., 2014) and 4.7 to 8.6 °Brix, respectively (C -C et al., 2018).
2.4. Titratable acidity
Highest titratable acidity was found in Nagmoti cultivar (0.114%) followed by Cherry tomato hybrid no.1 (0.08%), while the lowest (0.05%) value was found in Yellow pear cultivar (Table 1). G and co-workers (2004) reported the range of titratable acidity (0.256 to 0.704 %) in tomato genotypes. T and co-workers (2013) reported variation in titratable acidity from 0.748 (cv. Melkasalsa) to 0.889 (cv. Marglobe Improved) in diff erent tomato cultivars.
2.5. Ascorbic acid (AA)
NSL cherry cultivar had the highest ascorbic acid content (30.38 mg/100g) followed by Pusa cherry tomato-1 (25.32 mg/100 g), while lower value was observed in Yellow pear (16.46 mg/100g) showing about 1.85-fold variation (Table 1). G and co-workers (2008) reported the AA content in the range of 11.2 to 25 mg/100 g for the selected tomato cultivars.
Similarly, C and co-workers (2014) reported AA content of six diff erent genotypes of cherry tomatoes ranging from 8.3 to 16.7 mg/100 g.
2.6. Total antioxidant capacity
Among the diff erent cherry tomato cultivars, the highest antioxidant capacity (16.98 μmol Trolox equiv./g) was recorded in Cherry tomato hybrid no.1, followed by Pusa cherry tomato-1 (14.69 μmol Trolox equiv./g), while the lowest antioxidant activity was in NSL cherry (10.29 μmol Trolox equiv./g) (Table 1). The reason behind the higher antioxidant capacity in Cherry tomato hybrid no.1 was higher phenolic content as proved in present study. Growing season, area of cultivation and cultivars also have infl uence on bioactive compounds of cherry and pigmented tomato fruit (L et al., 2006).
2.7. Total phenolic content
In the study, total phenolic content ranged from 404.50 μg GAE/g FW (cv. Yellow pear) to 1000 μg GAE/g FW (cv. Cherry tomato hybrid no.1), depicting 2.47-fold variation (Table 1).
Variation in phenolic content was due to the diff erence in metabolic activity, which leads to consumption of phenols by the fruit tissues immediately after harvest. Loss of cell wall integrity and varietal characteristics may sometimes result in lower levels of phenols. This variation might also be due to a diff erence in the genotypic background of cherry tomato cultivars (C et al., 2014). The presence of quantitative trait loci for phenylalanine, which is the substrate for phenylalanine ammonia-lyase for polyphenol biosynthesis, in the cultivars/genotypes also aff ected phenols (S et al., 2006).
2.8. Total carotenoid and lycopene content
Results depicted that the highest total carotenoid content (13.21 mg/100 g) was found in cv.
Nagmoti, while the lowest carotenoid content (3.20 mg/100 g) was found in cv. Wild Texas.
Nagmoti cultivar showed the highest lycopene content (9.37 mg/100 g) followed by Pusa cherry tomato-1 (6.02), while the lowest value (1.22 mg/100 g) was found in cv. Yellow pear (Table 1). Genetic factor is one of the most important factors for lycopene content, but the eff ect of environmental conditions was also reported by G and co-workers (2005).
Also, C and co-workers (2014) reported lycopene (6.2–14.9 mg/100 g) and β-carotene (0.52–1.03 mg/100 g) contents of six cultivars and landraces.
2.9. Coeffi cient correlation between bioactive compounds and antioxidant activity
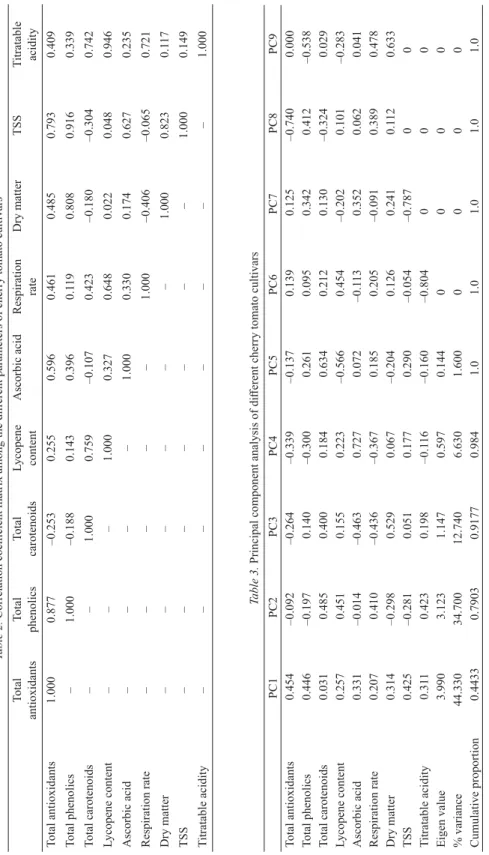
Table 2 shows signifi cant positive correlation (R2=0.877) between total antioxidant activity (CUPRAC) and total phenolic content. Similarly, total carotenoids were found positively correlated with lycopene content (R2=0.759). For lycopene content and TA, signifi cant positive correlation (R2=0.946) was observed. In addition, positive correlation among dry matter and total phenolics values (R2=0.808); and among dry matter and TSS (R2=0.823) values was observed. O and co-workers (2018) reported strong positive correlation between lycopene and β-carotene content of tomato cultivars.
2.10. Principal component analysis of cherry tomato cultivars
The observed value of PCA analysis showed that three out of nine principal components have Eigen value higher than 0.7, which contributes to 91.74% of total variation (Table 3). In Figure 2, the variables are related to one another if they are close to each other in the same geometric plane of biplot and higher distance from variables are negatively correlated. Total antioxidants, ascorbic acid and total phenolics are positively correlated to PC1 but negatively correlated to PC2. PCA has been applied by several authors in order to establish the relationship between various quality parameters as well as sensory attributes of cherry tomatoes (C et al., 2014; C -C et al., 2018).
Table 2.Correlation coeffi cient matrix among the diff erent parameters of cherry tomato cultivars Total antioxidantsTotal phenolicsTotal carotenoidsLycopene contentAscorbic acidRespiration rateDry matterTSSTitratable acidity Total antioxidants1.0000.877–0.2530.2550.5960.4610.4850.7930.409 Total phenolics–1.000–0.1880.1430.3960.1190.8080.9160.339 Total carotenoids––1.0000.759–0.1070.423–0.180–0.3040.742 Lycopene content–––1.0000.3270.6480.0220.0480.946 Ascorbic acid––––1.0000.3300.1740.6270.235 Respiration rate–––––1.000–0.406–0.0650.721 Dry matter––––––1.0000.8230.117 TSS–––––––1.0000.149 Titratable acidity––––––––1.000 Table 3. Principal component analysis of diff erent cherry tomato cultivars PC1PC2PC3PC4PC5PC6PC7PC8PC9 Total antioxidants0.454–0.092–0.264–0.339–0.1370.1390.125–0.7400.000 Total phenolics0.446–0.1970.140–0.3000.2610.0950.3420.412–0.538 Total carotenoids0.0310.4850.4000.1840.6340.2120.130–0.3240.029 Lycopene content0.2570.4510.1550.223–0.5660.454–0.2020.101–0.283 Ascorbic acid0.331–0.014–0.4630.7270.072–0.1130.3520.0620.041 Respiration rate0.2070.410–0.436–0.3670.1850.205–0.0910.3890.478 Dry matter0.314–0.2980.5290.067–0.2040.1260.2410.1120.633 TSS0.425–0.2810.0510.1770.290–0.054–0.78700 Titratable acidity0.3110.4230.198–0.116–0.160–0.804000 Eigen value3.9903.1231.1470.5970.1440000 % variance44.33034.70012.7406.6301.6000000 Cumulative proportion 0.44330.79030.91770.9841.01.01.01.01.0
Fig. 2. Graphical representation showing the variation of bioactive compounds using principal component analysis
Fig. 3. Hierarchical cluster analysis of diff erent cultivars based on evaluated quality attributes
2.11. Hierarchical cluster analysis of cherry tomato cultivars
Cluster analysis was carried out by the method of ‘Average Linkage Cluster Analysis’ from the average distances between the bioactive parameters. In the present study, the scale from 0–1.6 was used to determine the relationship between the diff erent cultivars (Fig. 3). The
sub-clusters. Cluster-1 has two closely related cultivars namely NSL cherry and Nagmoti with average root means square distance of 0.0591 between them. In cluster-2, Wild Texas and Yellow pear cultivar are closely related with an average distance of 0.118 for all bioactive components. Fourth cluster contained only one cultivar Cherry tomato hybrid no.1, which is almost homogeneous to all other fi ve cultivars with respect to bioactive compounds.
3. Conclusions
Signifi cant diff erences in terms of bioactive compounds and biochemical parameters were observed in the evaluated cultivars. Total antioxidant activity and total phenolic content were highest in Cherry tomato hybrid no.1, however, total carotenoids content was maximum in cv. Nagmoti.The total antioxidant activity had maximum linear correlation with total phenolics content. Principal component analysis validated that signifi cant diff erences in terms of antioxidant activity, total phenolics, ascorbic acid and total carotenoids contents were observed in the selected six cultivars. Findings of this study can off er an opportunity to use cherry tomato for processing purpose. The evaluated cultivars also have the potential to increase the intake of bioactive compounds through diet, with developing functional food products beside fresh consumption.
*
The fi nancial support and laboratory facilities provided by ICAR-CIPHET, Ludhiana, and ICAR-IARI, New Delhi are duly acknowledged.
References
A -N , F., H , Y.A. A , A. (2018): Biochemical properties of six varieties of tomato from Brong Ahafo region of Ghana as infl uenced by the ripening condition and drying. AJFAND, 18(1), 13095–
13109.
AOAC (2000): Offi cial methods of analysis of AOAC International, 17th ed. USA. Method No. 967.21.
A , R., G , K., O , M. C , S.E. (2008): Mechanism of antioxidant capacity assays and the CUPRAC (cupric ion reducing antioxidant capacity) assay. Mikrochim Acta., 160, 413–419.
B , S., L , A., B , E., H , J., P , Z. H , L. (2003): Eff ects of the growing methods and conditions on the lycopene content of tomato fruits. Acta Alimentaria, 32, 269–278.
B , A., D , M., M , P.P., M , D., L , M.N., … L , M.S. (2018): Shades of red:
Comparative study on supercritical CO2 extraction of lycopene-rich oleoresins from gac, tomato and watermelon fruits and eff ect of the α-cyclodextrin clathrated extracts on cultured lung adenocarcinoma cells’
viability. J. Food Compos. Anal., 65, 23–32.
C -C , E., C , M., M , A., H , D., B -G , A.M., … M -M , A.J.
(2018): Antioxidants (carotenoids and phenolics) profi le of cherry tomatoes as infl uenced by defi cit irrigation, ripening and cluster. Food Chem., 240, 870–884.
C , L., D - , A., P , Z., O , C., M , M.S., …. S , L. (2014): Coherences of instrumental and sensory characteristics: Case study on cherry tomatoes. J. Food Sci., 79(11), C2192–C2202.
G , B., K , C., K , D.S. K , H.C. (2004): Antioxidants in tomato (Lycopersium esculentum Mill.) as a function of genotype. Food Chem., 84, 45–51.
G , H., S , T.W. W , K. (2008): The eff ect of cultivar, maturity stage and storage environment on quality of tomatoes. J. Food Eng., 87(4), 467–478.
G , D., G , G., L , B., F , V., S , G.F. R , A. (2005): Changes in carotenoid and ascorbic acid contents in fruits of diff erent tomato genotypes related to the depletion of UV-B radiation.
J. Agr. Food Chem., 53, 3174-3181.
H , L., P , Z. L , A. (2008): Function of the variety technological traits and growing conditions on fruit components of tomato (Lycopersicon lycopersicum L. Karsten). Acta Alimentaria, 37, 427–436.
I , R., S , M.W., T , I., M , A., P , G., H , C. L , M.S. (2018): When color really matters: horticultural performance and functional quality of high-lycopene tomatoes. Crit. Rev. Plant Sci., 37(1), 15–53.
I , R., T , I., S , M.W., H , C. L , M.S. (2019): Inside and beyond color: Comparative overview of functional quality of tomato and watermelon fruits. Front Plant Sci., 10:769, doi: 10.3389/
fpls.2019.00769.
L , M.S., , D., T , M., P , G. D , G. (2006): Antioxidant composition in cherry and high-pigment tomato cultivars. J. Agr. Food Chem., 54, 2606–2613.
M , M., S , R. S , J. (1995): Flavor quality of fresh tomato (Lycopersicon esculentum Mill.) as aff ected by sugar and acid levels. Postharvest Biol. Technol., 6, 103–110.
O , E.B., T , C.O., T , W.V., P , C., S -L , H., … T , A.S. (2018):
Assessment of the content of β-carotene, lycopene and total phenolic of 45 varieties of tomatoes (Solanum lycopersicum L.). J. Food Nutr. Sci., 6(3), 82–89.
R , A., V , J., K , R., J , D. V , P. (2016): Determination of tomato
quality attributes using near infrared spectroscopy and reference analysis. Zemdirbyste, 103(1), 91–98.
S , N., S , Y., R , U., G , A., B , I., .... F , A.R. (2006): Comprehensive metabolic profi ling and phenotyping of interspecifi c introgression lines for tomato improvement. Nat. Biotechnol., 24, 447–454.
S , K.A., A -O , M., T , J.B. G , L.M. (1999): Value assignment of retinyl palmitate, tocopherol and carotenoid concentrations in standard reference material 2383 (Baby food composite).
J. AOAC Int., 82(2), 288–296.
S , V.L. R , J.A. (1965): Colorimetry of total phenolics with phosphomolybdic-phosphotungstic acid reagents. Am. J. Enol. Viticult., 16, 144–158.
T , M., W , T.S. W , K. (2013): Eff ects of variety on the quality of tomato stored under ambient conditions. J. Food Sci. Tech., 50(3), 477–486.
Y , O. B , L. (2002): Eff ects of an edible coating and cold storage on shelf-life and quality of cherries. LWT – Food Sci. Technol., 35, 46–150.