Antioxidant Activity and Contents of Total Phenolic Compounds and Anthocyanins According to Grain Colour
in Several Varieties of Sorghum bicolor (L.) Moench
S.C. Choi, J.M. Kim, Y.G. Lee and C. Kim*
Department of Crop Science, Chungnam National University, Daejeon 34134, Republic of Korea (Received 17 May 2018; Accepted 12 February 2019;
Communicated by H. Grausgruber)
Sorghum bicolor (L.) Moench contains various phenolic compounds such as anthocyanin.
Eleven sorghum accessions were classified into five groups by grain colour and their anti- oxidant activities were measured as well as the contents of total phenolic compounds (TPC) and anthocyanins in sorghum grains. The grain colour was related to TPC content, but not to monomeric anthocyanin content. Moreover, the overall patterns of antioxidant activity levels in 2,2-Diphenyl-1-picrylhydrazyl (DPPH) or 2,2’-Azino-bis(3-ethylbenzothiazoline-6- sulfonic acid) (ABTS) assay were similar to those of the TPC content. Correlations between TPC and anthocyanin contents were statistically significant and positive (P < 0.05). TPC content showed also a strong positive correlation to DPPH and ABTS antioxidant activities.
The results provide the basic data for breeding of sorghum varieties containing large amounts of antioxidants.
Keywords: Sorghum bicolor, grain colour, colours of pericarp, total phenolic com- pounds, anthocyanin, apigeninidin, luteolinidin, DPPH, ABTS
Introduction
Recently, many studies on useful plant-derived natural products have been conducted, as interest in health has increased (Dias et al. 2012; Atanasov et al. 2015; Stefoska-Needham et al. 2015). Flavones, terpenoids, tannins, and alkaloids are representatives of plant-de- rived natural product that are known to have antioxidant activity (Quideau et al. 2011;
Saxena et al. 2013). These antioxidants have been reported to have preventive and thera- peutic effects against various diseases such as cancer, aging, inflammation, obesity, and chronic diseases (Pandey and Rizvi 2009; Pooja and Sunita 2014; Zhang et al. 2015;
Arulselvan et al. 2016).
Sorghum bicolor (L.) Moench, one of most consumed cereal crops by humans and animals in the world, contains a variety of plant-derived metabolites. In particular, sor- ghum grains contain various phenolic compounds such as tannins, anthocyanins, and flavonols, thereby causing the seed surface or inner tissue to become coloured (Dykes et al. 2005; Dykes and Rooney 2007; Khoddami et al. 2017). There are various kinds of anthocyanins present in sorghum. 3-Deoxyanthocyanidins and their derivatives are most
*Corresponding author; E-mail: changsookim@cnu.ac.kr
abundant. Apigeninidin and luteolinidin are 3-deoxyanthocyanidins which are present in large amounts specifically in sorghum, more than in other species (Gous 1989; Awika et al. 2004a, b).
Sorghum bran contains 3–4 times more anthocyanins than sorghum whole grains (Awika et al. 2004b). However, extra processing is required to utilize the bran. In addi- tion, the pericarp or testa region, which contains a relatively large proportion of phenolic compounds, is largely lost during the dehulling or decortication process (Pinilla 2012;
Taylor and Duodu 2015). In this respect, the ingestion of antioxidants from sorghum grains is difficult but the sorghum grains are important in terms of being able to ingest antioxidants through routine meals. In view of the food as medicine, if health mainte- nance or treatment is feasible through daily meals, the development of an antioxidant-rich sorghum variety can contribute to increase the nutritional value of sorghum food products as well as to promote health.
The aim of the present study is to evaluate sorghum genetic resources for their content of phenolic compounds and antioxidant activities, and therefore our results will provide the basic data for breeding of sorghum varieties containing large amounts of antioxidants.
Materials and Methods Plant materials
Seven accessions of the sorghum association panel (SAP; Casa et al. 2008) were obtained from the University of Georgia, Athens, USA, while the check variety BTx623 and three local varieties (Banwoldang, Chosachal, and Chuncheonjaerae) were obtained from the National Agrobiodiversity Center of Rural Development Administration in South Korea (Table 1).
Sorghum seeds were multiplied at the experimental farm of Chungnam National Uni- versity in 2016 and 2017 (36.36882°N, 127.35410°E). After harvest, the seeds were dried for more than 2 weeks in a plastic greenhouse under natural conditions and for 3 days at 30 °C in a drying oven. Afterward, all seeds were vacuum-packed and stored at 4 °C until use. In this study, seeds harvested in 2016 were used for local varieties, and seeds har- vested in 2017 were used for the other accessions.
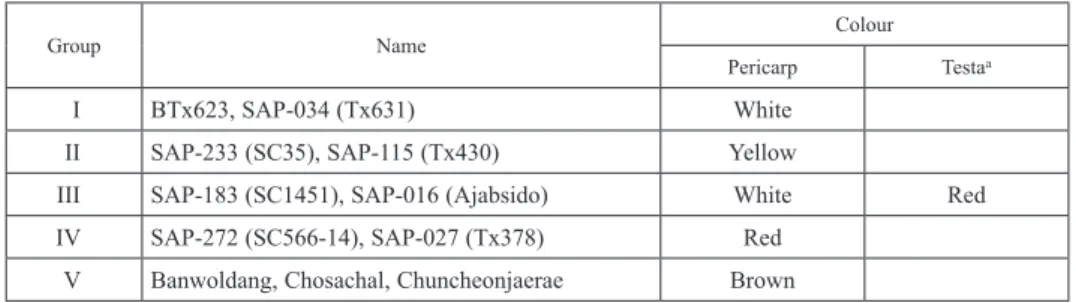
Table 1. Classification of sorghum grains as phenotyping
Group Name Colour
Pericarp Testaa
I BTx623, SAP-034 (Tx631) White
II SAP-233 (SC35), SAP-115 (Tx430) Yellow
III SAP-183 (SC1451), SAP-016 (Ajabsido) White Red
IV SAP-272 (SC566-14), SAP-027 (Tx378) Red
V Banwoldang, Chosachal, Chuncheonjaerae Brown
aTesta colour of Group III is only different from pericarp colour. All others show the same pericarp colours as testa colours.
Phenotyping
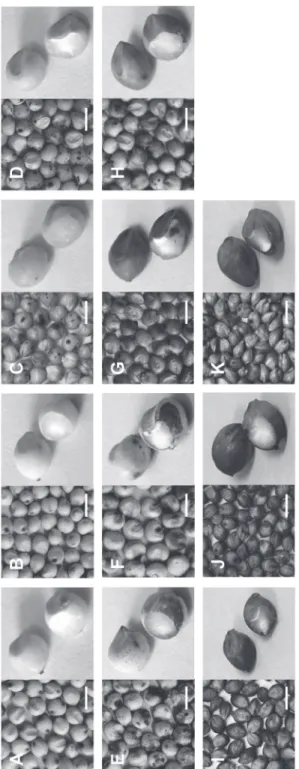
The sorghum grains were categorized according to the colours of pericarp and testa (Table 1). The grain of each sorghum accession was cut using a razor blade to observe testa colour (Fig. 1).
Extraction of phenolic compounds
The seeds were ground into a fine powder using mortar and pestle. A portion (0.5 g) of each sample was transferred into a 50 ml plastic tube and then 20 ml of acidified methanol [1% concentrated HCl in methanol (v:v)] was added. The sample was well vortexed and incubated for 2 h at 20 °C in the dark on a shaker (oscillating at 100 rpm). To increase extraction efficiency, the sample was incubated further at –20 °C for 24 h in the dark.
After incubation, the sample was centrifuged at 4000 rpm for 20 min at 20 °C. The super- natant was stored at –20 °C until use.
Quantification of total phenolic compounds and anthocyanins
The Folin-Ciocalteu’s method (Ainsworth and Gillespie 2007) was used to determine TPC in the sorghum seeds. Fifty μl of sample extract, 50 μl of 2 M Folin-Ciocalteu re- agent (Sigma), and 750 μl of distilled deionized water were mixed. The solution was well vortexed and incubated at room temperature for 10 min in the dark. Afterward, 150 μl of 20% Na2CO3 (w/v) was added to the solution and well vortexed. The sample was incu- bated at room temperature for 2 h in the dark. The absorbance of the sample was taken at 760 nm. Gallic acid (Sigma) was used as a standard. Gallic acid was dissolved in metha- nol and the stock solution was serially diluted with methanol to produce a standard curve.
Results were represented in mg gallic acid equivalent (GAE)/g fresh weight.
The pH differential method was used for quantification of total monomeric anthocya- nins as previously described (Wrolstad 1976; Lee et al. 2005) with minor modifications.
Since the contents of all the monomeric anthocyanin components could not be separately measured, total monomeric anthocyanin content was measured by using amounts of lu- teolinidin and apigeninidin as equivalents, which are known to exist as abundantly in sorghum seeds (Gous 1989; Awika et al. 2004a). Twenty-five mM KCl (pH 1.0) and 0.4 M Sodium acetate (pH 4.5) buffers were prepared. The pH was measured using a pH meter (Thermo scientific) and adjusted by adding 1 N HCl. One hundred μl of sample was diluted with 900 μl of pH 1.0 buffer and pH 4.5 buffer, and the sample solutions were incubated at room temperature for 15 min in the dark. Afterwards, the sample solutions were centrifuged at 13,000 rpm for 5 min at 4 °C. The absorbance of each sample in pH 1.0 buffer and pH 4.5 buffer were determined at 465 or 485 nm and at 700 nm, respec- tively. Total monomeric anthocyanin content was expressed as apigeninidin equivalent (AE) or luteolinidin equivalent (LE) as follows:
Figure 1. Grain colour of sorghum accessions. A, BTx623. B, SAP-034. C, SAP-233. D, SAP-115. E, SAP-183. F, SAP-016. G, SAP-272. H, SAP-027. I, Banwoldang. J, Chosachal. K, Chuncheonjaerae. Left panel shows whole grains while right panel shows cross-section of sorghum grain. SAP, sorghum association panel. Scale bar = 5 mm
Total monomeric anthocyanin content
(AE or LE, mg/g) = (A × MW × DF × 103)/ε × L
where A = (A465 nm – A700 nm) pH 1.0 – (A465 nm – A700 nm) pH 4.5; MW (Molecu- lar weight) = 255.24 g/mol for apigeninidin and 271.24 g/mol for luteolinidin; DF = dilu- tion factor; L = pathlength in cm; ε = 30,400 molar extinction coefficient for apigeninidin and 31,700 for luteolinidin in L × mol–1 × cm-1 (Awika et al. 2004b).
Measurement of antioxidant activity
The DPPH (2,2-Diphenyl-1-picrylhydrazyl) and ABTS [2,2’-Azino-bis(3-ethylbenzothi- azoline-6-sulfonic acid)] assays were performed to measure activities of antioxidants in the sorghum seeds. Trolox (Sigma) was used as equivalent to total antioxidants. Trolox was dissolved in methanol and 3 mM Trolox stock solution was serially diluted with methanol to make a linear standard curve in the range between 15 and 480 μM. Results are presented in μM Trolox equivalent (TE)/g fresh weight.
The procedure of the DPPH assay was performed following the method previously described (Awika et al. 2003; Thaipong et al. 2006) with some modifications. The 10 ml of 500 μM DPPH stock solution were diluted with the proper amount of methanol to ob- tain an initial absorbance of 1.5 ± 0.02 units at 517 nm using a UV-vis spectrophotometer (Scinco). The DPPH working solution was freshly prepared daily for each analysis. Be- fore measuring activity, 11.5 μl of 1 N NaOH was added to 100 μl of the sample extracts to neutralize acidification of the extracts and offset the negative effect of acidified MeOH.
Fifty μl of the neutralized sample extracts and standards were incubated with 950 μl of the DPPH working solution at room temperature for 8 h in the dark. The absorbance of the samples was measured at 517 nm.
The ABTS assay was conducted by the method as previously described (Awika et al.
2004b; Thaipong et al. 2006) with some modifications. Equal volumes of 7.4 mM ABTS (Sigma) and 2.6 mM potassium persulfate (K2S2O8) (Sigma) stock solutions were mixed.
The solution was incubated at room temperature for 16 h in the dark to generate the ABTS radical solution. One ml of ABTS radical solution was diluted with the proper amount of methanol to obtain an initial absorbance of 1.0 ± 0.02 units at 734 nm. The ABTS working solution was freshly prepared daily for each analysis. Fifty μl of sample extracts and standards were reacted with 950 μl of the ABTS working solution at room temperature for 30 min in the dark. The absorbance of the samples was measured at 734 nm.
Statistical analysis
IBM SPSS Statistics software (version 24) was used as a statistical analysis tool. Correla- tions among the contents of TPC and anthocyanin and the levels of antioxidant activities were calculated by Pearson’s correlation. Levene’s test with one-way ANOVA was used to determine the homogeneity of the variances and post-hoc tests were performed using scheffe test for the accessions in each experiment.
Results
Relationship between grain colour and phenolic compounds
The tested sorghum accessions were classified into five groups according to their colours of pericarp and testa. Interestingly, SAP-016 and -183 were classified into Group III be- cause their pericarp colours showed white, but the testa colours appeared as red (Fig. 1;
Table 1).
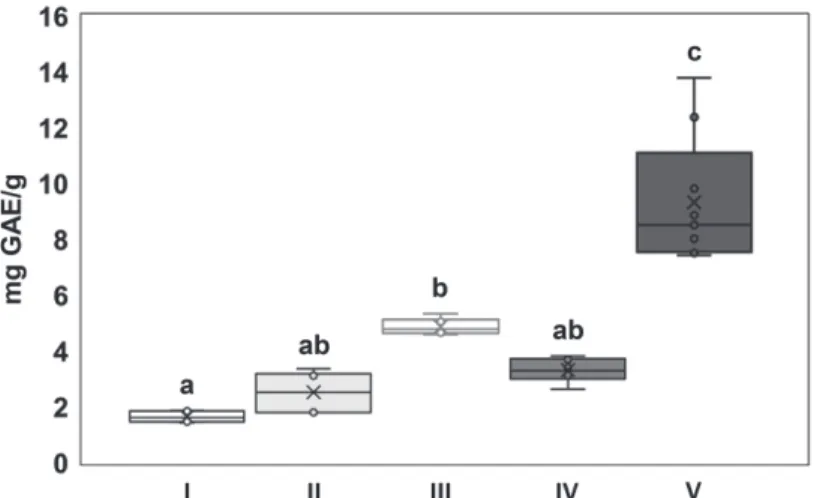
Next, TPC contents were measured for the tested accessions, and the result was pre- sented in Table 2. The local variety Chuncheonjaerae showed the highest TPC content (11.99 ± 2.01 mg GAE/g), followed by Chosachal (8.29 ± 0.70 mg GAE/g) and Ban- woldang (7.68 ± 0.31 mg GAE/g). In contrast, BTx623 (1.56 ± 0.10 mg GAE/g), SAP- 034 (1.72 ± 0.22 mg GAE/g), SAP-115 (1.84 ± 0.07 mg GAE/g) showed the lowest TPC content (Table 1). Compared with the colour classifications shown in Table 1, a high amount of TPC content appeared in the brown (Group V) or red (Group IV) coloured grains. However, Group III (SAP-183 and -016) contained more TPC than Group I (BTx623 and SAP-034), suggesting that the red testa contain a relatively large amount of TPC. To better understand the relation between TPC content and grain colour, the correla- tion was represented using boxplots (Fig. 2). In Figure 2, the content of TPC varies ac- cording to the seed colour of each group. Peculiarly, the TPC content of Group III was higher than that of Group II and IV. Therefore, these results suggest that grain colour may be related to the TPC content.
To verify anthocyanin contents for the tested accessions, contents of luteolinidin and apigeninidin were measured. As a result, the contents of luteolinidin and apigeninidin in
Table 2. Chemical composition of sorghum accessions
Name TPC
(mg GAE/g) Anthocyanins
(mg LE/g)* DPPH
(µmol TE/g) ABTS
(µmol TE/g)
BTx623 1.56 ± 0.10a 0.05 ± 0.03 2.51 ± 0.28a 03.72 ± 0.40a
Banwoldang 7.68 ± 0.31cd 0.06 ± 0.01 37.30 ± 2.42d 20.78 ± 1.40d
Chosachal 8.29 ± 0.70d 0.17 ± 0.06 39.85 ± 2.21d 21.51 ± 1.65d
Chuncheonjaerae 11.99 ± 2.01e 0.22 ± 0.09 40.18 ± 0.97d 28.98 ± 2.06e
SAP-016 5.09 ± 0.23bc 0.22 ± 0.10 25.33 ± 0.88c 13.38 ± 0.41c
SAP-027 3.21 ± 0.60ab 0.15 ± 0.07 11.42 ± 3.13b 08.03 ± 1.65ab
SAP-034 1.72 ± 0.22a 0.09 ± 0.03 6.08 ± 1.65ab 03.47 ± 0.43a
SAP-115 1.84 ± 0.07a 0.08 ± 0.02 2.62 ± 0.58a 03.67 ± 0.46a
SAP-183 4.64 ± 0.04b 0.09 ± 0.05 21.60 ± 0.81c 13.15 ± 0.22c
SAP-233 3.20 ± 0.14ab 0.13 ± 0.01 09.16 ± 1.61b 07.14 ± 0.24ab
SAP-272 3.40 ± 0.28ab 0.22 ± 0.02 07.30 ± 0.11ab 04.67 ± 0.14ab
*No significant difference.
Means with different letters are significantly different at P < 0.05 according to Scheffe’s test.
each accession were almost similar (Table 2), thereby only the value of LE is explained hereafter. Overall, the contents of anthocyanin and TPC seemed to be similar, but some accessions showed little differences. Banwoldang showed a very low content of antho- cyanin compared to its high TPC content. SAP-183 also showed relatively low anthocya- nin content compared to TPC content. In SAP-272, the TPC content was low but the an- thocyanin content was the highest on average (Table 2). Unfortunately, there was no sig- nificant difference among the accessions in the homogeneity of variance test. Therefore, these results suggest that, unlike TPC, anthocyanin may not have a direct correlation with classification by grain colour.
Antioxidant activity of sorghum grains
Since TPC and anthocyanin are known to be representative antioxidants, the antioxidant activity was examined in sorghum grains of each accession. For this, DPPH and ABTS antioxidant activity assays were performed. Comparing the results of the two different experiments, the overall pattern was similar, but the level of antioxidant activity in DPPH assay is higher than that in ABTS assay (Table 2).
In the DPPH assay, the activities of three local varieties, Chuncheonjaerae (40.18 ± 0.97 TE μmol/g), Chosachal (39.85 ± 2.21 TE μmol/g), and Banwoldang (37.30 ± 2.42 TE μmol/g), were the highest. In contrast, SAP-115 (2.62 ± 0.58 TE μmol/g) and BTx623 (2.51 ± 0.28 TE μmol/g) showed the lowest antioxidant activities (Table 2).
The results of the ABTS assay were similar to the DPPH results, but showed some dif- ferences. Chuncheonjaerae showed the highest activity (28.98 ± 2.06 TE μmol/g), fol-
Figure 2. Correlation between TPC content and grain colour. Box plot showing mean values for TPC contents in each group. The × represents the mean, while the band is the median in the box, and the box edges indicate the 25th and 75th percentiles. The whiskers represent the largest and smallest values that within 1.5 times the interquartile ranges, and the small circles indicate each value. Lower-case letters indicate homogeneous subsets
(P = 0.05). Y-axis, amount of TPC (mg GAE/g). X-axis, number of group
lowed by Chosachal (21.51 ± 1.65 TE μmol/g) and Banwoldang (20.78 ± 1.40 TE μmol/g), whereas SAP-034 (3.47 ± 0.43 TE μmol/g) and -115 (3.67 ± 0.45 TE μmol/g) showed the lowest antioxidant activity at similar levels (Table 2).
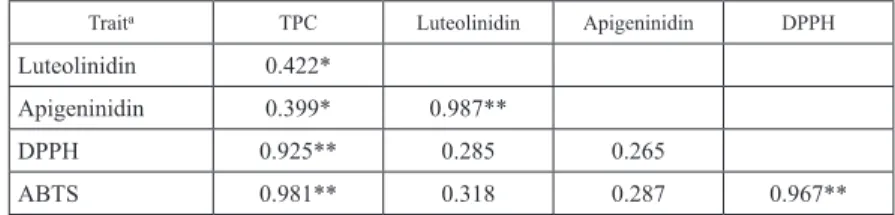
Correlations between the content of phenolic compounds and antioxidant activities The contents of TPC and anthocyanin and antioxidant activities showed generally similar patterns. To obtain a more accurate correlation, Pearson’s correlation coefficients were calculated based on their relevance (Table 3). As a result, there was statistical significance between the contents of luteolinidin and apigeninidin (P < 0.01). The TPC and anthocya- nin contents were statistically significant for positive correlation (P < 0.05). However, the anthocyanin contents and the antioxidant activities showed no significant correlation. In contrast, the TPC content showed strong positive correlation to DPPH and ABTS activi- ties (Table 3).
Discussion Effects of grain colour and phenolic compound contents
The phenolic compound contents and the antioxidant activity were measured in grains of various sorghum accessions. Previous studies reported that the major anthocyanins in black sorghum are luteolinidin and apigeninidin, and that the amount of those anthocya- nins in black sorghum is greater than that in red or brown sorghum (Awika et al. 2004b).
Moreover, monomeric anthocyanins occupy 30–50% of the total anthocyanins in sor- ghum (Awika et al. 2004a). In this regard, the correlations between the grain colours and the TPC contents were shown in sorghum grains (Fig. 2). However, the colour of the pericarp and testa seemed to be related to the TPC contents but not to the monomeric anthocyanin content based on our results. In spite of the bright colour of the seeds, the grain extracts from Group III were highly active for antioxidation (Fig. 1; Tables 1, 2).
Presumably, other phenolic compounds, not anthocyanins, may affect to their antioxidant
Table 3. Pearson’s correlation coefficients of total phenolic compounds, anthocyanins, and antioxidant activities
Traita TPC Luteolinidin Apigeninidin DPPH
Luteolinidin 0.422*
Apigeninidin 0.399* 0.987**
DPPH 0.925** 0.285 0.265
ABTS 0.981** 0.318 0.287 0.967**
aTPC – Total phenolic compounds; DPPH – 2,2-Diphenyl-1-picrylhydrazyl; ABTS – 2,2’-Azino-bis(3- ethylbenzothiazoline-6-sulfonic acid).
*Significant at P < 0.05.
**Significant at P < 0.01.
activities. On the other hand, despite the darkness of the grain colour, Banwoldang con- tained only small amounts of anthocyanins but showed a relatively high antioxidant activ- ity compared to BTx623 and SAP lines (Fig. 1; Tables 1, 2). It is probably that phenolic compounds other than anthocyanins, such as condensed tannins, may function as antioxi- dants with a high activity in sorghum grains. Brown sorghum contains many condensed tannins, which possess high antioxidant activity (Awika et al. 2004b; Dykes et al. 2005).
To identify more specific correlations, a more extensive study of the relationship between various pigments and antioxidant activity will be needed.
Monomeric anthocyanin contents in sorghum accessions
Overall, the sorghum accessions tested contained a significantly small amount of mono- meric anthocyanin (Table 2), a result differing from those of previous studies (Awika et al. 2004a, b; Njongmeta 2009). It is possible that sorghum accessions with low anthocya- nin contents were selected by chance as experimental materials or that the external envi- ronment negatively affected to anthocyanin accumulation in sorghum grains (Dube et al.
1992; Sène et al. 2001). Another possibility is that the contents of polymeric anthocyanin or anthocyanin complexed with other molecules in TPC could be much higher than those of monomeric anthocyanin.
However, above all, the amount of monomeric anthocyanin could be difficult to meas- ure by pH differential method due to the aforementioned reasons or to experimental limi- tation. The result of luteolinidin or apigeninidin quantification by the pH differential method is not accurate because the absorbance of monomeric anthocyanin is high in the range of pH 4–5. A previous study suggested that, unlike fruits or vegetables, it is not ap- propriate to measure the content of monomeric anthocyanin with equivalent of luteolini- din or apigeninidin in sorghum seeds or bran (Awika et al. 2004). Despite this weakness, the pH differential method is still a useful method for measuring the content of mono- meric anthocyanin, because of its simplicity and convenience. It is expected to be effec- tive in measuring the anthocyanin content for extensive screening in various plant mod- els.
High TPC content and antioxidant activity of local varieties
Local varieties of sorghum with high TPC content and antioxidant activity may have been selected for during domestication. However, local varieties tested in this study may be due to other reasons. The seeds of local varieties harvested in 2016 were used in the ex- periments and their size were relatively small compared to the BTx623 and SAP lines (Fig. 1). Since the accumulation of anthocyanin is normally concentrated in the pericarp when the seed is small, the content of anthocyanin accumulated relative to the seed weight is increased. Therefore, the high TPC content and antioxidant activity in the local varie- ties may result from small-sized seeds.
Prospect in breeding of sorghum with high antioxidant content
Sorghum has been bred for the purpose of animal feed and human food after a domestica- tion process and also for biofuel in recent years (Edgerton 2009; Flint-Garcia 2013; Kim- ber et al. 2013). Recently, the pharmacological efficacy of various plant-derived materials contained in sorghum has attracted attention for the purpose of preventing disease and maintaining health (Ratnavathi and Patil 2013; Stefoska-Needham et al. 2015). Various varieties of S. bicolor have been developed through the Sorghum Conversion Program (SCP) in the United States (Stephens et al. 1967) or the Department of Primary Industries and Fisheries (DPI&F) breeding program in Australia (Henzell and Jordan 2009). For example, the DPI&F program has developed the varieties with midge resistance or drought tolerance. However, this program focused on the maintenance or increase of the sorghum yield, and may have somewhat differed from the utilization of sorghum seed.
To utilize the beneficial substances contained in the sorghum seeds, the development of improved varieties is needed and could be achieved by using breeding materials such as black sorghum to have a higher antioxidant content.
Acknowledgements
This work was supported by National Agricultural Genome Program in Rural Develop- ment Administration of Republic of Korea [grant ID no. PJ01347305 to CK].
References
Ainsworth, E.A., Gillespie, K.M. 2007. Estimation of total phenolic content and other oxidation substrates in plant tissues using Folin-Ciocalteu reagent. Nat. Protoc. 2:875–877.
Arulselvan, P., Fard, M.T., Tan, W.S., Gothai, S., Fakurazi, S., Norhaizan, M.E., Kumar, S.S. 2016. Role of antioxidants and natural products in inflammation. Oxid. Med. Cell. Longev. 2016:5276130.
Atanasov, A.G., Waltenberger, B., Pferschy-Wenzig, E.M., Linder, T., Wawrosch, C., Uhrin, P., Temml, V., Wang, L., Schwaiger, S., Heiss, E.H. 2015. Discovery and resupply of pharmacologically active plant- derived natural products: a review. Biotechnol. Adv. 33:1582–1614.
Awika, J.M., Rooney, L.W., Waniska, R.D. 2004a. Anthocyanins from black sorghum and their antioxidant properties. Food Chem. 90:293–301.
Awika, J.M., Rooney, L.W., Waniska, R.D. 2004b. Properties of 3-deoxyanthocyanins from sorghum. J. Agric.
Food Chem. 52:4388–4394.
Awika, J.M., Rooney, L.W., Wu, X., Prior, R.L., Cisneros-Zevallos, L. 2003. Screening methods to measure antioxidant activity of sorghum (Sorghum bicolor) and sorghum products. J. Agric. Food Chem. 51:6657–
6662.
Casa, A.M., Pressoir, G., Brown, P.J., Mitchell, S.E., Rooney, W.L., Tuinstra, M.R., Franks, C.D., Kresovich, S. 2008. Community resources and strategies for association mapping in sorghum. Crop Sci. 48:30–40.
Dias, D.A., Urban, S., Roessner, U. 2012. A historical overview of natural products in drug discovery.
Metabolites 2:303–336.
Dube, A., Bharti, S., Laloraya, M.M. 1992. Inhibition of anthocyanin synthesis by cobaltous ions in the first internode of Sorghum bicolor L. Moench. J. Exp. Bot. 43:1379–1382.
Dykes, L., Rooney, L.W., Waniska, R.D., Rooney, W.L. 2005. Phenolic compounds and antioxidant activity of sorghum grains of varying genotypes. J. Agric. Food Chem. 53:6813–6818.
Dykes, L., Rooney, L.W. 2007. Phenolic compounds in cereal grains and their health benefits. Cereal Food.
World 52:105–111.
Edgerton, M.D. 2009. Increasing crop productivity to meet global needs for feed, food, and fuel. Plant Physiol.
149:7–13.
Flint-Garcia, S.A. 2013. Genetics and consequences of crop domestication. J. Agric. Food Chem. 61:8267–
8276.
Gous, F. 1989. Tannins and phenols in black sorghum [dissertation]. College Station (TX): Texas A&M University. https://elibrary.ru/item.asp?id=5875855.
Henzell, R.G., Jordan, D.R. 2009. Grain sorghum. In: Carena, M.J. (ed.). Cereals (Vol. 3). Springer, New York (NY), pp. 183–197.
Khoddami, A., Mohammadrezaei, M., Roberts, T.H. 2017. Effects of sorghum malting on colour, major classes of phenolics and individual anthocyanins. Molecules 22:1713.
Kimber, C.T., Dahlberg, J.A., Kresovich, S. 2013. The gene pool of Sorghum bicolor and its improvement. In:
Paterson, A.H. (ed.). Genomics of the Saccharinae. Springer, New York (NY), pp. 23–41.
Lee, J., Durst, R.W., Wrolstad, R.E. 2005. Determination of total monomeric anthocyanin pigment content of fruit juices, beverages, natural colorants, and wines by the pH differential method: collaborative study.
J. AOAC Int. 88:1269–1278.
Njongmeta, N.L.A. 2009. Extractability profiling and antioxidant activity of flavonoids in sorghum grain and non-grain materials [dissertation]. College Station (TX): Texas A&M University. Available electronically from http://hdl.handle.net/1969.1/ETD-TAMU-2009-05-560.
Pandey, K.B., Rizvi, S.I. 2009. Plant polyphenols as dietary antioxidants in human health and disease. Oxid.
Med. Cell. Longev. 2:270–278.
Pinilla, L.E. 2012. Utilization of sorghum in El Salvador: grain, flour and end-product quality [Master’s thesis].
College Station (TX): Texas A&M University. Available electronically from http://hdl.handle.net/1969.1/
ETD-TAMU-2010-12-8906.
Pooja, V., Sunita, M. 2014. Antioxidants and disease prevention. IJASTR. 2:903–911.
Quideau, S., Deffieux, D., Douat‐Casassus, C., Pouysegu, L. 2011. Plant polyphenols: chemical properties, biological activities, and synthesis. Angew. Chem. Int. Ed. Engl. 50:586–621.
Ratnavathi, C.V., Patil, J.V. 2013. Sorghum utilization as food. J. Nutr. Food Sci. 4:1–8.
Saxena, M., Saxena, J., Nema, R., Singh, D., Gupta, A. 2013. Phytochemistry of medicinal plants.
J. Pharmacogn. Phytochem. 1:168–182.
Sène, M., Doré, T., Gallet, C. 2001. Relationships between biomass and phenolic production in grain sorghum grown under different conditions. Agron. J. 93:49–54.
Stefoska-Needham, A., Beck, E.J., Johnson, S.K., Tapsell, L.C. 2015. Sorghum: an underutilized cereal whole grain with the potential to assist in the prevention of chronic disease. Food Rev. Int. 31:401–437.
Stephens, J.C., Miller, F.R., Rosenow, D.T. 1967. Conversion of alien sorghums to early combine genotypes.
Crop Sci. 7:396.
Taylor, J., Duodu, K.G. 2015. Effects of processing sorghum and millets on their phenolic phytochemicals and the implications of this to the health‐enhancing properties of sorghum and millet food and beverage prod- ucts. J. Sci. Food Agric. 95:225–237.
Thaipong, K., Boonprakob, U., Crosby, K., Cisneros-Zevallos, L., Byrne, D.H. 2006. Comparison of ABTS, DPPH, FRAP, and ORAC assays for estimating antioxidant activity from guava fruit extracts. J. Food Compos. Anal. 19:669–675.
Wrolstad, R.E. 1976. Color and pigment analyses in fruit products. Corvallis (Or): Agricultural Experiment Station. Oregon State University.
Zhang, Y.J., Gan, R.Y., Li, S., Zhou, Y., Li, A.N., Xu, D.P., Li, H.B. 2015. Antioxidant phytochemicals for the prevention and treatment of chronic diseases. Molecules 20:21138–21156.