0139–3006 © 2018 The Author(s) DOI: 10.1556/066.2018.47.3.8
APPLICATION OF CENTRAL COMPOSITE DESIGN IN THE FERMENTATION OF APPLE POMACE TO OPTIMIZE ITS
NUTRITIONAL AND FUNCTIONAL PROPERTIES
R. RODRÍGUEZ MADRERA*, R. PANDO BEDRIÑANA and B. SUÁREZ VALLES
Área de Tecnología de los Alimentos, Servicio Regional de Investigación y Desarrollo Agroalimentario (SERIDA), E-33300 Villaviciosa (Asturias). Spain
(Received: 13 October 2017; accepted: 18 January 2018)
Simultaneous optimization of protein, soluble and insoluble dietary fi bre, total phenolic content, and antioxidant activity was carried out in apple pomace by using response surface methodology (RSM) and solid state fermentation.
A central composite design (CCD) was used to optimize the content of nutritional and functional properties, and two factors were studied: time and temperature of fermentation. The fermentation of apple pomace under the best conditions (29.5 ºC and 4.9 days) allowed the depletion of fermentable sugars, an increase the contents of protein and insoluble dietary fi bre (36% and 23%, respectively), while soluble dietary fi bre, total phenolic content, and antioxidant activity remained constant.
Keywords: apple pomace, RSM, nutritional value, antioxidant activity, phenolic content, dietary fi bre
Apple is one of the world’s leading fruit products, with an estimated production of 77.2 million tons in 2016/17 (USDA FOREIGN AGRICULTURAL SERVICE, 2017). A remarkable amount of this production, about 15%, is destined to obtain juice, either for direct consumption or for the production of cider. During this transformation, the solid residue, known as apple pomace, made up of skin, pulp and seeds, is obtained. This results in a voluminous residue accounting for about 25% of the initial apple weight, and if precautions are not taken, apple pomace ferments spontaneously, leading to environmental problems with a high oxygen demand (SHALINI & GUPTA, 2010).
Therefore, several studies have been carried out to fi nd ways for the commercial exploitation of apple pomace that would allow its profi table management. Thus, apple pomace has been tested as a source of polyphenols with antioxidant properties, and analysed for antiviral activities (DIÑEIRO GARCÍA et al., 2009; SUÁREZ et al., 2010), for the synthesis of enzymes (HANG & WOODAMS, 1995; BEROVIC & OSTROVERSNIK, 1997), lactic acid (GULLÓN et al., 2008), and ethanol (JOSHI & DEVRAJAN, 2008), for generating natural fl avours (RODRÍGUEZ
MADRERA et al., 2015) or usability in growing mushrooms (PARK et al., 2014). However, its industrial use is limited to the production of pectin (GULLÓN et al., 2007).
* To whom correspondence should be addressed.
Phone: +34-985890066; fax: 34-985891854; e-mail: rrodriguez@serida.org
This is an open-access article distributed under the terms of the Creative Commons Attribution-NonCommercial 4.0 International License (https://creativecommons.org/licenses/by-nc/4.0/), which permits unrestricted use, distribu- tion, and reproduction in any medium for non-commercial purposes, provided the original author and source are credited, a link to the CC License is provided, and changes – if any – are indicated.
Traditionally, the main destination of apple pomace has been livestock feed; however, apple pomace shows low digestibility, high content of free sugars that can raise blood alcohol content, and low amounts of proteins and minerals (VILLAS-BOAS et al., 2003), discouraging this purpose. In this sense, our group satisfactorily increased the nutritional content of apple pomace through the use of yeasts with the capacity to perform alcoholic fermentation, obtaining remarkable ethanol contents, nevertheless, decrease of soluble dietary fi bre and total phenolic compounds were also detected (RODRÍGUEZ MADRERA et al., 2017).
As it is well known, among the different parameters that contribute to alcoholic fermentation, temperature is of special importance, since it is a factor clearly dependent on the strain used (TORIJA et al., 2003). On the other hand, it is important from an economic point of view, that the fermentation process should take place in the shortest possible time to reduce production costs. It is for these reasons that in this study the working temperature and the fermentation time were selected as study factors. In addition, the infl uence of both factors on 6 relevant parameters of the apple pomace, from nutritional and functional points of view, was evaluated: sugars, protein, soluble dietary fi bre (SDF), insoluble dietary fi bre (IDF), total phenolic compounds (TPC), and antioxidant activity (AA).
In this paper, the use of response surface methodology (RSM) and central composite design (CCD) to maximize the nutritional and functional content of apple pomace by solid state fermentation with autochthonous yeast strain is described.
1. Materials and methods
1.1. Apple pomace
The apple pomace used in this study was obtained from a mixture of cider apples characterized as mildly bitter from the Martínez Sopeña Hermanos S.L. cellar (Villaviciosa, Asturias, Spain). The apple pomace came from a 15 000 kg capacity industrial hydraulic press after 36 h of pressing, producing a juice yield of 76%. The apple pomace (55.6 kg) was dried in an oven with air circulation at 60 °C for 48 h. The moisture content of the pomace was 75.2%, which yielded 13.8 kg of dry apple pomace, prepared in 250 g batches for subsequent fermentation. The batches were kept protected from light and moisture in sealed bags until used. Unfermented apple pomace composition was as follows: sugars: 57.0 g kg–1; crude protein: 3.4% dry matter; soluble dietary fi bre (SDF): 19.1% dry matter; insoluble dietary fi bre (IDF): 46.3% dry matter; total phenolic content (TPC): 12.5 mg tannic acid/g dry matter;
antioxidant activity (AA): 6.0 mg ascorbic acid/g dry matter.
1.2. Growth of strain and inoculum population
An autochthonous yeast strain, Saccharomyces cerevisiae, ref.: 32 (S. cerevisiae 32), belonging to the SERIDA collection of pure cultures, was used in this study.
Pure culture of S. cerevisiae 32 stored at –80 ºC was used as inoculum. First, the strain was grown in GPY broth (4% glucose, 0.5% peptone, 0.5% yeast extract) and shaken for 16 h at 30 ºC. Five hundred μl of this culture was streaked onto GPY agar plates and incubated for 48 h at 30 ºC. After this time, surface growth from four plates was transferred to 350 ml GPY broth and incubated with stirring for 24 h. Finally, the culture was washed twice with sterile water and adjusted to an OD660 of 0.5 (~109 CFU ml–1). Each fermentation tank was inoculated with 5 ml of these cultures.
326
1.3. Fermentation
Each batch of 250 g dry pomace was hydrated in 700 ml of deionised and sterile water, adding the inoculum to this water. Fermentation took place in 1 litre capacity polypropylene food grade containers equipped with an air lock.
At the end of each assay, an aliquot was taken for microbiological analysis and determination of sugars. The rest was dried (60 °C, 48 h), milled (particle size 0.5 mm), and kept at 20 °C, protected from light until the time of chemical analysis.
1.4. Experimental design
A CCD was applied to maximize the values of protein, soluble dietary fi bre (SDF), insoluble dietary fi bre (IDF), total phenolic content (TPC), and antioxidant activity (AA), and minimize the content of sugars. Two factors in the design were studied (time and temperature of fermentation) at fi ve levels: –α, –1, 0, +1, and +α, with α= 2. The CCD consisted of 13 factorial points: 4 factorial points, 4 axial points, and 5 replicates of the central point to allow second order functions.
Design Expert 7.0.0 Software (Stat-Ease, Inc., Minneapolis, USA) was used to analyse the chemical data.
1.5. Microbiological analysis
1.5.1. Microbiological counting. Samples (10 g) were taken from each container at the end of fermentation. These samples were then homogenized with 90 ml Ringer serum for 1 min in a Masticator 0410 (IUL Instrument). Several 1:10 (v/v) dilutions were performed in Ringer’s solution and plated for yeast counts in Wallerstein Laboratory Nutrient medium supplemented with 25 mg l–1 penicillin G potassium salt and 100 mg l–1 streptomycin sulphate to inhibit bacterial growth. Plates were incubated for colony development at 30 ºC for two days.
1.5.2. Implantation capacity. The implantation of the strain was evaluated at the end of fermentation by analysis of 10 isolated colonies. The isolates were analysed by mtDNA- RFLP (QUEROL et al., 1992).
1.6. Chemical analysis
The following chemical analyses were carried out. Sugar content (sum of sucrose, glucose, and fructose) was determined by HPLC analysis (BLANCO et al., 1988) after extraction in water as performed by PINA and HOGG (1999). Crude protein and dry matter were determined by AOAC offi cial methods (2005). SDF and IDF were estimated following the enzymatic- gravimetric method described by GOÑI and co-workers (2009). TPC (Folin’s method) and AA (DPPH method) were determined in acetone/water (70/30) extracts (DIÑEIRO GARCÍA et al., 2009).
2. Results and discussion
According to the CCD detailed above, 13 experimental units were inoculated with S.
cerevisiae 32 yeast. The experimental data obtained from CCD were examined using RSM.
Each variable was tested for possible linear and quadratic models to fi nd the model with the best fi t. To compute the predicted responses (Y) a polynomial equation:
Y=b0+b1X1+b2X2+b12 X1X2+b11X12+b22X22
for each variable was estimated, where X1=time and X2=temperature, b0 is the offset term, b1 and b2 the fi rst order coeffi cients, b11 and b22 the second order coeffi cients, and b12 the interaction coeffi cient.
In Table 1 the displayed fermentation conditions in each experimental unit and the values of sugars, protein, SDF, IDF, TPC, and AA after fermentation are shown.
Table 1. Coded and real values for the experimental factors (time and temperature) and composition of fermented pomace according to the CCD
Ex- peri- mental unit
Coded values Real values Sug- ars1
Pro-
tein2 SDF2 IDF2 TPC3 AA4 Time Temp Time
(days) Temp
(ºC)
1 Factorial point –1 –1 3.0 20.0 45.0 3.7 18.3 52.2 11.5 5.1
2 Factorial point 1 –1 7.0 20.0 16.4 4.4 21.2 58.5 11.6 5.0
3 Factorial point –1 1 3.0 30.0 17.7 4.0 21.6 58.7 12.1 5.4
4 Factorial point 1 1 7.0 30.0 0.0 4.4 19.0 64.0 10.7 4.7
5 Axial point – 2 0 2.2 25.0 31.2 4.3 20.2 56.9 11.1 5.8
6 Axial point 2 0 7.8 25.0 0.0 4.4 22.7 60.0 9.3 3.8
7 Axial point 0 – 2 5.0 18.0 33.5 3.9 19.6 53.2 11.4 4.5
8 Axial point 0 2 5.0 32.0 0.0 4.4 18.8 63.1 11.7 5.3
9 Central point 0 0 5.0 25.0 5.5 4.5 21.1 61.7 11.7 5.0
10 Central point 0 0 5.0 25.0 2.6 4.5 21.0 61.0 10.9 5.1
11 Central point 0 0 5.0 25.0 5.5 4.5 21.1 60.9 11.5 5.6
12 Central point 0 0 5.0 25.0 3.6 4.5 20.7 59.1 11.2 5.3
13 Central point 0 0 5.0 25.0 4.4 4.3 20.4 57.5 11.1 5.3
SDF: Soluble dietary fi bre; IDF: insoluble dietary fi bre; TPC: total phenolic content; AA: antioxidant activity, DM:
dry matter; Temp: temperature. 1: g kg–1, 2: % dry matter; 3: mg tannic acid g–1 dry matter; 4: mg ascorbic acid g–1 dry matter.
From these results, it was possible to construct a statistically signifi cant model for each variable; the statistics are shown in Table 2. Signifi cant fi rst-order models for IDF and AA and second order model for protein, SDF, TPC, and sugars were constructed. ANOVA indicated that the response surface models developed for chemical variables were statistically signifi cant by the probability of the F-test at the level below 0.05. Moreover, the probability value of the lack of fi t tests were higher than 0.05 in all cases, indicating that the regression models are a good prediction of the experimental results.
Satisfactory coeffi cient of determination (R2) for sugars, protein, SDF, IDF, and TPC were obtained, ranging from 0.727 to 0.987 that imply that the major percentage of variance of these variables is explained by the respective models. Nevertheless, a poor R2 was obtained for AA (0.570). The coeffi cient of variation (CV) indicates the degree of precision with which the treatments are compared. Low CV values show that the performed experiments were reliable.
328
Table 2. Statistics for models constructed from composition data of fermented apple pomace in terms of coded values
Sugars Protein SDF IDF TPC AA
Coef P Coef p Coef p Coef p Coef p Coef p
Model ** ** ** ** * *
b0 4.32 4.46 1.78 58.98 11.28 5.07
b1 –11.3 ** 0.16 * 7 x
10–6
n.s. 2 ** –0.48 * –0.45 **
b2 –11.38 ** 0.13 n.s. 7.45 n.s. 3.26 ** 0.02 n.s. 0.14 n.s.
b12 2.73 * – – 0.42 ** – –0.37 n.s. – –
b11 6.54 ** –0.09 n.s. 5.60 n.s. – –0.39 n.s. – –
b22 7.12 ** –0.19 ** 0.34 ** – 0.29 n.s. – –
Lack
of fi t n.s. n.s. n.s. n.s. n.s.
R2 0.987 0.727 0.869 0.804 0.755 0.570
Adj-R2 0.978 0.590 0.776 0.765 0.580 0.484
CV (%) 17.44 3.88 2.84 2.87 3.97 7.28
b0: offset term; b1 and b2: fi rst order coeffi cients; b11 and b22: second order coeffi cients; b12: interaction coeffi cient for the polynomial equation Y= b0 + b1X1 + b2X2 + b12 X1X2+ b11X12 + b22X22, where Y= nutritional parameter, X1=time and X2=temperature. R2: coeffi cient of determination; Adj-R2: Adjusted R2; CV: coeffi cient of variation. SDF:
soluble dietary fi bre; IDF: insoluble dietary fi bre; TPC: total phenolic content; AA: antioxidant activity. *: P<0.05;
**: P<0.01; n.s.: not signifi cant.
Regarding the behaviour of the variables under study, there were important differences in the characteristics of the computed models that are of interest from the technological point of view (Fig. 1).
Thus, it was observed that longer fermentation periods decreased TPC and AA, whereas IDF increased, protein was at a maximum in the range (–1, 1), and SDF showed an opposite comportment depending on the temperature range (Fig. 1). In a previous study (RODRÍGUEZ
MADRERA et al., 2017), a decrease of SDF and TPC were detected in fermentation with several yeast strains in longer fermentation. In this sense, establishing the minimum time required could avoid these degradations.
A higher temperature of fermentation increased the levels of IDF and the AA, while the protein content was at a maximum in the range (–1, 1), and SDF and TPC increased with the temperature when the fermentation time was at the higher zone of the interval (–1, 1) and decreased when time was in the lower zone (Fig. 1).
Regarding the concentration of sugars, both longer times and higher temperatures favoured their consumption by the yeast. In this sense, it should be noted that although some S. cerevisiae strains can grow at temperatures even higher than 40 °C (MEHDIKHANI et al., 2011), the usual range of working temperature is established around 15–30 °C. In this study, lower sugar content should be expected at temperatures in the range of 29.0–30.0 °C (coded value=0.8–1.0; Fig. 1) after 6 days (coded values higher than 0.5; Fig. 1).
From the mathematical models obtained, and taking into account that the greatest predictive capacity of each model takes place in the interval (–1, 1), those conditions that allowed, simultaneously, the maximization of the contents of the 5 target variables (protein, SDF, IDF, TPC, and antioxidant capacity) and minimization of sugar content were determined.
Based on the results obtained previously (RODRÍGUEZ MADRERA et al., 2017), as a decrease in the contents of TPC, AA, and SDF can take place during fermentation and the response surfaces estimated for these compounds, more weight was assigned to these 3 variables. Also, more weight was assigned to the variable sugar, limiting its content to 0–3 g kg–1 with a target value =0, to ensure a low sugar content.
1.00 1.00 -4
8 20 32 44
Sugars
–1 –0.5
0 0.5
1
–1.00 –0.50 0.00 0.50 1.00 3.9 4.0675 4.235 4.4025 4.57
Protein
–1.00 –0.50
0.00 0.50
1.00
–1.00 –0.50 0.00 0.50 1.00 10.2 10.7 11.2 11.7 12.2
Total phenoliccontent
–1 –0.5
0 0.5
1
–1.00 –0.50 0.00 0.50 1.00 4.4 4.725 5.05 5.375 5.7
Antioxidantactivity
B: Temperature
–1.00 –0.50
0.00 0.50
1.00
–1.00 –0.50 0.00 0.50 1.00 18.3 19.25 20.2 21.15 22.1
Soluble dietaryfibre
–1 –0.5
0 0.5
1
–1.00 –0.50 0.00 0.50 1.00
53 56 59 62 65
Insoluble dietaryfibre
1.00 -4 8 20 32 44
Sugars
A: Time B: Temperature
–1.00 –0.50
0.00 0.50
–1.00 –0.50 0.00 0.50 1.00 –
8 20 32 44
Sugars
1.00 3.9 4.0675 4.235 4.4025 4.57
Protein
A: Time B: Temperature
1.00 3.9 4.0675 4.235 4.4025 4.57
Protein
1.00 10.2 10.7 11.2 11.7 12.2
Total phenoliccontent
1.00 10.2 10.7 11.2 11.7 12.2
Total phenoliccontent
A: Time B: Temperature
1.00 4.4 4.725 5.05 5.375 5.7
B: Temperature 1.00 4.4 4.725 5.05 5.375 5.7
A: Time B: Temperature
1.00 18.3 19.25 20.2 21.15 22.1
Soluble dietaryfibre
1.00 18.3 19.25 20.2 21.15 22.1
Soluble dietaryfibre
A: Time B: Temperature
1.00 53 56 59 62 65
Insoluble dietaryfibre
1.00 53 56 59 62 65
Insoluble dietaryfibre
A: Time B: Temperature
Fig. 1. Response surfaces calculated from experimental data for variables in fermented apple pomace
330
In this study, the need to optimize several responses, whose models follow opposite tendencies, simultaneously represents a problem that makes it diffi cult to obtain a satisfactory solution. In these situations, it is useful to use desirability functions (function that measures the degree of satisfaction of the results with respect to the desired values) both individually and combined (DEL CASTILLO et al., 1996).
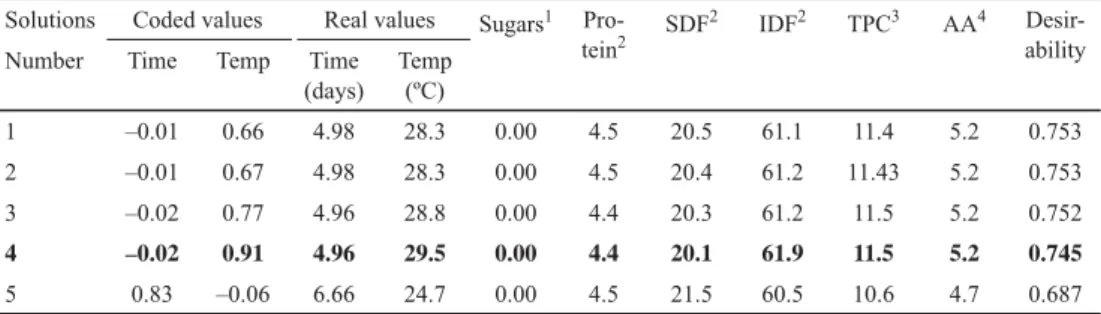
Thus, from the functions described for the variables studied and the conditions set according to the criteria presented, 5 points were obtained that satisfi ed the imposed conditions, with similar desirability combined that oscillated between 0.753 and 0.687. As can be observed in Table 3, there are no relevant differences between the predicted parameters for the fi rst 4 points obtained. Therefore, the conditions of point 4 (4.96 days, 29.5 ºC) were selected, because the temperature was in the range of the optimum working temperature of this strain (29.0–30.0 ºC) as was noted above. It should be noted that at the end of each fermentation, microbiological counts were above 108 CFU ml–1 and degrees of implantation were equal to or higher than 90% in all experimental units (data not shown), so it can be stated that all fermentations were carried out by the S. cerevisiae 32 strain.
Table 3. Solutions satisfying criteria to maximize nutritional and functional contents of apple pomace Solutions Coded values Real values Sugars1 Pro-
tein2 SDF2 IDF2 TPC3 AA4 Desir- ability
Number Time Temp Time
(days) Temp
(ºC)
1 –0.01 0.66 4.98 28.3 0.00 4.5 20.5 61.1 11.4 5.2 0.753
2 –0.01 0.67 4.98 28.3 0.00 4.5 20.4 61.2 11.43 5.2 0.753
3 –0.02 0.77 4.96 28.8 0.00 4.4 20.3 61.2 11.5 5.2 0.752
4 –0.02 0.91 4.96 29.5 0.00 4.4 20.1 61.9 11.5 5.2 0.745
5 0.83 –0.06 6.66 24.7 0.00 4.5 21.5 60.5 10.6 4.7 0.687
IDF: insoluble dietary fi bre; SDF: soluble dietary fi bre; TPC: total phenolic content; AA: antioxidant activity, Temp:
temperature. 1: g kg–1, 2: % dry matter; 3: mg tannic acid g–1 dry matter; 4: mg ascorbic acid g–1 dry matter.
Figure 2 shows individual and combined desirability for the variables in the selected conditions. The degree of combined desirability (0.745) can be considered satisfactory taking into account that there are opposing trends among the different nutritional components of the pomace during fermentation. In turn, desirability of sugars, protein, and IDF contents were greater than that of SDF, TPC, and AA.
Optimized conditions for time and temperature were replicated experimentally in triplicate to validate the model. The values of sugars, protein, SDF, IDF, TPC, and AA obtained are shown in Table 4. Results were found within the predicted intervals for all variables, so that the obtained fermentation conditions can be considered optimal to increase the nutritional and functional contents of the apple pomace. Under these conditions, a statistically signifi cant increase (P<0.001) in protein (35%) and IDF (30%) were detected, and there were no signifi cant differences (P>0.05) in the levels of SDF, AA, and TPC when compare to unfermented apple pomace (Table 4).
1 1 0.999998 0.900152 0.799418 0.702268 0.413837
0.816699 0.745295
0.000 0.250 0.500 0.750 1.000
Time Temperature Sugars Protein TPC Antioxidant activity
SDF IDF Combined
1 1 0.999998 0.900152 0.799418 0.702268 0.413837
0.816699 0.745295
0.000 0.250 0.500 0.750 1.000
Time Temperature Sugars Protein TPC Antioxidant activity
SDF IDF Combined
Fig. 2. Individual and combined desirabilities for variables under selected conditions
Table 4. Results of validation of the predicted values in the selected conditions (time: 4.96 days; temperature: 29.5 ºC) and composition values in the unfermented apple pomace
Prediction values
Validation values
Unfermented apple pomace
Variable Value SD min max Result SD (n=3) Result
Sugars1 0.0 2.5 0.0 5.8 0.0 0.0 57.0
Protein2 4.4 0.2 4.0 4.8 4.6 0.2 3.4
SDF2 20.2 0.6 18.7 21.7 21.0 1.1 19.1
IDF2 61.7 1.8 57.6 65.8 60.3 2.0 46.3
TPC3 11.5 0.5 10.4 12.7 11.8 0.4 12.5
AA4 5.2 0.4 4.3 6.1 6.1 0.2 6.0
IDF: insoluble dietary fi bre; SDF: soluble dietary fi bre; TPC: total phenolic content; AA: antioxidant activity; SD:
standard deviation; 1: g kg–1; 2: % dry matter; 3: mg tannic acid/g dry matter; 4: mg ascorbic acid/g dry matter.
3. Conclusions
Optimum solid state fermentation conditions for increasing the nutritional and functional properties of apple pomace were successfully achieved by using response surface methodology (RSM) and solid state fermentation with an autochthonous yeast strain (Saccharomyces cerevisiae ref.: 32). The models built using RSM showed that the optimal time and temperature for the fermentation of apple pomace with S. cerevisiae 32 is 4.96 days and 29.5 °C. In this way it is possible to have a raw material without sugar, enriched in protein, and with a high content in fi bre that maintains its total phenolic content and antioxidant activity, which could broaden the scope of application of apple pomace in the food sector.
332
*
Financial support for this work was managed by the National Institute of Research and Agro-Food Technology (INIA) and co-fi nanced with ERDF and ESF funds (project RTA2013-00110-00-00). The authors wish to thank Martínez Sopeña Hermanos S.L. for their collaboration in this study.
References
AOAC (2005): Offi cial Methods of Analysis of AOAC Intl, 18th ed. Association of Offi cial Analytical Chemist, Gaithersburg, MD USA. Methods 920.152 and 925.09.
BEROVIC, M. & OSTROVERSNIK, H. (1997): Production of Aspergillus niger pectolytic enzymes by solid state bioprocessing of apple pomace. J. Biotechnol., 53, 47–53.
BLANCO, D., GUTIÉRREZ, M.D., MANGAS, J.J. & NOVAL, A. (1988): Determination of sugars and alcohols in apple juice and cider by HPLC. Chromatographia, 25, 701–706.
DEL CASTILLO, E., MONTGOMERY, D.C. & MCCARVILLE, D.R. (1996): Modifi ed desirability functions for multiple response optimization. J. Qual. Technol., 28, 337–345.
DIÑEIRO GARCÍA, Y., SUÁREZ VALLES, B. & PICINELLI LOBO, A. (2009): Phenolic and antioxidant composition of by- products from the cider industry. Food Chem., 117, 731–738.
GOÑI, I., DÍAZ-RUBIO, M.E., PÉREZ-JIMÉNEZ, J. & SAURA-CALIXTO, F. (2009): Towards an update methodology for measurement of dietary fi ber, including associated polyphenols, in food and beverages. Food Res. Int., 42, 840–846.
GULLÓN, B., FALQUÉ, E., ALONSO J.L. & PARAJÓ, J.C. (2007): Evaluation of apple pomace as a raw material for alternative applications in food industries. Food Technol. Biotech., 45, 426–433.
GULLÓN, B., YÁNEZ, R., ALONSO, J.L. & PARAJÓ, J.C. (2008): L-Lactic acid production from apple pomace by sequential hydrolysis and fermentation. Bioresource Technol., 99, 308–319.
HANG, Y.D. & WOODAMS, E.E. (1995): β-Fructofuranosidase production by Aspergillus niger species from apple pomace. LWT – Food Sci. Technol., 28, 340–342.
JOSHI, V.K. & DEVRAJAN, A. (2008): Ethanol recovery from solid state fermented apple pomace and evaluation of physico-chemical characteristics of the residue. Natural Product Radiance, 7, 127–132.
MEHDIKHANI, P., BARI, M.H. & HOVSEPYAN, H. (2011): Screening of Saccharomyces cerevisiae for high tolerance of ethanol concentration and temperature. Afr. J. Microbiol. Res., 5, 2654–2660.
PARK, Y.J., YOON, D.E., KIM, H.I., KWON, O.C., YOO, Y.B., KONG, W.S. & LEE, C.S. (2014): Overproduction of laccase by the white-rot fungus Pleurotus ostreatus using apple pomace as inducer. Mycobiology, 42, 193–197.
PINA, C.G. & HOGG, T.A. (1999): Microbial and chemical changes during the spontaneous ensilage of grape pomace.
J. Appl. Microbiol., 86, 777–784.
QUEROL, A., BARRIO, E. & RAMÓN, D.A. (1992): Comparative study of different methods of yeast strain characterization. Syst. Appl. Microbiol., 15, 439–446.
RODRÍGUEZ MADRERA, R., PANDO BEDRIÑANA, R. & SUÁREZ VALLES, B. (2015): Production and characterization of aroma compounds from apple pomace by solid-state fermentation with selected yeasts. LWT – Food Sci.
Technol., 64, 1342–1353.
RODRÍGUEZ MADRERA, R., PANDO BEDRIÑANA, R. & SUÁREZ VALLES, B. (2017): Enhancement of the nutritional properties of apple pomace by fermentation with autochthonous yeasts. LWT – Food Sci. Technol., 79, 27–33.
SHALINI, R. & GUPTA, D.K. (2010): Utilization of pomace from apple processing industries: A review. J. Food Sci.
Tech., 47, 365–371.
SUÁREZ, B., ÁLVAREZ, A., DIÑEIRO GARCÍA, Y., DEL BARRIO, G., PICINELLI LOBO, A. & PARRA, F. (2010): Phenolic profi les, antioxidant activity and in vitro antiviral properties of apple pomace. Food Chem., 75, 339–342.
TORIJA, M.J., ROZÉS, N., POBLET, M., GUILLAMÓN, J.M. & MAS, A. (2003): Effects of fermentation temperature on the strain population of Saccharomyces cerevisiae. Int. J. Food Microbiol., 80, 47–53.
USDA FOREIGN AGRICULTURAL SERVICE (2017): http://apps.fas.usda.gov/psdonline/circulars/fruit.pdf. [last accessed 10 October 2017].
VILLAS-BOAS, S.G., ESPOSITO, E. & MATOSDE MENDOÇA, M. (2003): Bioconversion of apple pomace into a nutritionally enriched substrate by Candida utilis and Pleurotus ostreatus. World J. Microb. Biot., 19, 461–467.