Opportunity Knocks:
An Economic Analysis of Television Advertisements
Andrew Hanks
∗Washington State University
Trenton G. Smith
†Washington State University Attila Tasnádi
‡Corvinus University of Budapest November 15, 2010
Abstract
Certain aspects of advertising–especially on television–are not easily explained with conventional economic models. In particular, much of the imagery and repetitive the- matic content seen in advertisements seem “psychological” in nature, as opposed to
“informative.” To understand the economic rationale for this phenomenon, we develop a theory of endogenous preferences in which information about threshold payoffs (which we interpret as being present over the course of human evolutionary history) induces sudden shifts in demand. We show that the resulting demand functions give firms incentive to provide threshold-related information. To examine the use of threshold- related content in practice, we study a sample of 370 television advertisements. We find occurrences of threshold-related content in 83% of food and beverage advertise- ments for children and in 71% of advertisements for general audiences. Furthermore, the threshold-related content in children’s food and beverage advertisements occurred with statistically greater frequency than factual content, which was not true for food and beverage advertisements aimed at general audiences.
∗School of Economic Sciences, PO Box 646210, Washington State University Pullman, WA 99164-6210, USA (e-mail: andrew_hanks@wsu.edu)
†School of Economic Sciences, PO Box 646210, Washington State University Pullman, WA 99164-6210, USA (e-mail: trentsmith@wsu.edu)
‡Department of Mathematics, Corvinus University of Budapest, Fővám tér 8, 1093 Budapest, Hungary (e-mail: attila.tasnadi@uni-corvinus.hu)
1 Introduction
Advertising plays a critical role in a market economy. By conveying information about price, quality, and the existence of new products, advertisements facilitate exchange, expand sales, and enhance competition. A rich theoretical literature has developed in economics that sheds light on the conditions under which firms will advertise, the types of products they advertise, the types of information advertisements convey, and the means through which advertisements reach consumers.
Many advertisements, especially those on television, contain images and thematic con- tent that is generally understood as uninformative in conventional economic models. Social psychologists and marketing professionals, however, have devoted a great deal of energy (and considerable sums of money) to the task of understanding the hidden motives of the consumer, and the subtle–and evidently information-free–ways in which advertisements can influence consumer behavior.
Our objective is to propose an economic rationale for the use of advertising content that is more “psychological” in nature. We are especially interested in the way in which such content can lead to shifts in product demand, as well as the payoff structure available to producers. We draw upon the theory proposed in Smith and Tasnádi (2007, 2009) and develop a model in which seemingly psychological aspects of television advertisements can be viewed as informative signals about potential opportunities that are designed to induce non-convexities in consumer preferences. These non-convexities in preferences correspond in shifts in demand. Producers respond to this behavior by sending messages, in the form of advertisements, in an attempt to capture as much of the market as possible. The theory also generates ex ante predictions about ad content that we use to interpret the content we observe in a sample of television advertisements.
2 Background
The social function of advertising is undoubtedly the provision of information concerning the prices and qualities of goods and services available in the markets (Kaldor, 1950).
Economic theories of advertising have for the most part aligned with Kaldor’s (1950) classic summary. Profit maximizing firms, however, are not concerned about how product information enhances social welfare. Their end goal is to increase profits, and advertising can act as a means to generate potential transactions. Therefore, from a producer’s perspective, information provision in advertisements is a means to an end, the end being increased demand for the product.
Though much of the economic analysis of advertising has abstracted from questions of information,1 work by Nelson (1970, 1974), and Milgrom and Roberts (1986), demonstrates the way in which advertisements inform buyers about product characteristics and/or signal product quality. Moreover, Anderson and Renault (2006) demonstrate how a producer can strategically provide information about product characteristics, and/or, price and still affect consumer demand. In each of these articles, advertisements result in demand shifts as preferences remain unchanged.
In addition to demand shifts, Dorfman and Steiner (1954) suggest that advertisements can also change the shape, or position, of demand. As a very clever extension to Dorfman and Steiner (1954), Johnson and Myatt (2006) demonstrate theoretically that information related to product characteristics, features, and price–hype–all shift market demand, while in- formation about product style and appeal–real information–rotates market demand.2 These types of rational agent models emphasize that agents respond to advertisements that contain product information directly related to product characteristics, price, and quality, or simply because the advertisement exists (product recognition, repetition). A significant amount of the content in advertisements, especially those on television, however, is more thematic in nature.3 There are theoretical and empirical motivations for arguing that thematic-type content can also affect demand.
1Stigler and Becker (1977) and Becker and Murphy (1993) suggest that advertisements and the respective product are complements, so increases in the level of advertising can increase demand for the product. Dixit and Norman (1978) also propose a model where advertising shifts demand, though they argue that it is through a change in tastes. This is in contrast to the theory of stable preferences in Stigler and Becker (1977).
2Meyerhoefer and Zuvekas (2008) find that direct-to-consumer advertising of pharmaceuticals both shifts and rotates demand.
3Although Kaldor (1950) envisioned the function of advertising as providing information in the market place, he recognized that in practice, advertisements deviated from this view.
To begin with, Chakraborty and Harbaugh (2010), show how a biased expert can make use of “cheap talk”, i.e., unverifiable messages, to influence a decision maker.4 Furthermore, Mullainathan, Schwartzstein, and Schleifer (2008) model how advertisers use what may be considered uninformative content to create associations that can affect consumer behavior.5 In the realm of social psychology and marketing, Heath, Nairn, and Bottomley (2009) report evidence that advertisements with more emotional content had a greater effect on product perception when compared to responses to advertisements with more informational content. There is also evidence that music (Gorn, 1982; Keflaris and Cox, 1989) and environ- ment (Dijksterhuis et al., 2005) influence consumer behavior. Both music and environment send very distinct contextual cues. Recently, Patrick Edson, the MillerCoors VP of mar- keting and innovation said, “Great organizations get to focus on a real rich area, which is our ability to decipher consumers’unarticulated needs andunconscious behaviors” (Ad Age, 2009, emphasis added).6 There is plenty of evidence that social psychologists and marketing experts recognize the efficacy of situational content in advertising.
Exactly how these situational-type messages work is not completely understood, but it is important to note that various studies have provided evidence that content can affect consumers in ways that escape the notice of consumers. For example, Langmaid and Gordon (1988) report that hypnotized subjects were able to recall almost every detail of previously viewed television advertisements. This was in contrast to non-hypnotized subjects who did not recall the advertisements very well at all. Furthermore, Schacter (1996) found that people tend to prefer products in ads they just saw, even when they do not remember having seen the advertisement. Gazzaniga (2000) reports on the results from multiple studies of subjects whose left and right brain hemispheres were surgically separated. In one of the studies, for example, subjects were shown pictures while covering the left eye. The subjects then responded to commands as if they had seen the picture, without recalling actually seeing the
4This work is related to the Crawford and Sobel (1982) model of information transmission.
5In their model, they assume that certain agents (“coarse thinkers”) store information in categories where two items in the same category are linked by some association, or analogy. Advertisers (“persuaders”) can improve the perception of one item in a category by providing positive information about another item in the same category. Alternatively, advertisers can create new analogies the agent had not previously developed.
6This statement was part of a seminar given at the 2009 Association of National Advertisers Branding Conference. Edson’s statement followed 14 consecutive quarters of sales growth for MillerCoors.
picture.7 Thus, there is recurring evidence in the literature that suggests advertising content has the potential to affect consumer behavior in ways unnoticed by the consumer.8
In a recent study, economists Bertrand, Karlan, Mullainathan, and Zinman together with psychologist Shafir (Bertrand et al., 2010) report the results of a field study where they varied the creative content of a mail flyer that advertised consumer loans. They report that surprisingly minor changes to the printed mailer had large effects on response rates.
Despite this result, they wrote, “We found it difficult to predict ex ante which types and variations of creative content would affect demand. This fits with a central premise of psychology–context matters–and suggests that pinning down the effects that will matter in various market contexts might require systematic field experimentation on a broad scale” (p.
302). We would add that a more powerful predictive theory is needed to complement this ambitious goal. The objective here is to develop a theory that will represent a step in this direction.
We build on the work of Johnson and Myatt (2006) by classifying what type of content affects demand. We examine, however, the issue of content outside the realm of hype and real information, i.e., content that is thematic in nature. Our approach is to formulate a simple problem–achieving a threshold level of some “quality”-that approximates a broad class of adaptive problems faced by the human species over the course of evolutionary history.
Since the effects of uninformative content are more psychological (and, it is becoming increasingly apparent, biological) in nature, it seems natural to consider the evolutionary origins of consumer behavior.9 In the pre-industrial era, humans necessarily learned to re- spond to states of nature, e.g., environmental, social, familial, and other cues, to maintain health, survive, and successfully reproduce. Even though situations and responses to situa- tional cues can change over time (see Konner, 2002), the underlying motivations to maintain
7See Petty, Cacioppo, and Schumann (1983) and Heath (2001) for interesting details regarding mental processing of received messages.
8Sutherland (2008) points out that advertising affects behavior in subtle ways, and that the mystical concept of “subliminal” advertising is merely a myth.
9Responses of this nature may seem more instinctive than psychological. The biological mechanisms through which responses to various cues develop, however, are the root of human psychology and not at all separate from it. According to Konner (2002), “The body displays ancient signals and concomitants of emotion; yet these reactions are not the emotion itself and they do not account for the control of fear and flight, which must be sought in the brain.”
good health, survive, and reproduce have been an integral part of human evolutionary his- tory.
Consistent with human evolutionary history, the consumer in our model responds to cues about the threshold levels of quality that correspond directly to states of nature. This behav- ior provides the incentive for advertisers to send signals with the expectation of influencing a consumer’s beliefs about threshold levels. Specifically, we think of the advertiser as sending messages about potential opportunities, that is, achieving a threshold level of quality when success is uncertain. The opportunities to which we refer are transitions from one state of nature to another, i.e., transitioning from a low probability, high threshold state to a state where product consumption is associated with obtaining the threshold. The message about the high threshold state is that favorable outcomes–health, survival, finding a mate–are never certain, so one should “watch out” for the negative effects of not achieving the threshold.
We begin with a theoretical context that follows Smith and Tasnádi (2007) where an agent has preferences for product quality and prefers to consume at least k units of that quality. They assume that the amount of quality in the choice of consumption goods is unknown, but the distribution of quality is known and equivalent for the goods. As a result, when the chance of achieving the threshold level of quality is high, consumers will choose a combination of goods, i.e., behave in a risk-averse manner. On the other hand, when the chance of achieving the threshold is low, consumers will specialize in consumption of one of the goods, i.e., behave in a risk-taking manner. This translates into demands which are discontinuous ink. We refer to behavior of this sort as situationally dependent; the consumer will change consumption decisions based on the available information about the thresholdk.
We then examine the behavioral implications of this preference structure in a competitive market framework. Under certain conditions, we show that competing duopolists have an incentive to expend resources in an effort to influence the consumer’s perception about the threshold k and obtain a greater share of the market. Our theory not only provides an explanation for the repeated use of situational-type content, but it also provides ex ante predictions about the type of content an advertiser would select. A discussion of results from a content analysis of television advertisements follows. Finally, we conclude with suggestions for future research.
3 Advertising and Endogenous Preferences
In economic theory, it is standard practice to assume stable preferences over consumption goods. We propose a model where preferences are are defined with respect to latent qualities or outcomes, so that preferences for goods are sensitive to information regarding the threshold level of quality. Preferences of this nature will allow us to demonstrate how information about threshold can affect product choice.
3.1 Utility in the Presence of a Quality Threshold
The household production model is one useful method for analyzing preferences for quali- ties.10 A consumer uses goods purchased in the marketplace, along with time, human capital, and other training to produce non-market goods, i.e., desired qualities. The production func- tion for these home produced goods may exhibit decreasing, constant, or increasing returns to scale.
In the general case, assume that a consumer has preferences defined over a set of non- market goods, Z1, ..., Zn, which represent qualities the consumer desires to consume, e.g., flavor, nutrition, and style. The consumer takes the market prices as given and purchases market goods, x1, ..., xm, and uses these to produce non-market goods via household produc- tion technologies Zj = hj(x1, ..., xm). The household production techonolgies may include human capital, time, and other training. For simplicity, we assume the Zjs are linear func- tions of the xis, and that human captial, time, and other training are fixed and homogenous across consumers.
We assume that there are two market goods,xandy, and one quality,Z. The consumer’s decision problem is to maximize utility subject to his resource constraint and the household production constraint, i.e.,
maxU(Z) s.t. m=pxx+pyy, Z =αxx+αyy,
where αx and αy represent the technology used to transform the qualities in x and y to the
10See Lancaster (1966) and Stigler and Becker (1977). The Stigler and Becker (1977) article includes a section on advertising.
desired quality Z.
One of the assumptions of the household production model is that the quality of the market goods is known. When the consumer produces quality Z with goods x and y, the consumer knows exactly the amount of Z he will consume. We relax this assumption and study the situation where quality of the market goods is unknown, but the distribution of quality in each of the goods is known. Both x and y are fixed amounts but we will let αx
and αy be random variables which characterize the distribution of quality in their respective market goods. Since the level of a particular quality in both goods is unknown, Z is also a random variable. Furthermore, the utility function U(Z) is now itself a random variable, and we assume that U(Z) has the expected utility form so that the expected value of U(z)
can be written as Z ∞
0
U(z)f(z)dz, (1)
where z is the outcome of Z and f(z) is the probability density function of Z.
We impose one final restriction and assume that the combination ofxandymust achieve a threshold levelk or utility is 0. Specifically, we can think of utility as 0 when the combination ofx andy yields a quality level belowk, and utility equals 1 when the combination ofx and y yields a quality level greater thank. As a result, the expected utility form simplifies to
Z ∞
k
f(z)dz (2)
which characterizes both the expected utility, and probability, of achieving the threshold level k. The decision problem can be restated as the consumer maximizing the probability of achieving a threshold level k. In the context of human evolutionary history, we will refer to the threshold level as good health, survival, and finding a mate.
Tasnádi, Smith, and Hanks (2010)11 focus on this simplified version of the household production model and show that if consumers choose goods so as to maximize the probabil- ity of achieving some threshold level of quality, new information about the threshold level (provided, perhaps, by an advertisement) can induce non-convex preferences over goods and sudden shifts in demand. In what follows, we briefly discuss a modified version of their
11The model in Tasnádi, Smith, and Hanks (2010) is very similar to that in Smith and Tasnádi (2009), and both models are a more specific version of Smith and Tasnádi (2007).
consumer decision problem. Then, we apply the consumer’s decision problem to a duopoly game in which firms compete by choosing price and advertising levels.
As mentioned previously, a consumer is faced with a menu of two goods, x and y, and must choose how much of each to consume, given incomemand pricespx andpy, respectively.
There is a single unobservable characteristic (“quality”) for which there is a critical threshold:
the consumer seeks only to maximize the probability that he consumeskunits of this quality.
The amounts of the unobservable quality per unit of x and y are independent random variables, denoted αx and αy, with distribution functions F and G, respectively. Formally, the consumer’s utility function is given by
V (x, y) = Z ∞
k
f(z)dz =P (αxx+αyy≥k), (3) and his decision problem can be stated:
maxx,y V(x, y),
s.t. pxx+pyy ≤m, (4)
x, y ≥0.
We assume that the random variables αx andαy are distributed according to the uniform distribution on the interval [0,1]. Then the utility function (3) is given by
V(x, y) = Z ∞
k
Z min{x,t}
max{0,t−y}
1 xyfz
x
g
t−z y
dzdt (5)
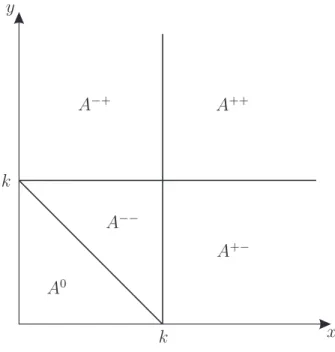
which requires integration across five distinct regions in commodity space, which we illustrate in Figure 1.12
Following Smith and Tasnádi (2007, 2009), we will refer to these regions as follows: the
“death zone”
A0 =
(x, y)∈R2+|x+y≤k
in which the probability of meeting the threshold is zero, the low-probability region A−− =
(x, y)∈R2+ |k < x+y, x≤k, y ≤k
12See Smith and Tasnádi (2007) for a complete proof.
k
k A0
A−−
A−+ A++
A+−
x y
Figure 1: Five Regions
in which the probability of meeting the threshold is positive but the consumption levels of both goods are small (i.e.,x, y ≤k), the region
A−+ =
(x, y)∈R2+|x≤k, k < y
in which the consumption level ofx is small, the region A+− =
(x, y)∈R2+|k < x, y ≤k
in which the consumption level ofy is small, and the region A++=
(x, y)∈R2+|k < x, k < y
in which the consumption levels of bothxandyare large relative to the size of the threshold.
Integration of (5) yields
U(x, y) =
0 if 0≤x+y≤k,
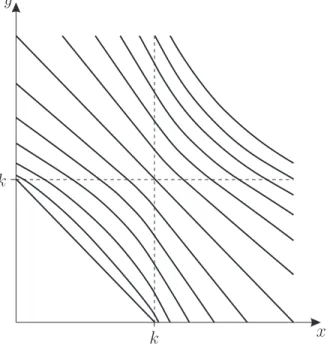
1− kx + 2xy +(k−x)2xy2 if x+y > k, x≤k and y≤k, 1 + 2yx −ky if x+y > k, x≤k and y > k, 1 + 2xy − kx if x+y > k, x > k and y≤k, 1− 2xyk2 if x+y > k, x > k and y > k.
Note that utility is zero in regionA0, strictly convex in region A−−, linear in A+− andA−+, and strictly concave in region A++, as shown in Figure 2 (Smith and Tasnádi, 2007, 2009).
Based on the above utility function, we derived the correspondences for x and y that solve the decision problem in equation (4). Specifically, (x∗, y∗)∈
n m
2px,2pm
y
o
if 2pm
x > k and px ≥py; n0,pm
y
o if 2pm
x < k and px > py; nλ
m 2px,2pm
y
+ (1−λ) 0,pm
y
, λ∈[0,1]o if 2pm
x =k and px > py; n m
2px,2pm
y
o
if 2pm
y > k and px < py; nm
px,0o
if 2pm
y < k and px < py; n
λ
m 2px,2pm
y
+ (1−λ)
m px,0
, λ∈[0,1]o if 2pm
y =k and px < py; n0,pm
y
,
m px,0o
if 2pm
x < k and px =py; nm
py −λ, λ
, λ∈[0,pm
x]o
if 2pm
x =k and px =py. if positive utility levels are attainable (pm
x > k or pm
y > k).13 These demands are set-valued in four cases. For simplicity, we resolve this indeterminacy by assuming that the consumer spends his money equally between the two products whenever possible. However, this is not possible if 2pm
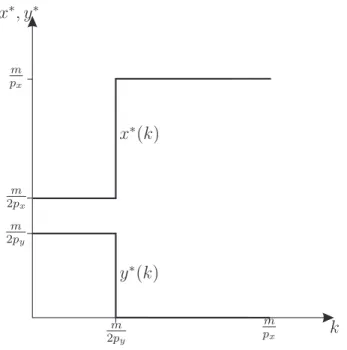
x < k and px =py. In this case, we assume that the consumer randomizes between the two corner solutions by choosing either with probability1/2.14 A key result from the consumer’s decision problem is that demand is discontinuous in the threshold parameter k. In Figure 3 we show how the presence of a high threshold leads the consumer to specialize in consumption of one good. This behavior is an attempt to shift as much probability mass as possible to the event of obtaining the favorable outcome.
The indifference curves inx, y-space demonstrate concave preferences below the threshold and convex preferences above the threshold. Quality of x and y is not observed until they are consumed, thus the consumer must allocate resources in such a way that the probability of achieving the threshold is maximized. When the threshold is high, the consumer will specialize in one good and when the threshold is low, he will consume a combination of the
13See Smith and Tasnádi (2007, 2009); Tasnádi, Smith, and Hanks (2010).
14Resolving indeterminacy in this way guarantees the existence of an equilibrium in pure strategies in Proposition 1. Otherwise, there would exist many ε-equilibria in pure strategies close to the solution given in Proposition 1.
goods, since this will yield a higher probability of achieving the threshold. This behavior can be understood as risk-taking when the threshold is high and risk-averse when the threshold is low. As mentioned above, the risk-taking strategy is optimal when k is high because the consumer wishes to shift as much probability mass as possible to the favorable outcome.
k k
x y
Figure 2: Indifference Curves (k = 1)
3.2 Thresholds
Our theory emphasizes a binary outcome (satisfaction of a threshold) both because it is an analytically tractable assumption, and because it represents a broad class of adaptive problems likely to have been important in human evolutionary history. Most generally, evolutionary biologists typically sort evolutionary forces between those acting via natural selection (e.g., survival), and those acting via sexual selection (e.g., reproduction).15 Sur- vival (i.e., live or die) and reproduction (i.e., find a mate or don’t; produce an offspring or not) are the starkest of binary outcomes, and they still affect our behavior today, in ways big and small. Of course, outcomes are never certain, and perfect information about impor- tant life events has never been readily available, so the behavioral implications of underlying
15In their bookHow Humans Evolved, Boyd and Silk (2009) explain, “...we have focused on reproductive behavior because mating and parenting strongly affect fitness.”
m 2py
m 2px
m px
m 2py
x∗(k)
y∗(k)
m
px k
x∗, y∗
Figure 3: Optimal solutions for x and y as functions of k
threshold payoffs will necessarily be dominated by responsiveness to available information.
It is also important to recognize that the preference structure presented above directly relates to situation-dependent utility. In other words, the consumption decision is affected by the current level of k. This is similar to the work by Caplin and Leahy (2004) where a
“concerned expert” determines whether it is optimal to fully reveal the true state of the world to a recipient whose utility is affected by evolving beliefs about the current state of the world, as well as observed outcomes.16 Such models of belief dependent utility provide important insights for understanding why context matters in advertisements. In what follows, we will show how firms make use of the belief dependent utility by providing information about the threshold level of quality.
3.3 Simple duopoly game
Here, we develop a model with competing duopolists and show that the presence of the threshold affects pricing and advertising decisions. In the market there are two competing duopolists, firms x and y, that set prices px and py, respectively. Moreover, the firms can
16Utility of this nature is directly related to utility in psychological games. These games were first studied by Geanakoplos, Pearce, and Stacchetti (1989).
manipulate the consumer’s threshold level with advertisement levels δx and δy, respectively.
The firms have linear cost functions with respective positive unit costs cx and cy. The demand functions Dx and Dy of the two firms are derived from the utility maximization problem of the representative consumer described in the previous section. The firms’ profit functions equal
Πi(px, py, δx, δy) = Di(px, py, k+δx+δy)(pi−ci)−aδ2i,
wherea is a positive parameter for advertisment costs, andi=x, y. In what follows we will assume that cx < cy.
The duopolists interact in a three stage game where in the first stage, the low-cost firm chooses its advertising strategy, δx. In the second stage, the high-cost firm reacts by choosing δy, and finally the firms set their prices simultaneously. To simplify the analysis, we assume that firm y stays out of the market if it cannot make positive profit. This simplification implies a modification of our results from Tasnádi, Smith, and Hanks (2010), which determine the Nash equilibrium of the final subgame. Hence, we obtain the following results for the final subgame.
Proposition 1 If 2cm
y > k, then there exists a unique Nash equilibrium in which both firms set price p∗ = 2km.
When we enter a different region of the commodity space, the pricing decision for the firms changes. Proposition 2 demonstrates this change.
Proposition 2 If mc
x ≥ k ≥ 2cm
y, then firm x will drive firm y out of the market by setting price cy.
Finally, we mention the case in which firmsx and y can just sell their products by taking a loss. In this case the firms can stay out of the market by setting sufficiently high prices.
Proposition 3 If k > cm
x, then firms x and y stay out of the market by setting prices above their respective unit costs.
We will now introduce the situation where the duopolists can advertise. Consider Propo- sitions 1 and 2. It appears that if 2cm
x > k and 2cm
y > k, then firm x could benefit from increasing the threshold level to move the consumer into region 2cm
x > k+δ > 2cm
y. Clearly, firm y has opposite incentives. Recall that demands are discontinuous functions of the threshold, so the relative magnitude of k will affect firm behavior.17
We solve the advertising and pricing game by backwards induction. If the firms set δx
and δy in the first two stages, then these decisions are sunk costs in the final stage. Thus, the final subgame reduces to the game covered by Propositions 1, 2 and 3, wherek has to be replaced withek =k+δx+δy. The selected values forδx andδy determine, which proposition of Propositions 1, 2 and 3 must be applied for the final price-setting stage. For instance, by Proposition 1, the firms set pricesp=px =py = 2emk if 2cm
y >ek.
Now we turn to stage 2 in which δx is given. The profit function of firm y equals18 Πy(δy) =
m
2 −(k+δx+δy)cy −aδ2y if 2cm
y > k+δx+δy >0,
−aδ2y if 2cm
y ≤k+δx+δy ork+δx+δy ≤0. (6) By taking the first-order condition of the first case, we obtain thatδ∗y =−c2ay solves the profit maximization problem of firm y if 2cm
y > k +δx+δy∗ > 0 and Πy(δ∗) > 0. Since the latter inequality is equivalent to 2cm
y > k +δx− c4ay condition 2cm
y > k+δx +δy∗ is less restrictive than Πy(δ∗)>0, and thus, we obtain the following ‘best response function’:19
δy∗(δx) =
−c2ay if 2cm
y > k+δx−4acy and k+δx− c2ay >0, 0 if
m
2cy ≤k+δx−4acy and k+δx− c2ay >0 or k+δx− c2ay ≤0 and m2 −a(k+δx)2 ≤0
,
−k−δx if k+δx− c2ay ≤0, and m2 −a(k+δx)2 >0.
We have an interior solution in the first case, while for the second case Propositions 2 and 3 apply for the terminal subgame; in particular, firm y stays out of the market. In the third case, the best reply function for firm y demonstrates that as the threshold decreases
17We focus on the case whenkis sufficiently high to allow use of standard optimization techniques. When kis relatively low, we rely on suprema instead of maxima to study equilibrium conditions.
18Based on the two sentences following equation (6) it can be verified thatΠy is nonnegative.
19In some cases a best response does not exist. In these cases, we have considered the appropriatesup value of the profit function.
in magnitude, interior solutions no longer obtain and we must rely on suprema instead of maxima concerning the profits of firm y. The definition of the best reply by
δysup=−k−δx, (7)
is motivated by the fact that sup
Πy(δy)| m 2cy
> k+δx+δy >0
= lim
δy→(−k−δx)+Πy(δy) if k+δx− c2ay ≤0.20
Finally, we determine the first-stage action of firm x. Taking the reaction of firm y into account and assuming that firm x has to enter the market even if it makes losses, firm x’s profit function is given by
Πx(δx) =
m
2 −(k+δx−2acy)cx−aδx2 if 2acy −k < δx < 2cm
y −k+4acy, (i)
m− mc
ycx−aδx2 if 2cm
y −k+ c4ay ≤δx and 2acy −k < δx, (ii) m− mc
ycx−aδx2 if pm
2a−k ≤δx≤ 2acy −k, (iii)
m
2 −aδx2 if −k≤δx <pm
2a−k and δx≤ 2acy −k, (iv)
−aδx2 if δx <−k. (v) In order to simplify the presentation of our results and to decrease the number of pos- sible scenarios, we assume that firm x enters the market. We will refer to the regions corresponding to the above five regions by (i)-(v), respectively. One can check that Πx is piecewise continuous and differentiable, where the appropriate intervals can be obtained by looking at the boundaries of the five regions. Observe that region (iii) is empty if 2ma > c2y, while region (i) is empty if 2ma < c2y. Hence, we have to check Πx either on the intervals (−∞,−k), −k,2acy −k
, c
y
2a −k,2cm
y −k+4acy ,
m
2cy −k+c4ay,∞
or (−∞,−k),
−k,pm
2a−k
, pm
2a−k,2cm
y −k+4acy ,
m
2cy −k+4acy,∞ . LetΠix(δx) = m2−(k+δx−c2ay)cx−aδx2,Πiix(δx) = Πiiix (δx) =m−mc
ycx−aδx2,Πivx(δx) = m2−aδx2 and Πvx(δx) = −aδ2x, where all five functions are assumed to be defined over the entire real line (and not only above the respective intervals one should expect fromΠx). The maximum values for Πix,Πiix and Πivx are achieved at −c2ax,0 and 0, respectively. It can be verified that Πix c2ay −k
= Πivx 2acy −k .
20This is equivalent to changing the demand and profit functions at threshold level0 in order to simplify our analysis. If under this modified specification an equilibrium with k+δx+δy = 0 arises, the original game has manyε-Nash equilibria close to the determined solution of the modified game.
3.3.1 An Interesting Case
In the following proposition, we demonstrate that the low-cost firm will use information about thresholds in advertisements to drive the high-cost firm out of the market.21
Proposition 4 If c2ay −k <−c2ax, 0< 2cm
y +4acy −k and Πiix
m 2cy
+ cy
4a −k
>Πix
−cx
2a
, (8)
then the low-cost firm drives the high-cost firm out of the market by increasing the consumer’s threshold level via advertisments (δx = 2cm
y + c4ay −k) and setting price cy. Proof. It can be checked that by−c2ax < 2cm
y −k+ c4ay we haveΠix −c2ax
>0, and therefore it follows that maximizing Πx(δx) gives us the required first-stage action of firm x. By our assumptions and the continuity ofΠxat2acy−k, we only need to maximizeΠxover the intervals hcy
2a−k,2cm
y −k+ c4ayi and h
m
2cy −k+c4ay,∞i
.22 It can be verified that Πix is maximized at δx =−c2ax within hc
y
2a−k,2cm
y −k+c4ayi
and Πiix at 2cm
y −k+4acy withinh
m
2cy −k+4acy,∞i by our assumptions, which completes the proof by consideringΠx(δx), δ∗y(δx)and Πy(δy). The appropriate price is determined by the results in Propositions 1 and 2.23
Proposition 4 demonstrates the situation where the low cost firm’s profits from driving the high-cost firm out of the market are greater than the profits from choosing a strategy to share the market with that firm. The profit functions take the form
m−m cy
cx−a m
2cy
−k+ cy
2a
> m 2 −
k− cx
2a − cy
2a
cx−acx
2a 2
. (9)
When it is profitable, the low-cost firm will advertise to increase the threshold just enough, and will set a price equal to cy, so that the high cost firm will not enter the market. Thus, the low-cost firm receives all incomemand though production increases, will not pay enough in costs to justify switching to the market-sharing strategy. Note that for this result to hold, the income to production cost ratio must be high, especially relative to the threshold.
21As is evident in the analysis of the duopolist’s game, there are various other equilibrium situations that arise, given certain conditions. The set of full derivations is available from the authors upon request.
22Πvx(δx)is negative in region (v).
23A more general proof is available from the authors.
According to our model of preferences, information that the threshold is high suggests that the consumer has a low probability of achieving the threshold. Thus, the consumer will choose the good which will yield the highest chance of obtaining the favorable outcome.
This result fits nicely with our story that messages about the threshold level can influ- ence demand. If humans still respond to cues that inform them about the current state of health, survival, and reproduction, it should not be surprising that advertisers incorpo- rate related content into their ads. Furthermore, use of content related to health, survival, and reproductive success places the product in the context of these threshold-type situa- tions. Since realizations of good health, survival, and reproductive success are often binary in nature–achieved or not–we think of realizing favorable outcomes as achieving a threshold level of quality. Environmental, situational, or other cues about the state of nature trigger behavioral responses that have developed over the thousands of years of natural selection (see Konner, 2002). Firms recognize this behavior and under a proper set of parameters, a firm will advertise a high-thrshold state. From the firm’s perspective, it is only reasonable to send positive product messages. Thus, we interpret advertisements as presenting two distinct states, one in which the threshold is high and the payoff is very uncertain, and one in which the product is associated with achieving the threshold.24
To cite one stark example, an advertisement which aired in 2002 for the McDonald’s Mighty Kids Meal (described in Smith, 2004) shows a group of children playing basketball.
One of the children suddenly freezes and his friends carry him inside his house, set him on a couch, and set a fast food meal directly in front of him. Miraculously, the child jumps back to full activity as he rapidly consumes the meal. Before product consumption, the child’s state of nature was serious–the threshold was very high. In this advertisement, the states of nature represented are: 1) the fact that good health is never certain and 2) consumption of this particular meal is associated with the favorable outcome of good health. The power of such an appeal is informed by knowledge of nutritional anthropology: in the pre-industrial world in which humans evolved, micronutrient deficiencies were not uncommon. A child in that world witnessing such a scene–in which a specific food item appears to cure a severe
24This is consistent with the theory presented in Mullainathan, Schwartzstein, and Schleifer (2008). The analogies in our model can be thought of as situations where product consumption is associated with achieving the threshold.
illness–would do well to incorporate said food item into his diet, enthusiastically. The high threshold is suggested through uncertain health and the favorable outcome, associated with good health, is associated with consumption of the McDonald’s Mighty Kids Meal.
We have reason to expect that advertisers employ different strategies for content use when targeting different audiences. To be specific, the types of situations children and adults faced in the pre-industrial era were different then, and still are today. For example, children develop dietary preferences and tastes for foods by observing dietary habits of family and friends (Smith, 2004). Also, younger children are not expected to be influenced by associations between the product and romance. Thus, we expect to see less content related to courtship in children’s advertisements compared to the frequency of the same content in advertisements for general audiences.
4 Data and Evidence
In order to study the content in advertisements, we collected a convenience sample of 370 unique nationally broadcast television advertisements.25 A general description of our sample is provided in Table 1.26 Although the sample is weighted towards children’s programs in terms of time, there were fewer unique advertisements during these programs.
Table 1: Ad Sample by Target Audience
Children General Audience Total
Unique Advertisements 155 215 370
Programming Hours 25 13 38
To study content in the sample of advertisements, we performed a content analysis based on a pre-determined list of content categories. We generated an initial category list af-
25We omitted advertisements that were limited to regional audiences because we believe they are less likely to include sophisticated (and hence effective) marketing techniques. Also, our sample omits movie trailers, movie advertisements, and video game advertisements since ads for these goods are of a much different nature than the ads of the other goods in the sample. Specifically, we omitted advertisements which did not include a potential product user.
26We recorded ads during children’s programming, as well as programs aimed at a more general audience, on various dates in June and July, 2007.
ter viewing a set of out-of-sample advertisements, with only minor adjustments thereafter.
Several of the categories relate to direct information such as price, product features, and verifiable claims about product quality.27
We also defined categories which captured content related to thresholds: health, survival, and finding a mate, which we will refer to as courtship. For the health threshold, we doc- umented which advertisements contained content that associated the product with obvious improvements in health or well-being. As an example, a Coors Light advertisement in our sample begins with the view of a crowded street in the middle of a sweltering hot day. Traffic was very slow and people appeared lethargic and unhappy. Suddenly, a train barrels through an open lane in the street followed by a wake of snow that transforms into cans of Coors Light. Party-like music fills the streets and an immediate shift in well-being is demonstrated as the characters joyfully cheer and dance–the opportunity has been signaled. Similar to the McDonald’s advertisement described above, this ad demonstrates a contrast in states of the world that depend on product consumption. The threshold payoff is markedly improved health, which is achieved with product consumption.
Content associated with survival typically demonstrates life-threatening situations when a character (or implied character) in the advertisement does not consume the product. For example, two advertisements in our sample for Ford F-150 trucks emphasize the4-star crash rating awarded to these trucks. Also, images of the truck smashing into a wall accompany safety rating declarations. This imagery signals product safety by exposing safety features.
The opportunity presents itself as safe transportation when travel in other vehicles is dan- gerous. In other words, the threshold is high when not traveling in a Ford F-150.28
Courtship-related content associates romantic relations with product use. For example, an advertisement for a buy-one-get-one half off sale at Payless Shoes stores shows two attrac- tive female models wearing Payless shoes as they walk through an outdoor shopping area.
They step onto an escalator and exchange glances with a stylishly dressed male model on an adjacent escalator heading the opposite direction. The male model jumps over the escalator rails onto the other escalator and the two ladies look at each other and smile. At this point,
27Refer to the appendix for the specific descriptions we used when coding for content.
28Recall regionA0, the “death zone.” When k is high, this region expands over a greater set of feasible combinations ofxand y, which results in a greater probability of not achieving the threshold.
the narrator says, “Before you know it, it’s gone,” explicitly referring to the current sale. The male model then exchanges glances with another attractive female wearing Payless shoes, but headed on the escalator he previously abandoned. He looks ahead at the two he initially intended to follow and looks back at the other as she heads off the escalator and smiles. The explicit meaning of this statement is to notify viewers of the limited time offer. The imagery, however, seems to suggest that valuable romantic opportunities are available to consumers of Payless Shoes, but that success is far from certain. The narration emphasizes that the sale is limited and delays can result in missed romantic opportunities.
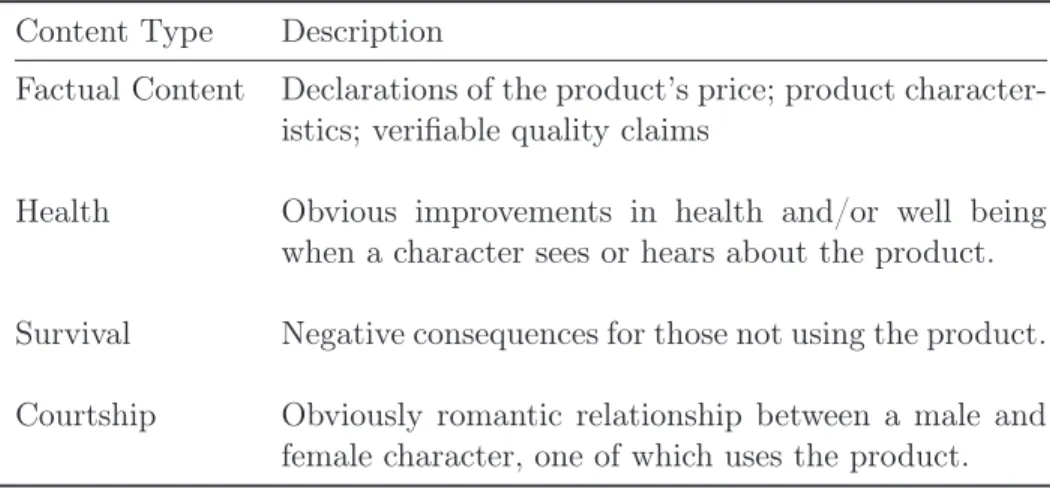
Table 2 provides a description of the threshold themes and factual content. See the appendix for more detailed descriptions.
Table 2: Content Descriptions Content Type Description
Factual Content Declarations of the product’s price; product character- istics; verifiable quality claims
Health Obvious improvements in health and/or well being when a character sees or hears about the product.
Survival Negative consequences for those not using the product.
Courtship Obviously romantic relationship between a male and female character, one of which uses the product.
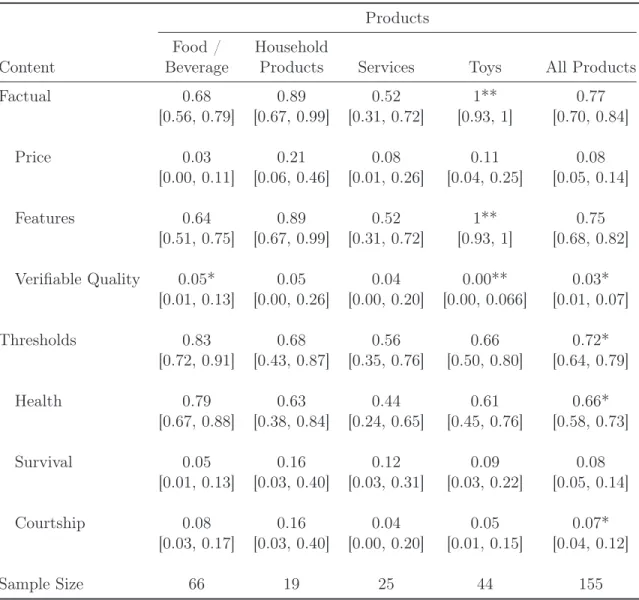
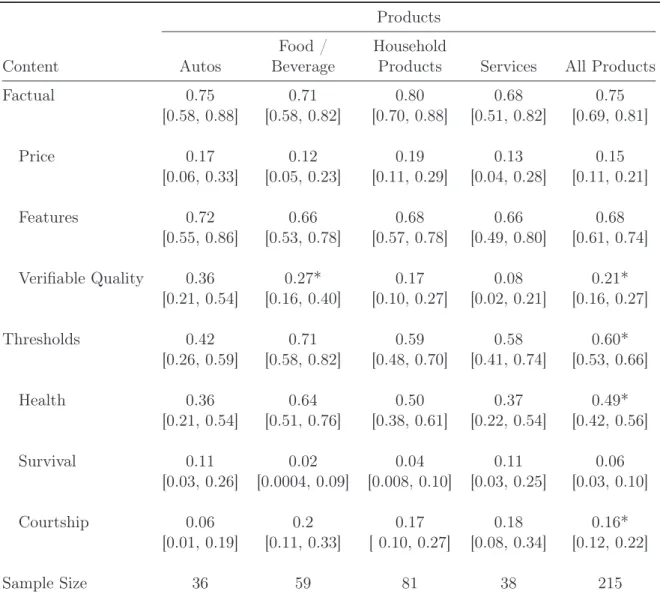
Tables 3 and 4 report estimated frequencies and confidence intervals for specific types of content during children’s programs and programs for a general audience. We will first discuss the results in the final column of each table that show the overall frequencies of specific content for advertisements targeted at children (Table 3) and advertisements targeted at a general audience (Table 4).
We report results for general factual content and then divide that content into is separate components of price, features, and verifiable quality claims. Similarly for threshold relate themes, we report general use of such themes and then report more specific threshold-related
categories of health, survival, and courtship.29 The other columns in tables 3 and 4 include frequencies for content in advertisements for specific product groups.
To begin with, it is interesting to recognize the infrequent use of price in advertisements.
Information about price occurred in 8% of all ads aimed at children and 15% of all ads aimed at a more general audience (the difference is statistically insignificant). Why advertisers do not reveal a product’s price more often is not the focus of this paper, though Anderson and Renault (2006) provide reasons why advertisers may have incentive to not disclose certain information in an advertisement. There could also be contractual or strategic reasons not to reveal prices. The theory in Anderson and Renault (2006), however, does not specify which product information the advertiser will choose to disclose.
Although product price is not frequently included in advertisements, there is a substantial amount of other factual information. The data reveal that most of this factual information comes in the form of product features, i.e., observable product characteristics whether ex- plicitly stated or shown via screen shots. For all product types, product features occur in 75% of all ads targeted at children and almost 70% of all ads targeted at a more general audience. This result also reveals that 25% of all ads targeted at children and 30% of all ads targeted a more general audience lacked any information about product features or price.
A very interesting fact in our data is that there are few verifiable quality claims. We define verifiable quality claims as claims about the product quality that could be falsified through independent testing. We found that while 3% of all advertisements aimed at children included verifiable quality claims, they appeared in 20% of all advertisements aimed at a more general audience. Furthermore, the estimated difference in frequencies of verifiable quality claims in all advertisements for children and general audiences is significant at the 95%
confidence level. This makes sense because children are probably less concerned than adults about quality, or are less likely to think about the expected future benefits signaled by a quality statement.
Tables 3 and 4 also report content frequencies for specific product types. The auto, food
29We calculated frequencies by counting whether a specific type of content occurred in an advertisement.
For the factual content and threshold-related theme general categories, if two of the specific categories were used, we still report that the general category was triggered, and not how many times it was triggered in an advertisement.
Table 3: Content Frequency by Product Type: Children Products
Food / Household
Content Beverage Products Services Toys All Products
Factual 0.68 0.89 0.52 1** 0.77
[0.56, 0.79] [0.67, 0.99] [0.31, 0.72] [0.93, 1] [0.70, 0.84]
Price 0.03 0.21 0.08 0.11 0.08
[0.00, 0.11] [0.06, 0.46] [0.01, 0.26] [0.04, 0.25] [0.05, 0.14]
Features 0.64 0.89 0.52 1** 0.75
[0.51, 0.75] [0.67, 0.99] [0.31, 0.72] [0.93, 1] [0.68, 0.82]
Verifiable Quality 0.05* 0.05 0.04 0.00** 0.03*
[0.01, 0.13] [0.00, 0.26] [0.00, 0.20] [0.00, 0.066] [0.01, 0.07]
Thresholds 0.83 0.68 0.56 0.66 0.72*
[0.72, 0.91] [0.43, 0.87] [0.35, 0.76] [0.50, 0.80] [0.64, 0.79]
Health 0.79 0.63 0.44 0.61 0.66*
[0.67, 0.88] [0.38, 0.84] [0.24, 0.65] [0.45, 0.76] [0.58, 0.73]
Survival 0.05 0.16 0.12 0.09 0.08
[0.01, 0.13] [0.03, 0.40] [0.03, 0.31] [0.03, 0.22] [0.05, 0.14]
Courtship 0.08 0.16 0.04 0.05 0.07*
[0.03, 0.17] [0.03, 0.40] [0.00, 0.20] [0.01, 0.15] [0.04, 0.12]
Sample Size 66 19 25 44 155
The bracketed values represent 95% confidence intervals for the probability estimates, located above the intervals, in the table. We omitted the auto product category from this table because our sample had only one ad of this type during children’s programs. The “All Products” column, however, includes the auto advertisement.
* Statistically different from the estimated frequency of content during programs for general audiences.
** Since the estimated frequency is 1, we cannot estimate if there is a difference between this frequency and the frequency for content during programs for general audiences.
and beverage, and toys product categories are the most narrow product categories so they likely yield the least amount of bias in estimates for the probability of content frequency.30 Thus, we will focus our discussion on these three product categories.
In food and beverage advertisements that occurred during programs for general audiences, 12% of the advertisements conveyed price information whereas 3% of food and beverage advertisements for children included price information. In the same product group, features occurred in 64% of ads for children and 66% of ads for general audiences. Once again in the same product group, verifiable quality claims occurred 27% of the time, whereas 50% of the food and beverage advertisements during children’s programs had verifiable quality claims.
We found this difference to be statistically significant.
In the automobile product category (general audience), 17% of the advertisements had price information, 72% had information about product features, and 36% had verifiable qual- ity claims. In advertisements for toys (children), we found that 11% had price information, all of them included information about product features, and none of them had verifiable quality claims.
We also found considerable evidence that advertisers use threshold-related themes. These themes occurred in 72% of all ads targeted at children and 60% of all ads targeted at adults.
Refer to the health and survival situations in the Coors Light and Ford F-150 advertisements.
In both cases, the situation suggested a high threshold and that product use would ensure the threshold is achieved. Across all product types, content directly related to health surfaced in 66% of ads targeted at children and 49% of ads targeted at general audiences. This difference is statistically significant. Survival-related content appeared in only 8% of all children’s ads and 6% of all ads for general audiences. In the Payless Shoes advertisement, the threshold for courtship increased as the chance to obtain an attractive mate seemed to slip away. In our sample, content directly related to a high courtship threshold occurred in 7% of all ads targeted at children and 16% of all ads targeted at general audiences. This difference is also statistically significant. It makes sense that advertisers use more thematic content in advertisements for children since children are probably influenced more by imagery and
30There was only 1 auto advertisement in ads targeted at children and 1 toy advertisement in ads targeted at a more general audience, thus we omit auto product category from Table 3 and we omit the toy product category from Table 4.
Table 4: Content Frequency by Product Type: General Audience Products
Food / Household
Content Autos Beverage Products Services All Products
Factual 0.75 0.71 0.80 0.68 0.75
[0.58, 0.88] [0.58, 0.82] [0.70, 0.88] [0.51, 0.82] [0.69, 0.81]
Price 0.17 0.12 0.19 0.13 0.15
[0.06, 0.33] [0.05, 0.23] [0.11, 0.29] [0.04, 0.28] [0.11, 0.21]
Features 0.72 0.66 0.68 0.66 0.68
[0.55, 0.86] [0.53, 0.78] [0.57, 0.78] [0.49, 0.80] [0.61, 0.74]
Verifiable Quality 0.36 0.27* 0.17 0.08 0.21*
[0.21, 0.54] [0.16, 0.40] [0.10, 0.27] [0.02, 0.21] [0.16, 0.27]
Thresholds 0.42 0.71 0.59 0.58 0.60*
[0.26, 0.59] [0.58, 0.82] [0.48, 0.70] [0.41, 0.74] [0.53, 0.66]
Health 0.36 0.64 0.50 0.37 0.49*
[0.21, 0.54] [0.51, 0.76] [0.38, 0.61] [0.22, 0.54] [0.42, 0.56]
Survival 0.11 0.02 0.04 0.11 0.06
[0.03, 0.26] [0.0004, 0.09] [0.008, 0.10] [0.03, 0.25] [0.03, 0.10]
Courtship 0.06 0.2 0.17 0.18 0.16*
[0.01, 0.19] [0.11, 0.33] [ 0.10, 0.27] [0.08, 0.34] [0.12, 0.22]
Sample Size 36 59 81 38 215
The bracketed values represent 95% confidence intervals for the probability estimates, located above the intervals, in the table. We omitted the toys product category from this table because our sample had only one toy advertisement during programs for a general audience. The “All Products” column, however, includes toy advertisement.
* Statistically different at the 95% confidence level from the estimated frequency of content during children’s advertisements.