doi: 10.3389/fsufs.2022.845420
Edited by:
Cristobal N. Aguilar, Universidad Autónoma de Coahuila, Mexico Reviewed by:
Štefan Bojnec, University of Primorska, Slovenia Débora A. Campos, Universidade Católica Portuguesa, Portugal Ricardo Gómez García, Catholic University of Portugal, Portugal Gilberto Aboites, Coahuila State University, Mexico
*Correspondence:
Manal Hamam manal.hamam@phd.unict.it József Tóth jozsef.toth@uni-corvinus.hu
Specialty section:
This article was submitted to Sustainable Food Processing, a section of the journal Frontiers in Sustainable Food Systems Received:29 December 2021 Accepted:20 January 2022 Published:21 February 2022 Citation:
Hamam M, D’Amico M, Zarbà C, Chinnici G and Tóth J (2022) Eco-Innovations Transition of Agri-food Enterprises Into a Circular Economy.
Front. Sustain. Food Syst. 6:845420.
doi: 10.3389/fsufs.2022.845420
Eco-Innovations Transition of
Agri-food Enterprises Into a Circular Economy
Manal Hamam1*, Mario D’Amico1, Carla Zarbà1, Gaetano Chinnici1and József Tóth2,3*
1Department of Agriculture, Food and Environment (Di3A), University of Catania, Catania, Italy,2Department of Agricultural Economics and Rural Development, Corvinus University of Budapest, Budapest, Hungary,3Faculty of Economics, Socio-Human Sciences and Engineering, Sapientia Hungarian University of Transylvania, Miercurea Ciuc, Romania
Eco-innovations that reduce the environmental effect of manufacturing and consumption are seen as critical components of sustainable development and a critical component of the transition to a circular economy. Food systems address the issue of food waste, which is generally acknowledged as a cost to the economy, the environment, and society. Eco-innovations seem to be critical for the food system’s transformation to a more circular model centered on sustainable food production and processing. The goal of this paper was to determine the variables that influenced the introduction of product, process, organizational, and marketing innovations in European Union agri-food enterprises between 2012 and 2014. According to a preliminary analysis of the data, 57.40% of agribusinesses did not implement any form of innovation, which prompted the authors to study the difficulties surrounding innovation development over the 3-year reference period. Several key factors emerge as significant influences on the introduction of product innovations (0.055∗∗); contractual requirements as significant influences on the introduction of process innovations (−0.081∗∗∗); and environmental incentives as significant influences on the introduction of marketing innovations (0.062∗∗∗).
Additionally, product (0.704∗∗∗) and process (1.051∗∗∗) innovations tend to have a greater influence on enterprises’ views of circular benefits. The investigation also demonstrates how enterprises and end users interpret the effect of various forms of innovation differently. Indeed, end users, in contrast to how enterprises understand it, believe that organizational (0.611∗∗∗) and marketing (0.916∗∗∗) innovations are critical in pursuing circular benefits.
Keywords: eco-innovation, circular economy, survey, agri-food, enterprises
INTRODUCTION
By 2030, the UN expects that the world’s population will demand at least 40% more water, 35%
more food, and 50% more energy. Additionally, it is anticipated that worldwide food consumption will grow by 70% by 2050 (FAO, 2009), global energy consumption will increase by 25% by 2040 and global freshwater demand will increase by about 55% by 2050 (IEA, 2018).
The circular economy (CE) and its principles have developed as a new paradigm in our pursuit of sustainability, presenting new chances for development and progress (Raworth, 2017; Vanham et al., 2019). A circular model, in fact, envisions the long-term use of biomass as products that are
processed, reused, and ultimately reintegrated into the biosphere as bioproducts at the end of their useful life.
However, the economy of the European Union remains mostly linear. According to the report (Eurostat, 2017), the EU’s circular material consumption rate was just 11.2% in 2017, and only 8.6% of the economy would be circular in 2020 (Circle Economy, 2020). The purpose of transitioning to a circular economy is to obtain environmental benefits (Taranic et al., 2016), which include cost savings and market expansion, both of which result in further economic benefits via employment creation. As numerous scholars have argued (Carrillo-Hermosilla et al., 2010; Kemp, 2010; de Jesus et al., 2018; Prieto-Sandoval et al., 2018), the primary impediment to this transition is the growing need for innovation, which includes not only research on new technologies but also clear guidance on their use, policy support for establishing appropriate regulatory frameworks, and providing the appropriate incentives for technology adoption.
The European Union has been in the forefront of environmental actions since the 1992 Rio de Janeiro Summit, enacting a range of laws and funding research projects. The introduction of a new word, “eco-innovation”, has rekindled interest in environmental sustainability. What becomes evident is that eco-innovation is considered as a source of technical progress that helps a business to expand economically and market share, maybe via “green” methods (Andersen, 2004;
Hellström, 2007; Carrillo-Hermosilla et al., 2009, 2010; Berkhout, 2011).
Recent articles have examined the European framework for member states’ innovative responses to the transition to a circular economy (Arbolino et al., 2022; Bîrgovan et al., 2022). Marino and Pariso (2020), for example, discovered that the 28 EU member states have adopted a diverse variety of solutions, with just a handful judged successful in resolving circular economy concerns across the EU, and Melece (2016) examined the situation and trends in the EU’s efforts to achieve green growth and a circular economy.
Agri-business is a big and fast-growing industry. In 2017, the EU bio-based industry earned e2.4 trillion in revenue in the EU-28, a 25% growth over 2008 (Porc et al., 2020).
The primary challenges confronting the food industry in producing sustainably need system-wide innovation, including a change in value creation logic and the development of new circular economy-compatible models (Bocken et al., 2014a; Moreno-Miranda and Dries, 2022). Transitioning to a circular and resource-efficient economy would need a systematic shift in production and consumption patterns, and eco-innovations will be critical in developing new technologies, processes, commodities, and services, as well as business models (EU). Additionally, the circular economy’s technological and organizational innovations would increase European resource productivity by 3% by 2030, resulting in 1.8 trillion in total benefits across three sectors: mobility, food, and the built environment, including cost savings on primary resources and costs associated with externalities such as the health effects of air pollution (Ellen MacArthur Foundation, 2013). On the other hand, major change, in addition to technological breakthroughs, needs considerable changes in
institutional and cultural norms and structures (Prosperi et al., 2020).
The goal of this research is to assess the innovation performance of European Union firms throughout the 3-year period 2012–2014. The information was gathered using the Community Innovation Survey (CIS), which is designed to quantify innovation in enterprises, contains data that can be compared across countries and over time, and is intended to provide information on the innovative capacity of sectors by type of enterprises, the various types of innovation, and various aspects of innovation development, such as goals, sources of information, government funding, and spending on innovation.
The study’s objective was to ascertain the most significant drivers of circular benefits for product, process, organizational, and marketing innovations, as well as the most significant drivers of circular benefits for enterprises and end users. Moreover, the authors’ objective was to demonstrate how the importance of the drivers differs significantly across the food, beverage, and tobacco sectors (FBT) and the whole sample of enterprises. The research questions are as follows:
• RQ1.Which factors influence product, process, organizational, and marketing innovations?
• RQ2.Which factors influence the circular benefits perceived by enterprises and end users?
• RQ3.Are there differences between food enterprises and the total sample of enterprises?
ECO-INNOVATION IN FOOD SECTOR Eco-Innovation and Circular Economy
The word “eco-innovation” is a colloquial term that refers to the synthesis of two concepts: sustainability and innovation.
According to a widely accepted definition, eco-innovation is “the production, assimilation, or exploitation of a new product, manufacturing process, service, management method, or business method by an organization that results in a reduction of environmental risk, pollution, or other negative impacts on the resources used” (Kemp and Pearson, 2008). Furthermore, it contributes to the creation of new solutions that benefit consumers and enterprises (Makara et al., 2016) considering economic, ecological, and social factors (Muscio et al., 2017;
Schiederig et al., 2021).
According toCarrillo-Hermosilla et al. (2009), eco-innovation may be tackled in three ways: as add-on solutions, end-of- pipe solutions, or hybrid solutions and is defined as the continuous improvement of technology with the goal of minimizing environmental impact. It may be assessed in terms of eco-efficiency (Kemp and Andersen, 2004; Hellström, 2007;
Jänicke, 2008; Franceschini and Pansera, 2015), regarded a paradigm shift due to the introduction of radical new technology and/or organizational solutions, as well as new production and consumption models, such as closed-loop and cradle-to- cradle systems.
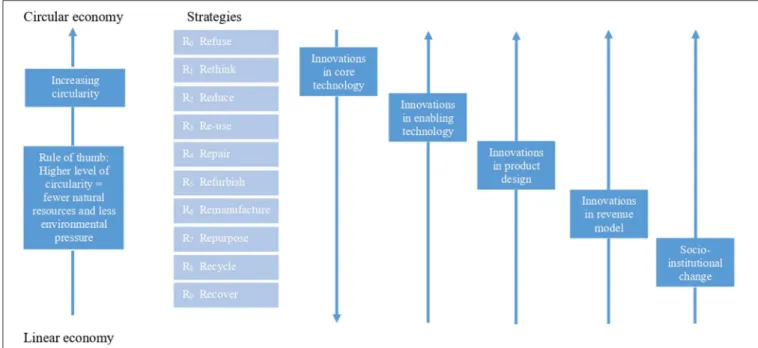
Eco-innovation is predicated, in fact, on a positive attitude toward technology’s ability to address environmental problems and on the development of a circular economy centered
on increasing production system efficiency (Figure 1) through input reduction, eco-design, improved practices, and waste reuse and recycling (Hopwood et al., 2005; Scoones, 2007;
The Ellen MacArthur Foundation, 2013; Kirchherr et al., 2017; Murray et al., 2017; Korhonen et al., 2018a,b; Borrello et al., 2020a) through not just environmental and social advantages, but also long-term resilience and new commercial and economic prospects.
According to this view, innovation has the potential to improve the sustainability and circularity of production processes (Frondel et al., 2007; Freeman and Soete, 2009; Pansera, 2012).
For this reason, the complementary between circular economy and innovation can address issues such as environmental degradation and pollution, climate change, soil erosion, and biodiversity loss through continuous improvements in the eco-efficiency of agri-food production systems and resource consumption. However, the relationship between eco-innovation and circular economy remains a mystery (de Jesus Pacheco et al., 2017; de Jesus and Mendonça, 2018).
Food Industry Eco-Innovation
The agri-food sector’s tremendous losses are a good ground for a of fresh ideas (Chinnici et al., 2019; Hamam et al., 2021). The pursuit of sustainable development objectives demands major changes in the existing economic model, as well as production and consumption systems, where the private sector playing an essential position in this process (El-Chichakli et al., 2016; Lieder and Rashid, 2016).
Eco-innovation has emerged as one of the most significant inventions for sustainable enterprises (Ryszko, 2016; Santos and Mendonça, 2017; de Jesus Pacheco et al., 2019; Khan and Johl, 2019; Salim et al., 2019), and its idea has been incorporated into EU rules to encourage eco-solutions (Buttol et al., 2012). Horizon 2020 is the European Union’s biggest research and innovation effort, sponsoring projects in waste prevention and management, food waste reduction, creative remanufacturing, sustainable industry, industrial symbiosis, and the bioeconomy (Deselnicu et al., 2018). It ties eco-innovation to the circular economy and underlines the necessity of eco- efficiency. Additionally, it invented the term “systemic”, which positioned the circular economy and systemic eco-innovation at the center of European eco-innovation discussions. A systemic approach may help to increase knowledge of how a particular issue emerges in a particular setting and how it might finally be handled or controlled.
Due to the perishability of food, new technologies have evolved that enable the extension of their shelf life and storage (Parfitt et al., 2010)via the use of creative storage techniques (van Holsteijn and Kemna, 2018). Additionally, new processing techniques have been developed to make a new product from food waste (Galanakis, 2012). This circular economy-based strategy enables goods to keep their worth for as long as possible (Smol et al., 2015).
The development of circular food economic actions has been sparked primarily by the adoption of new technologies and sustainable industrial processes, as well as improved logistics management, as well as increased investment in research
and development by enterprises, either individually or in collaboration (Staniškis et al., 2012). Therefore, organizations are implementing innovation into their operations at an increasing rate (Bossink, 2015).
Environmental considerations, which must be incorporated into company culture and business strategy across the design, production, distribution, and disposal processes, started to get more attention, therefore. Numerous technological advancements in agriculture are helped by scientific contributions (Muscio and Nardone, 2012).
Agribusinesses operate in a technological environment that encompasses a broad variety of technologies, including freezing and refrigeration, information and automation technologies, and new breakthroughs in drying, heat treatment, and controlled and modified atmosphere packaging (Welch and Mitchell, 2000).
Indeed, to create effective circular models (Ghisellini and Ulgiati, 2020), technology is critical in providing innovative tools to support businesses, radical solutions to prevent and manage food surpluses, moving up the food waste hierarchy, and avoiding raw material extraction (Nilsen, 2019), such as information technologies that facilitate food sharing and redistributionvia web platforms or apps (Harvey, 2019).
The intersection and interaction of the strategic orientations
“technology-push”, i.e., science and technology (push), and
“market-pull”, i.e., market recognition (pull), are widely used to characterize technological innovation (Di Stefano et al., 2012).
Food waste management solutions are often associated with both processing technologies, as they include the conversion of excess food into feed, fertilizer, or energy (Laufenberg et al., 2003;
Girotto et al., 2015; Arshadi et al., 2016), and the need for a collaboration among all actors in the value chain (Chen et al., 2017). Some examples in the literature (Chen and Yada, 2011;
Mercier et al., 2017) portray technological advances as obstacles in building an appropriate collaboration environment (Gellynck and Kühne, 2010).
Proactive eco-innovation has been defined by researchers (Kemp and Pearson, 2007; García-Granero et al., 2018) and research organizations (OECD, 2005) as having three key dimensions: product, process, and technology. According toEIO (2011), product eco-innovation is the introduction of new or significantly improved goods or services through eco-design concepts that contribute to corporate sustainability and the circular economy (Hu et al., 2019; Mazzoni, 2020) by considering the environmental, social, and economic impacts of the entire product life cycle and emphasizing resource efficiency while minimizing environmental impact (Ivascu, 2020).
Eco-innovation in processes is defined as the use of significant variations in methods, equipment, and software to create new or significantly upgraded production or delivery systems. Investing in environmentally friendly equipment and industrial processes are examples of technical eco-innovation.
According to Ryszko (2016), technological eco-innovations, while difficult to introduce, are crucial in providing information for inclusive material saving, credentialing, and statistics management initiatives.
Przychodzen and Przychodzen (2015),Marcon et al. (2017), Rodriguez and Wiengarten (2017), Rodríguez-García et al.
FIGURE 1 |Role of innovation in circular economy for production chains. Source: RLI 2015; edited by PBL Netherlands Environmental Assessment Agency, https://
www.pbl.nl/en/publications/circular-economy-measuring-innovation-in-product-chains.
(2019), and Johl and Toha (2021) have found that eco- innovation appears to be positively and strongly correlated with enterprises financial success, even of theSantos et al. (2019)study discovered that eco-innovation had a negative association with financial performance.
The eco-innovations are crucial in sustainable transitions at the macro, meso, and micro levels (Kirchherr et al., 2017; Pauliuk, 2018), not all of them contribute equally to the circular economy (Carrillo-Hermosilla et al., 2009; Franco, 2017; García-Granero et al., 2018).
Systemic or eco-efficient eco-innovations (Carrillo- Hermosilla et al., 2010; McDonough and Braungart, 2010) represent a break from established methods and business models and result in significant environmental improvements. They include the introduction of new goods and services, as well as the expansion of markets and clientele (Braungart, 2007;
Carrillo-Hermosilla et al., 2010). Additionally, they need close collaboration with consumers and intermediaries (Wagner and Llerena, 2011; de Jesus Pacheco et al., 2017) and make use of open-source trials (Mazzucato, 2018).
Radical eco-innovations seek competitive advantage via technical leadership, disrupt the status quo of corporate operations, and are tied to entrepreneurship (Hall and Lerner, 2010;Hansen and Grosse-Dunker, 2012). Experimentation has been identified as the most critical radical innovation capability for success since it enables organizations to overcome inertia.
According to radical eco-innovation, research, selection, and execution are the three components of all innovation activities (Leifer et al., 2000; Chang et al., 2012; Seebode et al., 2012; Bessant and Tidd, 2013; Bessant et al., 2014). Radical eco-innovations have, also, a negligible compatibility with pre-existing models.
By adopting a systemic view, it is possible to radically modify our perception of events by focusing on the dynamic complexity of situations in connection to the environmental elements that contribute to their production, expression, and nurturing.
Furthermore, due to their extended maturation spans and significant changes inside the company, long-term policies are especially well-suited to systemic and radical eco-innovations (Del Río et al., 2010). They usually demand considerable upfront expenditures that place significant financial strain on businesses, and they frequently need collaboration between the enterprise and important stakeholders. However,O’Connor and McDermott (2004)discovered that it takes at least 10 years to market and adapt unconventional ideas. Commercialization of revolutionary innovations with economic, social, and environmental benefits may take up to 10 years (Hanna et al., 2015). Environmental stewardship vs. continuous improvement eco-innovations, on the other hand, pursue operational efficiency, cost reduction, input cost reduction, and market leadership. This may include developing or implementing eco-innovations throughout time.
The role of end-users is considered important during the development of enterprise-level innovations (Borrello et al., 2017, 2020b). User-driven innovation is a process for creating a new product or service that relies heavily on an integrated analysis and understanding of users’ needs, wants, and preferences (Grunert et al., 2008). Research emphasizes the need to include the end user in driving innovation (Sijtsema et al., 2020). Reaching out to diverse groups and networks both inside and outside the enterprise through open innovation and partnerships, improved stage gate processes, new ways to innovate through crowd sourcing, and a deep understanding of business processes are
some of the most critical innovations for food product success (Moskowitz and Saguy, 2013). Design thinking (Olsen, 2015), which is an organized way of thinking used in design activities, looks to be useful to food innovation. It utilizes designer techniques to match consumer desires with what is technically feasible and financially viable (Brown, 2008).Lockwood (2010) defines design thinking as “a human-centered innovation process that emphasizes observation, collaboration, fast learning, idea visualization, rapid prototyping, and concurrent business analysis”. The tools and methods employed should target not just the rational consumer, but also the irrational motivations for their actions, such as the use of pictures or drawings to stimulate the imagination, and the use of projective techniques has been shown to be beneficial in this respect (Sijtsema et al., 2016).
Some authors identified different open innovation models that are connected to the concept of client co-creation (Bigliardi and Galati, 2013). Co-creation is often equated with cooperation. It is a collaborative, open, and creative process in which value is created amongst idea generators, people who have a common interest, end users, and other stakeholders (Filieri, 2013; Ehlen et al., 2017).
METHODOLOGY
Community Innovation Survey
The Community Innovation Surveys (CIS) are a series of surveys undertaken by national statistical offices across the European Union that serve as the major data source for measuring innovation in the EU. Standardized surveys, according to the Oslo Manual, are meant to collect data on the innovativeness of different companies and sectors. A NACE code (Nomenclature statistique des activités économiques dans la Communauté européenne) defines the statistical classification of economic activities in the European Union and is used to categorize each sector. The study is conducted on a business-to-business basis and provides data by country, innovator type, and economic activity.
The study covers innovation in products and processes, innovation activity and expenditure, innovation effects, innovation collaboration, public innovation research, and the source of information for innovation patents. Every 2 years, the EU, and some European Statistical System (ESS) member nations conduct surveys.
The poll is entirely voluntary, and different countries engage in it at different times of the year.
The CIS survey is intended to assess corporate innovation and offers comparable data across nations and across time. Its purpose is to give information on the inventive capability of sectors by company type; the many forms of innovation; and the various factors of innovation development, such as aims, sources of knowledge, public financing, and innovation expenditures.
Researchers get access to the resulting microdataviathe SAFE Center at Eurostat’s headquarters in Luxembourg.
Survey
Eurostat’s Safe Center (SC) in Luxembourg acquired the data using a standardized survey sent to enterprises around the
EU. Bulgaria, Cyprus, the Czech Republic, Germany, Estonia, Greece, Spain, Croatia, Hungary, Lithuania, Latvia, Norway, Portugal, Romania, and Slovakia are among the nations that provided information.
The survey version used was 13 dated July 23, 2014 (latest available), and it was aimed to gather data from companies during a 3-year period from 2012 to 2014. Most questions in CIS 2014, and hence most indicators, span the reference period 2012–2014, i.e., the three-year period from the start of 2012 to the end of 2014. The reference period for the indicators on innovation expenditures for product and process innovations is just 1 year, 2014. In Spain, for example, the number of enterprises involved in innovation activities was collected using just 2014 as a reference year. Other nations calculated these metrics over a three-year period. The survey is divided into 13 sections:
general company information; product and service innovation;
process innovation; ongoing or abandoned product or process innovation activities; product and process innovation activities and expenses; public financial support for innovation activities;
product and process innovation collaboration; non-innovators;
environmental innovation; and basic economic information about the enterprises; organizational innovation; marketing innovation; public sector contracts and innovation; intellectual property rights and licensing; non-innovators; environmentally beneficial innovation; and fundamental economic knowledge about the enterprise.
Data Analysis
The purpose of this research was to examine the factors that influence the circular benefits of enterprises innovation.
The sample included 98,809 observations, all of which were tied to enterprises classified as NACE coded industries. The authors sought to ascertain which factors significantly influenced enterprises and end-users’ views of the circular benefits of innovation adoption. The variables used are described inTable 1.
Moreover, esent variable represents the number of circular benefits by the enterprises about: decreased material or water consumption per unit of production, decreased energy consumption or CO2“footprint”, decreased air, water, noise, or soil pollution, substitution of a portion of materials with less polluting or hazardous materials, substitution of a portion of fossil energy with renewable energy sources, and recycling of waste, water, or materials for own use; and esuser variable that represents the number of circular benefits by the end users about:
reduced energy use or CO2“footprint”, reduced air, water, noise or soil pollution; and facilitated recycling of product after use.
Using a multivariate model, the drivers of circular benefits for product, process, organizational, and market changes were identified.
yˆ = β0+β1xenereg+β2xenetx+β3xenregf+β4xengra+β5xendem + β6xenrep+β7xenagr+β8xencost+β9xenrequ+ ε
A multivariate regression is also performed using esent and esuser as dependent variables. Following that, two ordered logit regressions were calculated to evaluate the relationship between the circular benefits provided by product, process, organizational,
TABLE 1 |Summary statistics and variable’s description.
Variables Description Item Mean Standard
deviation
ecomkt 0=no, 1=yes Marketing innovations 0.119 0.324
ecoprc 0=no, 1=yes Process innovations 0.432 0.495
ecoprd 0=no, 1=yes Product innovations 0.338 0.473
ecorg 0=no, 1=yes Organizational innovations 0.257 0.437
enagr 0=not significant, 1=low, 2=medium, 3=high Initiatives to promote good environmental practices 1.371 1.155 encost 0=not significant, 1=low, 2=medium, 3=high High cost of energy, water, or materials 1.592 1.213 endem 0=not significant, 1=low, 2=medium, 3=high Current or projected market demand for environmental innovations 1.067 1.091 enereg 0=not significant, 1=low, 2=medium, 3=high Existing environmental regulations 1.526 1.229 enetx 0=not significant, 1=low, 2=medium, 3=high Existing environmental taxes, fees, or charges 1.155 1.133 engra 0=not significant, 1=low, 2=medium, 3=high Government grants, subsidies, or other financial incentives for
environmental innovations
0.784 1.021
enregf 0=not significant, 1=low, 2=medium, 3=high Anticipated future environmental regulations or fees 1.195 1.129 enrep 0=not significant, 1=low, 2=medium, 3=high Enhancing the enterprises reputation 1.583 1.210 enrequ 0=not significant, 1=low, 2=medium, 3=high The requirement to comply with public procurement contract requirements 1.034 1.134
and marketing innovations and the benefits felt by enterprises and end users.
The logit regression formula is as follows:
log ( p y
1−p y) = β0+β1xecoprd+β2xecoprc+β3xecorg
+ β4xecomkt where p(y)
1−p(y) is the ratio of the probability that an event will occur (p(x)) to the probability that an event will not occur (1- p(x)). Values >1 indicate an increase in the occurrence of an event while values<1 indicate a decrease in the occurrence of an event.
In the ordered logit regression:
y=
0 ify∗ ≤ µ1, 1 ifµ1 < y∗ ≤ µ2, 2 ifµ2<y∗ ≤ µ3,
...
N ifµN < y∗
Additionally, the odds ratio was calculated to determine the strength of the association between the variables. It is as follows:
Odds ratio= px/(1−px) py/(1−py)
If the odds ratio is equal to 1, the variables are uncorrelated, i.e., regardless of the existence or absence of another variable, the likelihood of an event happening is always the same. When the value is more than 1, the variables are positively associated, and when the value is<1, the variables are negatively linked.
The same investigations were conducted on a smaller sample of 6,263 enterprises engaged in the production of food, beverages, and tobacco. It was hypothesized that there is a significant
TABLE 2 |Number of foods, beverages, and tobacco enterprises from EU countries that participated in the survey.
FBT ALL
Freq % Freq %
Bulgaria 1,531 24.45 14,255 14.43
Cyprus 0 0.00 1,346 1.36
Czech Republic 261 4.17 5,198 5.26
Germany 295 4.71 6,282 6.36
Estonia 0 0.00 176 1.78
Greece 0 0.00 2,507 2.54
Spain 2,043 32.62 30,333 30.70
Croatia 0 0.00 3,265 3.30
Hungary 704 11.24 6,817 6.90
Lithuania 0 0.00 2,421 2.45
Latvia 0 0.00 1,501 1.52
Norway 282 4.50 5,045 5.11
Portugal 428 6.83 7,083 7.17
Romania 586 9.36 8,206 8.30
Slovakia 133 2.12 279 2.82
Total 6,263 100.00 98,809 100.00
Source: EUROSTAT.
difference between the influence that drivers may have on the circular benefits experienced by enterprises and end users, and so the comparison between the two groups, namely the complete sample of enterprises and food enterprises, is interesting. The Table 2summarizes the number of enterprises from which data were obtained by country in food, beverage, and tobacco sectors, and total number of enterprises. All analyses were conducted using Stata 16.
TABLE 3 |Innovation frequencies and percentages of food, beverage, and tobacco enterprises in EU (2012–2014).
Innovation Freq. Percent
0 3,595 57.40
1 782 12.49
2 505 8.06
3 338 5.40
4 304 4.85
5 200 3.19
6 182 2.91
7 124 1.98
8 95 1.52
9 55 0.88
10 41 0.65
11 30 0.48
12 12 0.19
Total 6,263 100.00
Source: EUROSTAT.
RESULTS
The results reveal that the whole sample of enterprises and the sector of food, beverage, and tobacco enterprises provide significantly different outcomes. To begin, Table 2 provide an overview of the variations between countries and between the number of food industries and the overall sample of enterprises.
The most striking findings are to Spain and Bulgaria, which had the highest participation rates of 30.70 and 14.43%, respectively, while no food sector enterprises from Cyprus, Estonia, Greece, Croatia, Lithuania, or Latvia participated in the questionnaire. Slovakia, on the other hand, has a relatively low participation rate (2.82%) in comparison to the whole sample of enterprises, although practically all of them (2.12%) are in the food sector.
The Table 3 summarizes the number of innovations implemented by foods, beverage, and tobacco enterprises. The 12 types of innovation related to product, process, organizational and marketing are: introduction into the market a new or significantly improved good; introduction into the market a new or significantly improved service; introduction a new or significantly improved method of production; introduction a new or significantly improved logistic, delivery or distribution system;
improved supporting activities for process such as maintenance systems or operations for purchasing, accounting, or computing;
introduction of new business practices for organizing procedures;
introduction of new methods of organizing work responsibilities and decision making; introduction of new methods of organizing external relations; significant changes to the aesthetic design or packaging; introduction of new media or techniques for product promotion; introduction of new methods for product placement or sales channels; and introduction of new methods of pricing goods or services.
TABLE 4 |Multivariate regression parameters to determine the factors that contribute to the circular benefits of product innovations.
ecoprd FBT ALL
enereg Existing environmental regulations 0.029 0.022***
enetx Existing environmental taxes, fees, or charges −0.038 –0.058***
enregf Anticipated future environmental regulations or fees
0.025 0.023***
engra Incentives for environmental innovations 0.027 –0.020***
endem Market demand for environmental innovations 0.055** 0.115***
enrep Enhancing the enterprises reputation 0.051* 0.056***
enagr Initiatives to promote good environmental practices
−0.016 –0.022***
encost High cost of energy, water, or materials 0.001 −0.005 enrequ Procurement contract requirements −0.036 0.005
***,**,*Indicate significance at 0.01, 0.05, and 0.10 levels, respectively.
The results demonstrate how low the rate of innovation introduction inside enterprises is. Indeed, 57.40% of the total number of enterprises report that they have not implemented any kind of innovation, 12.25% report that they have implemented one, and just 8.06% report that they have implemented two innovations.
Rather than that, the following tables illustrate the elements that have driven the creation of circular-benefit innovations.
Indeed, as seen inTable 4, multivariate analysis reveals different results. Almost all factors have a significant effect on the circular benefits of product innovations for the whole sample of enterprises. Only the encost and enrequ variables are proven to be important, i.e., the high cost of electricity, water, or materials, and the obligation to satisfy criteria for public procurement contracts. For food enterprises, the outcome seems to be changing. Indeed, only the variables endem and enrep seem to influence the circular benefits associated with product innovations in food enterprises, i.e., existing or predicted market demand for environmental advances and boosting the enterprise’s reputation.
Table 5illustrates a similar case. Indeed, for the whole sample of enterprises, practically all factors have a significant effect on the circular benefits associated with process innovations.
Only the variables enregf and engra are not significant, i.e., anticipated future environmental laws or fees, as well as government grants, subsidies, and other financial incentives for environmental advances. In the case of food enterprises, only three variables appear to significantly influence the circular benefits of process innovations: engra, or government grants, subsidies, or other financial incentives for environmental innovations; encost, or the high cost of energy, water, or materials; and enrequ, or the requirement to comply with public procurement contract requirements.
Table 6demonstrates even more atypical outcomes. Indeed, whereas many factors seem to have a significant impact on the circular benefits associated with organizational innovations for the overall sample of enterprises, the circular benefits associated with organizational innovations appear to be unaffected by
TABLE 5 |Multivariate regression parameters to determine the factors that contribute to the circular benefits of process innovations.
ecoprc FBT ALL
enereg Existing environmental regulations 0.043 0.035***
enetx Existing environmental taxes, fees, or charges −0.036 –0.021***
enregf Anticipated future environmental regulations or fees 0.000 −0.001 engra Incentives for environmental innovations 0.061** 0.001 endem Market demand for environmental innovations −0.008 –0.018***
enrep Enhancing the enterprises reputation 0.023 0.071***
enagr Initiatives to promote good environmental practices 0.035 0.055***
encost High cost of energy, water, or materials 0.071** 0.053***
enrequ Procurement contract requirements –0.081*** –0.012**
***,**Indicate significance at 0.01 and 0.05 levels, respectively.
TABLE 6 |Multivariate regression parameters to determine the factors that contribute to the circular benefits of organizational innovations.
ecorg FBT ALL
enereg Existing environmental regulations 0.019 0.018***
enetx Existing environmental taxes, fees, or charges −0.031 −0.005 enregf Anticipated future environmental regulations or fees 0.008 0.014**
engra Incentives for environmental innovations 0.025 −0.001 endem Market demand for environmental innovations −0.014 −0.008 enrep Enhancing the enterprises reputation 0.020 0.033***
enagr Initiatives to promote good environmental practices 0.038 0.044***
encost High cost of energy, water, or materials 0.012 0.001 enrequ Procurement contract requirements 0.020 0.015***
***,**Indicate significance at 0.01 and 0.05 levels, respectively.
any factor in the food industry. On the other hand, for the total sample of enterprises, the variables enereg, i.e., existing environmental regulations, enregf, i.e., anticipated future environmental regulations or fees, enrep, i.e., enhancing the enterprise’s reputation, enagr, i.e., voluntary actions or initiatives for good environmental practices in the industry, and enrequ, i.e., the requirement to comply with public procurement contract requirements, are significant.
The findings in Table 7 seem to be comparable as well.
The circular benefits of marketing innovations are highly impacted by most parameters for the complete sample of enterprises. The variables enereg, which refers to present environmental rules, enregf, which refers to anticipated future environmental regulations or fees, and engra, which refers to additional financial incentives for environmental innovation, seem to have no effect. In contrast, the circular benefits of market innovations are greatly impacted in the food industry by factors such as engra, or additional financial incentives for environmental innovation, and enrequ, or the necessity to satisfy standards for public procurement contracts.
The Tables 8, 9 shows the aspects enterprises and end consumers regard to be crucial in achieving circular benefits.
Specifically,Table 8reveals that virtually all factors are deemed
TABLE 7 |Multivariate regression parameters to determine the factors that contribute to the circular benefits of market innovations.
ecomkt FBT ALL
enereg Existing environmental regulations −0.024 −0.004 enetx Existing environmental taxes, fees, or charges 0.009 0.011**
enregf Anticipated future environmental regulations or fees 0.010 −0.007 engra Incentives for environmental innovations 0.062*** 0.001 endem Market demand for environmental innovations −0.019 0.022***
enrep Enhancing the enterprises reputation 0.038 0.026***
enagr Initiatives to promote good environmental practices 0.002 0.009**
encost High cost of energy, water, or materials −0.010 –0.017***
enrequ Procurement contract requirements 0.050** 0.033***
***,**Indicate significance at 0.01 and 0.05 levels, respectively.
TABLE 8 |Multivariate regression parameters to discover enterprise drivers of circular benefits.
esent FBT ALL
enereg Existing environmental regulations 0.248** 0.204***
enetx Existing environmental taxes, fees, or charges −0.014 −0.010 enregf Anticipated future environmental regulations or fees 0.108 0.148***
engra Incentives for environmental innovations 0.006 –0.056***
endem Market demand for environmental innovations −0.024 0.083***
enrep Enhancing the enterprises reputation −0.113 0.117***
enagr Initiatives to promote good environmental practices 0.334*** 0.183***
encost High cost of energy, water, or materials 0.261*** 0.255***
enrequ Procurement contract requirements −0.015 0.040**
***,**Indicate significance at 0.01 and 0.05 levels, respectively.
TABLE 9 |Multivariate regression parameters to discover end-users drivers of circular benefits.
esuser FBT ALL
enereg Existing environmental regulations −0.074 0.059***
enetx Existing environmental taxes, fees, or charges 0.100 −0.023 enregf Anticipated future environmental regulations or fees 0.098 0.101***
engra Incentives for environmental innovations −0.008 –0.050***
endem Market demand for environmental innovations 0.041 0.154***
enrep Enhancing the enterprises reputation −0.028 0.085***
enagr Initiatives to promote good environmental practices 0.157** 0.050***
encost High cost of energy, water, or materials 0.019 0.013 enrequ Procurement contract requirements 0.125** 0.092***
***,**Indicate significance at 0.01 and 0.05 levels, respectively.
extremely important by companies for the complete sample of enterprises. Only the variable enetx seems to be insignificant, i.e., current environmental taxes, fees, or levies. For the food sector, on the other hand, the key factors are enereg, or current environmental legislation, enagr, or industry-wide voluntary efforts or initiatives to promote good environmental practices, and encost, or the high cost of energy, water, or materials.
TABLE 10 |Ordered logit regression parameters of the circular advantages of innovation for enterprises.
esent FBT ALL
Coeff. Odds ratio Coeff. Odds ratio
ecoprd Product innovations 0.704*** 2.021041 0.601*** 1.824345
ecoprc Process innovations 1.051*** 2.859831 1.123*** 3.074816
ecorg Organizational innovations 0.300 1.349318 0.876*** 2.40142
ecomkt Marketing innovations 0.270 1.30996 0.605*** 1.83186
***Indicate significance at 0.01 levels.
TABLE 11 |Ordered logit regression parameters of the circular advantages of innovation for end-users.
esent FBT ALL
Coeff. Odds ratio Coeff. Odds ratio
ecoprd Product innovations 0.449** 1.566029 1.034*** 2.81204
ecoprc Process innovations 0.417** 1.517333 0.463*** 1.588725
ecorg Organizational innovations 0.611*** 1.842405 0.683*** 1.980311
ecomkt Marketing innovations 0.916*** 2.500176 0.810*** 2.248971
***,**Indicate significance at 0.01 and 0.05 levels, respectively.
Table 9explains which characteristics are deemed significant by end customers when it comes to gaining circular benefits.
Indeed, the findings for the whole sample of enterprises are comparable. Unlike (Table 9), the encost variable is not substantial, i.e., the high cost of energy, water, or materials.
For food industries, on the other hand, the variables enereg, or existing environmental regulations, and encost, or the high cost of energy, water, or materials, are insignificant, whereas enrequ, or the requirement to comply with requirements for public procurement contracts, has a significant impact.
The results of the link between the circular benefits associated with product, process, organizational, and market innovations and the perceived benefits of enterprises and end users are shown.
Two ordered regression locations are shown inTables 10,11.
The Table 10 shows that ecorg and ecomkt variables do not seem to have a significant effect on the number of circular benefits gained by the enterprise. All other factors, on the other hand, are positively correlated with the number of circulating benefits generated by enterprises. The odds ratio results indicate that, in the food industry, product and process innovations have a greater influence on the number of circular benefits than organizational and marketing innovations, whereas in the total sample of enterprises, process and organizational innovations have a greater influence on the number of circular benefits. Thus, marketing innovations seem to be those that have the least impact on the quantity of circular benefits.
Table 11 shows that all factors are positively linked with the perceived circular benefits by end users. The odds ratio findings indicate that, in comparison to perceived benefits, marketing and organizational innovations have a bigger weight for food industries, but product and marketing innovations have a greater weight for the overall sample of enterprises. In
comparison to them, marketing innovations seem to have a stronger influence on the number of circular benefits accruing to end-users.
Because of the preceding tables, the food enterprises situation is distinct from that of the overall sample of enterprises. We may presume that there are underlying reasons why many of the criteria that are critical for attaining circular benefits in the whole sample of enterprises seem to have little effect on food enterprises pursuit of them. The next part will address possible explanations for why innovation inside a food industry is more difficult, attempting to explain why the move from a linear economy to a circular economy takes longer.
DISCUSSION
The findings provide a picture of the elements that drive innovation creation and which product, process, organizational, and marketing innovations have the greatest impact on the number of circular benefits seen by enterprises and end users.
Market demand for environmental innovations and the aim to enhance the company’s image were shown to be variables influencing the development of product innovations in food enterprises. In comparison, environmental innovations and contractual requirements have an impact on the development of marketing and process innovations, the latter of which are also impacted by high energy, water, and material prices. Additionally, it is discovered that process and product innovation have a significant influence on the number of circular benefits seen by enterprises, in comparison to organizational and marketing innovations, which seem to have a higher effect on end users.
Therefore, we may presume that our findings support what has previously been stated in the literature about the difficulties associated with implementing CE practices in the food industry.
Indeed, various studies demonstrate that bio-based products continue to face technological and operational impediments (Gatto and Re, 2021), making access to product and process innovations inside food enterprises challenging. Several barriers include: high investment costs (Unay-Gailhard and Bojnec, 2016;
Jaeger and Upadhyay, 2020); lack of appropriate technology (Borrello et al., 2016; Clark et al., 2019; Farooque et al., 2019;
Sharma et al., 2019; Gedam et al., 2021); lack of financial and government support (Rizos et al., 2015; Urbinati et al., 2017;
Kirchherr et al., 2018; Mangla et al., 2018; Ranta et al., 2018;
Farooque et al., 2019; Sharma et al., 2019); administrative burdens (Rizos et al., 2015); inadequate information management systems (Romero and Molina, 2011; Rizos et al., 2015); social barriers related to lack of interest and awareness by enterprises and customers (Kirchherr et al., 2018; Singh and Giacosa, 2019;
Singh et al., 2021); lack of qualified personnel (de Jesus and Mendonça, 2018; Korhonen et al., 2018a,b; Stewart and Niero, 2018; Guldmann and Huulgaard, 2020); lack of support from top management, lack of circular design (Lahane et al., 2020); lack of network support (Jabbour et al., 2020; Jaeger and Upadhyay, 2020; Chhimwal et al., 2021); lack of know-how (Farooque et al., 2019; Sharma et al., 2019; Unay-Gailhard and Bojnec, 2021);
lack of reverse logistics management (Borrello et al., 2016; Clark et al., 2019; Gedam et al., 2021); lack of cross-sectoral cooperation (Rizos et al., 2016; Farooque et al., 2019; Sharma et al., 2019;
Jaeger and Upadhyay, 2020); low investor confidence in high- risk models; processing inefficiencies; and lack of markets to use energy and byproducts (De Clercq et al., 2016; Nghiem et al., 2017; Armington et al., 2018; Hegde et al., 2018; Lahane et al., 2020).
It is important to stress that eco-innovation and transformational innovation both contribute to the reduction of obstacles to the circular economy’s implementation (de Jesus and Mendonça, 2018) through the innovativeness of business models (Magretta, 2002; Osterwalder et al., 2005; Richardson, 2005;Borrello et al., 2017; De Cleene and Bora, 2020; Cembalo et al., 2021). Indeed, the literature has already concentrated on the investigation of acceptable approaches and instruments to assist enterprises in innovation in recent years (Bocken et al., 2019; Pieroni et al., 2019; Rosa et al., 2019). However, developing eco-innovations takes a range of timescales, depending on the kind of barrier and the modifications to current manufacturing processes required (Kiefer et al., 2019), as well as the creation of a diverse set of tools adaptable to various sizes and organizations (Whalen, 2017; Pigosso et al., 2018; Werning and Spinler, 2020).
The innovation needs “structure and direction to define and concentrate thought” (Eppler and Hoffmann, 2011) and may take place in one of two modes: the creation of an altogether new business model or the reconfiguration of current business model aspects (Zott and Amit, 2010). This process include testing and assessing several models that are suited for the goal model and involves changes inside the business, facilitated by the engagement of internal and external stakeholders (Bocken et al., 2018). Services are also seen as crucial in assisting with business model innovation, as well as product and process development (Pelli et al., 2017). Despite the growing body of literature on sustainable business model innovation in recent years (Bocken et al., 2013, 2014b; Boons and Lüdeke-Freund, 2013; Bocken
and Short, 2016; Schaltegger et al., 2016a,b; Evans et al., 2017;
Yang et al., 2017), there is still a dearth of studies identifying gaps in current industry practices for slowing and closing material cycles. Additionally, the adoption of novel circular business models involves the establishment of robust networks that are formed by interdependent but autonomous stakeholder cooperation, communication, and coordination (Antikainen and Valkokari, 2016; Oghazi and Mostaghel, 2018). Indeed, developing innovative sustainable business models requires the involvement of inter-organizational networks, which include not only enterprises but also broader social systems, to establish mutually reinforcing dynamics among firms that promote novel value creation methodologies and the ability to overcome significant barriers (Lovins et al., 2007; Johnson and Lafley, 2010;
Rotmans and Loorbach, 2010; Boons and Lüdeke-Freund, 2013).
POTENTIAL APPLICATIONS AND FUTURE CASE PROSPECTS
The development of innovations that combine agriculture with biotechnology enables the production of high potential bioproducts such as enzymes, organic acids, bioethanol, and biopesticides, as well as energy generation. Indeed, the management of agroindustrial waste and its practical application are critical to the circular economy’s development (Leong et al., 2021; Lachos-Perez et al., 2022; Yaashikaa et al., 2022).
However, to determine the process’s overall commercial feasibility, it is necessary to undertake a techno-economic factor analysis (Chilakamarry et al., 2022).
Science and technology research serves as the impetus for radical eco-innovations, and thus encouraging science and technology research in universities and public research centers, as well as facilitating science and technology exchanges through public-private partnerships, would aid in the promotion of these eco-innovations.
To accomplish this, it is necessary to expand academic capacity, technological and manufacturing capabilities, and to implement public policies that promote these activities, as well as to increase public and private funding that will enable the development of this significant biotechnological and economic potential, which will contribute to the Sustainable Development Goals’ achievement.
Economic and regulatory policymakers must ensure that these businesses receive additional support. In terms of business recommendations, including end users in the co-creation process might be seen as a necessary component of producing a product that fulfills consumer expectations. Their interest in organizational and marketing innovations is critical when introducing new goods, as it enables them to develop a successful and efficient product.
Transitioning to CE will require overcoming insurmountable hurdles to innovation that would exist in the absence of system- wide innovation. This demonstrates that businesses have had to acquire knowledge and amass data to enhance their operations, obtain a better understanding of the manufacturing process, and identify growth prospects, eventually leading in more circular, sustainable, and efficient processes.
CONCLUSIONS
The article’s objective was to demonstrate how a lack of financial and political backing has hampered the adoption of new products and processes.
Economic and regulatory considerations are prioritized.
Indeed, the high costs of establishing a new technique or product, as well as regulatory constraints, are substantial hurdles.
Additionally, the investigation demonstrates how enterprises and end users interpret the effect of various forms of innovation differently. End users’ increased focus on organizational and marketing innovations enables enterprises to use them when including customers in the creation of new products and services.
Indeed, the food market’s potential forces businesses to adapt scientific findings to satisfy consumer wants, and in many cases, food firms must collaborate with research institutes to make these discoveries a reality. Collaboration between academia and industry significantly boosts the possibility of product innovation and success in the food sector (Cabral and Traill, 2001; Steward-Knox and Mitchell, 2003; D’Alessio and Maietta, 2008).
LIMITATION
Constraints include the fact that the data used in this study are out of date. Therefore, it is believed that progress in enhancing food sector innovations has occurred in the years after data gathering began. As a result, the study should be updated with current data to appropriately analyze and compare enterprises’
innovation across time. Additionally, it would be interesting to repeat the research by nation and evaluate the creative progress and challenges specific to that country.
DATA AVAILABILITY STATEMENT
The original contributions presented in the study are included in the article/supplementary material, further inquiries can be directed to the corresponding author/s.
AUTHOR CONTRIBUTIONS
MH: conceptualization, data curation, writing-original draft preparation, and writing-review and editing. MD’A: writing- review and editing, supervision, and project administration and funding acquisition. CZ: writing-original draft preparation and writing-review and editing. GC: writing-original draft preparation, writing-review and editing, and supervision. JT:
conceptualization and designed of the study, carried out the modeling, writing-review and editing, and supervision and funding acquisition. All authors contributed to the article and approved the submitted version.
FUNDING
This research received a grant from the Project PRIN DRASTIC Driving The Italian Agri-Food System Into a Circular Economy Model, PRIN-MIUR (2017 JYRZFF), funded by the Italian Ministry of Education, University and Research (MIUR), and the project Sostenibilità economica, ambientale e sociale del sistema agroalimentare del mediterraneo, funded by PIAno di inCEntivi per la RIcerca di Ateneo (PIACERI) UNICT 2020/22 line 2, UPB: 5A722192154, University of Catania. This research was also funded by National Research, Development and Innovation Office (NKFI), Hungary, Grant Number OTKA- 120563.
REFERENCES
Andersen, M. M. (2004). “An innovation system approach to eco-innovation- Aligning policy rationales,” inThe Greening of Policies-Interlinkages and Policy Integration Conference(Berlin), 1–28.
Antikainen, M., and Valkokari, K. (2016). A framework for sustainable circular business model innovation. Technol. Innov. Manag. Rev. 6, 5–12.
doi: 10.22215/timreview/1000
Arbolino, R., Boffardi, R., Ioppolo, G., Lantz, T. L., and Rosa, P. (2022).
Evaluating industrial sustainability in OECD countries: a cross-country comparison. J. Clean. Prod. 331, 129773. doi: 10.1016/j.jclepro.2021.
129773
Armington, W. R., Chen, R. B., and Babbitt, C. W. (2018). Challenges and innovations in food waste-to-energy management and logistics.Sustain. Food Waste Energy Syst.259–271. doi: 10.1016/B978-0-12-811157-4.00013-9 Arshadi, M., Attard, T. M., Lukasik, R. M., Brncic, M., da Costa Lopes, A. M., Finell,
M., et al. (2016). Pre-treatment and extraction techniques for recovery of added value compounds from wastes throughout the agri-food chain.Green Chem. 18, 6160–6204. doi: 10.1039/C6GC01389A
Berkhout, F. (2011). Eco-innovation: reflections on an evolving research agenda.
Int. J. Technol. Policy Manag. 11, 191–197. doi: 10.1504/IJTPM.2011.042079 Bessant, J., Öberg, C., and Trifilova, A. (2014). Framing problems
in radical innovation. Ind. Mark. Manag. 43, 1284–1292.
doi: 10.1016/j.indmarman.2014.09.003
Bessant, J., and Tidd, J. (2013).Managing Innovation: Integrating Technological, Market and Organizational Change. Hoboken, NJ: Wiley.
Bigliardi, B., and Galati, F. (2013). Models of adoption of open innovation within the food industry. Trends Food Sci. Technol. 30, 16–26.
doi: 10.1016/j.tifs.2012.11.001
Bîrgovan, A. L., Vatca, S. D., Bacali, L., Szilagyi, A., Lakatos, E. S., Cioca, L.
I., et al. (2022). Enabling the circular economy transition in organizations:
a moderated mediation model.Int. J. Environ. Res. Public Health19, 677.
doi: 10.3390/ijerph19020677
Bocken, N. M. P., Farracho, M., Bosworth, R., and Kemp, R. (2014a). The front- end of eco-innovation for eco-innovative small and medium sized companies.
J. Eng. Technol. Manag. 31, 43–57. doi: 10.1016/j.jengtecman.2013.10.004 Bocken, N. M. P., Schuit, C. S., and Kraaijenhagen, C. (2018). Experimenting with
a circular business model: lessons from eight cases.Environ. Innov. Soc. Transit.
28, 79–95. doi: 10.1016/j.eist.2018.02.001
Bocken, N. M. P., Short, S., Rana, P., and Evans, S. (2013). A value mapping tool for sustainable business modelling.Corp. Govern.13, 482–497.
doi: 10.1108/CG-06-2013-0078
Bocken, N. M. P., and Short, S. W. (2016). Towards a sufficiency-driven business model: experiences and opportunities.Environ. Innov. Soc. Transit.18, 41–61.
doi: 10.1016/j.eist.2015.07.010
Bocken, N. M. P., Short, S. W., Rana, P., and Evans, S. (2014b). A literature and practice review to develop sustainable business model archetypes. J. Clean. Prod. 65, 42–56. doi: 10.1016/j.jclepro.2013.
11.039
Bocken, N. M. P., Strupeit, L., Whalen, K., and Nußholz, J. (2019). A review and evaluation of circular business model innovation tools.Sustainability11, 2210.
doi: 10.3390/su11082210