Article
Agri-Food Export Competitiveness of the ASEAN Countries
Tamás Mizik * ,Ákos Szerletics and Attila Jámbor
Department of Agribusiness, Corvinus University of Budapest, F˝ovám tér 8, 1093 Budapest, Hungary;
akos.szerletics@stud.uni-corvinus.hu (Á.S.); attila.jambor@uni-corvinus.hu (A.J.)
* Correspondence: tamas.mizik@uni-corvinus.hu
Received: 25 October 2020; Accepted: 23 November 2020; Published: 25 November 2020
Abstract: Agri-food trade competitiveness analyses are relatively understudied in the empirical literature with many countries/regions missing. The novelty of this paper to analyze the agri-food export competitiveness patterns of the Association of Southeast Asian Nations (ASEAN), thereby aiming to fill this gap in the literature. Our research questions include which countries and products are competitive in the ASEAN region in agri-food trade; whether raw materials or processed products are more competitive; whether regional or global agri-food trade is more competitive and how persistent competitiveness is in the long run. The paper is based on ASEAN–ASEAN and ASEAN–world agri-food trade flows from 2010 to 2018, thereby global and regional competitiveness patterns have become visible. Results suggest that Myanmar (18.88), Laos (8.21) and the Philippines (5.36) have the highest levels of agri-food trade competitiveness in the world market, while in regional markets, Laos (17.17), Cambodia (15.46) and Myanmar (12.39) were the most competitive. Both raw materials, as well as processed products, are generally competitive, and regional trade, in general, was more competitive than global trade for the majority of the countries. However, results suggest a generally decreasing trend in keeping these competitive positions, which is also supported by the duration tests. Survival chances of 98% at the beginning of the period fell to 0–25% by the end of the period, significant at all levels, suggesting that a generally fierce competition exists for ASEAN countries in global as well as regional agri-food trade.
Keywords: ASEAN; agri-food trade; competitiveness; revealed comparative advantage
1. Introduction
Competitiveness is one of the most used words in international economics and there has been considerable research towards improving the understanding of competitiveness in economics.
One of the most well-known strands of the literature combines international trade theories with competitiveness, supported by Balassa’s [1] famous index of revealed comparative advantages.
Since this seminal work, a vast amount of literature is dedicated to the analyses of revealed comparative advantages of global trade (see, e.g., [2–4]).
Agri-food sectors are usually neglected in empirical works, however, despite the importance of the topic. This paper aims to analyze agri-food trade competitiveness of the ASEAN (Association of Southeast Asian Nations) countries—a region which is neglected in respective empirical works.
The ASEAN region was established some 60 years ago for political and security reasons and now forms a solid economic bloc with a combined GDP of USD 3 trillion, a relatively high share of agriculture in their GDP (11.3% in 2010–2018) and an expanding market for agri-food products based on changing global and regional trade patterns. The traditional share of the USA in ASEAN’s trade profile has been decreasing recently with increasing shares of regional, intra-ASEAN trade, in line with the emergence
Sustainability2020,12, 9860; doi:10.3390/su12239860 www.mdpi.com/journal/sustainability
and increased importance of regional trade agreements. Consequently, the region seems a perfect choice for analyzing competitiveness patterns in global as well as in regional agri-food trade ([5]).
The paper contributes to the existing literature of global agri-food trade competitiveness in three ways. First, it applies the theory of revealed comparative advantages on the ASEAN region where similar research has not been conducted so far. Second, it analyzes the ASEAN region from a development economics perspective, thereby highlighting trade-based development aspects. Third, the paper identifies products and product groups having competitive positions and thereby offers policy implications for regional decision makers.
The paper is structured as follows. First, theoretical background and a literature review are provided to set the scene. Second, the description of methods and data used is presented, followed by the main characteristics of the ASEAN agriculture and agri-food trade. The third part of the paper analyzes the comparative advantages of ASEAN agri-food trade together with their stability and duration. The final part concludes.
2. Theoretical Background
Theoretically, the concept of competitiveness is inseparable from international trade theories.
According to Adam Smith [6], countries trade with each other based on their absolute advantages—countries produce a product in which they have an absolute advantage and will exchange it for products in which they do not possess such advantage. In other words, countries export goods for which they use fewer inputs in production, and import goods that others can produce using fewer inputs, reflecting absolute differences in labor productivity.
This concept was developed by Ricardo [7], arguing that not absolute but comparative advantages are responsible for international trade between nations. In the Ricardian model, production technology differences are the basis of comparative advantage and therefore production and trade are driven by the most effective use of resources. According to Ricardo [7], countries should specialize in those products where they have a comparative advantage in, though technological superiority (high labor productivity) does not guarantee competitiveness.
Neoclassical economic theories go further and suggest that the source of comparative advantage is not technology but different resource endowments ([8,9]). Technologies are assumed to be the same across countries, as neoclassical theories propose, and comparative advantage is due to differences in factor endowments. Consequently, countries should specialize in the production of goods in which they use factors where they are relatively well endowed. As a consequence, capital-rich countries export capital-intensive products while labor-rich countries export labor-intensive products. As to other neoclassical economic models, the Rybczynski theorem states that at constant relative prices of goods, a rise in the endowment of one factor leads to a more than proportional expansion of the output using that factor intensively, and an absolute decline in case of the other good ([10]).
While the theory of comparative advantages was widely accepted for more than a century, two observations made serious challenges to the concept. On one hand, new trade theories emerged, suggesting that countries with similar factor endowments trade with each other. On the other hand, it was also observed that countries lacking natural resources are still able to have exceptional performance in international trade. These observations gave birth to a new concept of competitive advantages ([11]).
Overall, comparative advantages are based on labor and capital differences and are considered as a microeconomic concept with a focus on industry-specific trade. However, various other factors like institutions or a macroeconomic environment determine the competitiveness of a nation so competitive advantage is based on comparative advantage, but many other factors are needed for a nation to become competitive ([11]).
3. Literature Review
A relatively small and limited amount of literature is dedicated to the analysis of comparative advantages of agricultural and food products. Most studies were written on developed countries, especially Europe, and their respective positions, while the number of studies on developing countries are highly limited. Several conclusions were reached by these studies.
First, it becomes evident that the majority of the European countries had a revealed comparative advantage in some products or product groups in international markets. Most competitive countries turned out to be the more productive ones, according to most of the studies, suggesting that productivity and comparative advantages are positively related to each other ([12–14]).
Second, according to many studies, processed agri-food products have higher comparative advantages than agri-food raw materials. Many studies have highlighted that processed products are more competitive than raw materials, implying that more value added results in higher comparative advantages ([12,15,16]). Third, recent literature argues that revealed comparative advantages are higher for regional trade and lower for global trade, emphasizing the increased role of regional trade agreements, also supported by gravity analysis. It seems that the share of regional agri-food trade has increased globally, also implying increased integration patterns ([17,18]). However, at the other end, trade restrictions were generally found to deteriorate comparative advantages ([19]).
Fourth, it also turns out from the literature that the stability, as well as the duration of revealed comparative advantages, is limited, suggesting continuously changing positions on world markets ([20,21]). It seems evident that a country cannot be competitive in international trade with the same structure of agri-food products like it had many years ago—the market is changing fast. The survival chances of revealed comparative advantages are therefore low in the long run, also supported by the large costs for agri-food trade ([16,20]). However, some studies also highlight that biggest exporters could retain their competitive positions in their traditional agri-food markets ([21–23]).
On the whole, based on the context above, this paper analyzes the competitiveness of ASEAN agri-food trade and the novelty of the paper is to apply existing theories and methods to a region neglected in associated empirical works. More explicitly, it aims to answer the following research questions:
1. Which ASEAN countries are the most competitive in agri-food trade and with which products?
2. Are most competitive products pertain to raw materials or processed products?
3. How competitiveness patterns change if ASEAN countries trade globally or regionally?
4. How persistent are ASEAN countries’ competitiveness in agri-food products?
4. Materials and Methods
Based on the theoretical background, there are many approaches and ways to measure competitiveness. However, in order to answer the questions above, the paper was based and focused on Balassa’s measurement of revealed comparative trade advantage (RCA) that uses the concept of the Ricardian trade theory [1]. Balassa’s original index has the following form:
Bij = RCAij, = Xij Xit
! / Xnj
Xnt
!
where X is exports, i represents a given country, j represents a given product, t is a group of products andnis a group of countries. This group of countries is normally the world, however, the ASEAN country group as a reference group was used, as well for further comparisons. The basic idea behind the index is that a given country’s export share of its total exports divided by the export share in total exports of a reference group of countries indicates comparative advantage or disadvantage depending on the value of B. Having a value above 1 reveals a comparative advantage over the reference countries, while values below 1 point to revealed comparative disadvantage. RCA does not only interpret the sectoral or country-level results but is also a powerful tool for making descriptive trade statistics [24].
Moreover, this can be a useful instrument of revealing comparative advantages and forecasting its changes under e.g., market changes [25].
However, the Balassa index is not perfect. It can be criticized for many reasons, such as its asymmetric value, which extends from 0 to 1 for comparative disadvantage but from 1 to infinity for comparative advantage. One solution to this problem is normalizing RCA values, but even the different specifications are highly correlated [1]. The RCA index does not take into account the different impacts of agricultural policies, although they may significantly distort trade structure (e.g., state interventions or trade restrictions). That is the reason why exports data are used, as these potential effects are smaller than in the case of imports. Using a longer time series is a generally used tool against this possible distortion.
The duration of the RCA index was also estimated by using survival function S(t) by using the nonparametric Kaplan–Meier product limit estimator, which pertains to the product level distribution analysis of the Balassa index. Following Bojnec and Fert˝o [26], a sample containsnindependent observations (ti; ci), where i=1→n, ti is the survival time, and ci is the censoring indicator variable.
This is a dummy type of variable with a value of 1 if a failure occurred, e.g., there is no longer revealed comparative advantage, and 0 otherwise. The number of failures is lower than the number of data (m<n). The rank-ordered survival times were denoted as t(1)<t(2)<. . . <t(m). The Kaplan–Meier estimator of the survival function, assuming that ˆS(t)=1 if t<t(1), has the following form:
ˆS(t) = Π
t(i)<t
nj−dj
nj
where njindicate the risk of failure and djdenote the number of observed failures at tjtime.
First, a single survival function was estimated by pooling across all products and years and then country-level results were presented. Besides giving a detailed review of the mathematical specifications of the survival tests, Besedes and Prusa [27] obtained that the survival of export relationships is a precondition for trade expansion and export growth. Cleves et al. [28] carried out an even more detailed description of survival tests and proved that survival tests have several assumptions such as the lack of independence or censored values. Like our work, they used Stata for the necessary calculations. Moreover, these works provided an insight into the Wilcoxon and log-rank tests, which were used in this article as well.
This paper used ASEAN agri-food trade data from the World Bank’s World Integrated Trade Solution (WITS) database at HS-6 level between 2010 and 2018 on agri-food products (chapters 1–24, see AppendixAfor the names of the product categories). Results were grouped into three-year averages in order to soften the impact of the outlier (too high or too low compared to the neighboring years) values. Monetary data were denoted in US dollar at current prices. Although current US dollar prices include inflation, as well as the impacts of national exchange rate changes, WITS database provides only this type of data. Moreover, these data are commonly used by all the literature cited above.
The analyzed countries were Brunei, Cambodia, Indonesia, Lao People’s Democratic Republic (PDR), Malaysia, Myanmar, Philippines, Singapore, Thailand and Vietnam. The initial year was in accordance with the Laos’ and Myanmar’s dataset that starts from 2010, while 2018 was the latest available year at this moment with data for all the analyzed countries. The paper employed only the export component of the revealed comparative advantage index (B or RCA index) because different agricultural policies had less influence on them as RCA excludes imports, which are more likely to be influenced by policy interventions. The phasing out of export subsidies was another reason to choose the RCA index.
5. ASEAN Agriculture and Agri-Food Trade Patterns
The fundamental production factor of the sector is agricultural land. Not only its absolute size is important but also the share of agricultural, as well as arable land within. Table1provides an overview of the region.
Table 1. Land endowment in the Association of Southeast Asian Nations (ASEAN) countries, 2010 and 2018.
Country
Land Area
(1000 ha) Share of Agricultural Land (%) Share of Arable Land within Agricultural Land (%)
2010 2018 2010 2018 2010 2018
Brunei 527 527 2.54 2.73 29.85 34.72
Cambodia 17,652 17,652 30.90 31.53 69.66 70.27
Indonesia 181,157 187,752 30.69 33.18 42.45 42.22
Laos 23,080 23,080 9.62 10.37 63.06 64.75
Malaysia 32,855 32,855 22.49 26.09 11.56 9.64
Myanmar 65,326 65,279 19.17 19.74 86.31 85.97
Philippines 29,817 29,817 40.58 41.72 43.80 44.94
Singapore 70.2 71 1.05 0.93 86.49 84.85
Thailand 51,089 51,089 41.22 43.28 74.83 76.03
Vietnam 31,007 31,007 34.70 39.25 59.83 57.43
Source: authors’ composition based on [29] data.
Indonesia is the largest country of the region, followed by Myanmar and Thailand. The highest shares of agricultural land can be found in Thailand, Philippines and Vietnam, while the share of arable land is particularly high in Myanmar, Singapore and Thailand. However, the Cambodian 70.27% share can also be considered high. Based on these calculations and the associated literature cited above ([12–14]), one can hypothesize that these countries will have the highest comparative advantages among the ASEAN countries.
Compared from 2010 to 2018, there were no significant changes in these values. The share of agricultural land has slightly increased except for Singapore. The share of arable land has also increased in most of the countries in the analyzed years. Beside Singapore again, the other exceptions are Indonesia, Malaysia, Myanmar and Vietnam.
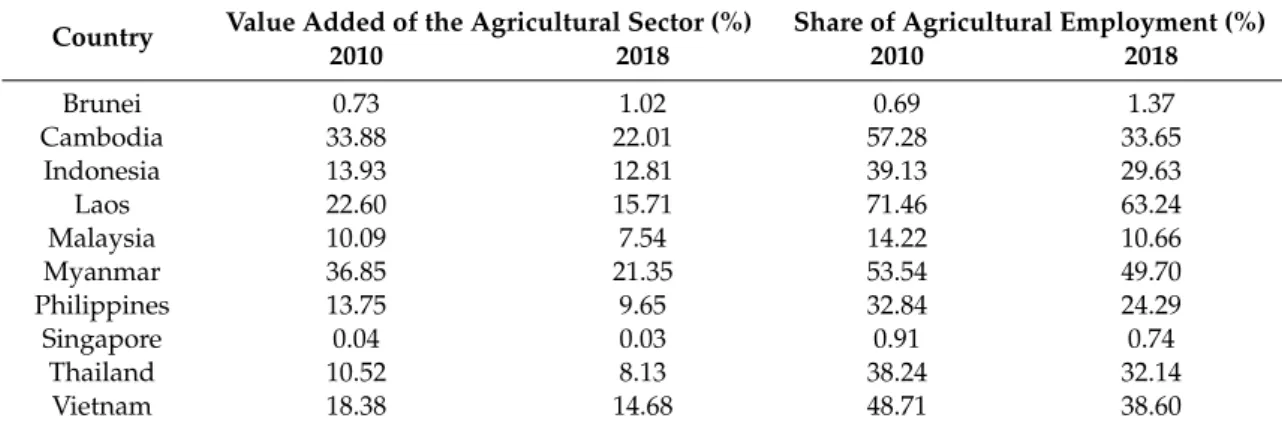
In order to measure the relevance of agriculture, two indicators were used: value added as a share of GDP (%) and the share of agricultural employment (%). Table2gives an overview of these indicators and their changes from the initial to the last years of the analyzed period.
Table 2.Agricultural value added and agricultural employment in the ASEAN countries, 2010 and 2018.
Country Value Added of the Agricultural Sector (%) Share of Agricultural Employment (%)
2010 2018 2010 2018
Brunei 0.73 1.02 0.69 1.37
Cambodia 33.88 22.01 57.28 33.65
Indonesia 13.93 12.81 39.13 29.63
Laos 22.60 15.71 71.46 63.24
Malaysia 10.09 7.54 14.22 10.66
Myanmar 36.85 21.35 53.54 49.70
Philippines 13.75 9.65 32.84 24.29
Singapore 0.04 0.03 0.91 0.74
Thailand 10.52 8.13 38.24 32.14
Vietnam 18.38 14.68 48.71 38.60
Source: authors’ composition based on [30] data.
It is evident from Table2that agriculture still plays an important role among the ASEAN countries, although both agricultural value added and employment decreased significantly in the last 9 years.
This importance is especially true for Myanmar where it is reflected in the high share of agricultural value added in GDP as well as the high share of employment (21.35% and 49.70%, respectively). At the other end, Singapore agriculture represents only 0.03% of GDP and 0.74% of employment. The case of Laos should also be highlighted here, where agriculture is the largest employer of the economy with 63.24% share, though it contributes to the national GDP only by 15.71%, implying serious efficiency problems. The analysis of agri-food trade competitiveness is especially valid in these countries with
relatively high shares of agriculture in the national economy compared to that of developed countries.
Based on the literature above, one may expect more competitive positions for those countries having higher shares of agriculture in their economy ([12,14]).
The role of agriculture can also be measured by its share in total exports. It is evident from Table3 that agriculture gives the most significant share in total exports in Myanmar (34.86% in 2016–2018), followed by Laos (28.32%) and Indonesia (27.14%). In other words, more than a third, or almost a third of export revenue came from agriculture in these countries, respectively. Besides, agri-food exports show an increasing trend in Laos, Indonesia and Thailand. On the other hand, agri-food exports gave an insignificant part of total exports in Brunei. The case of Singapore is remarkable—although the country has almost no agricultural land, this sector gives 17–20% of total exports. This is a clear sign of an efficient processing sector. This may lead Singapore to have higher comparative advantages in agri-food processed products trade both globally and regionally based on the associated literature ([15,16]).
Table 3.Share of agri-food exports in total merchandise exports in the ASEAN countries, 2010–2018.
Country 2010–2012 2013–2015 2016–2018
Brunei 0.05% 0.24% 0.17%
Cambodia 5.63% 8.47% 7.06%
Indonesia 23.54% 25.05% 27.14%
Laos 22.93% 24.37% 28.32%
Malaysia 15.55% 12.91% 12.24%
Myanmar 41.23% 34.65% 34.68%
Philippines 9.76% 10.50% 9.67%
Singapore 19.47% 17.61% 17.58%
Thailand 2.38% 3.00% 3.59%
Vietnam 21.55% 16.66% 13.11%
Source: authors’ composition based on [30] data.
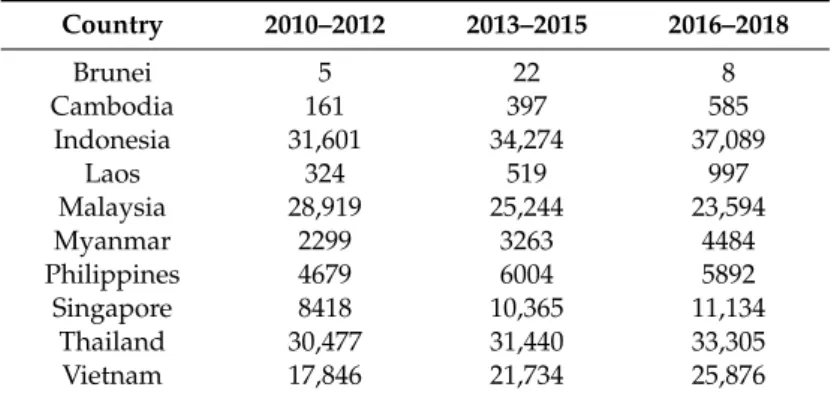
As to regional agri-food exports, continuous growth can be seen in almost every country, though to a different extent (Table4). The three exceptions are Brunei, Malaysia and the Philippines. As their basic agricultural indicators show a decreasing trend, this is a clear indicator of the higher production efficiency. Based on these trends, one might expect higher comparative advantages for regional agri-food trade ([17,18]).
Table 4.Agri-food exports of the ASEAN countries, 2010–2018, million USD at current prices.
Country 2010–2012 2013–2015 2016–2018
Brunei 5 22 8
Cambodia 161 397 585
Indonesia 31,601 34,274 37,089
Laos 324 519 997
Malaysia 28,919 25,244 23,594
Myanmar 2299 3263 4484
Philippines 4679 6004 5892
Singapore 8418 10,365 11,134
Thailand 30,477 31,440 33,305
Vietnam 17,846 21,734 25,876
Source: authors’ composition based on [31] data.
Export values are closely related to production. According to [32], Indonesia is far the largest producer among the member states with almost USD 148 billion production value and USD 37 million agri-food exports. Surprisingly, the Thai export is close to the Indonesian coming from less than USD 42 billion production. Its 2016–2018 average was USD 33 million. Vietnam was third place
on this list; however, this country is the second largest agricultural producer of the region (USD 49.42 billion). Despite the highest importance of the sector measured by either the contribution to GDP or agricultural employment, Malaysia is only the fourth largest exporter among the ASEAN countries with USD 24 million value for 2016–2018. It should be noted that despite of the negligible Singaporean agricultural sector, this country is the fifth largest agri-food exporter of the region. This underlines the importance of re-export and processing in the agri-food exports.
The least significant agri-food exporters are the Brunei, Cambodia and Laos. Laos is especially surprising as the agricultural sector employs two-thirds of the employees and produces almost 16% of the national value added. Unfortunately, USD-based production value is not available for Myanmar in the FAO database.
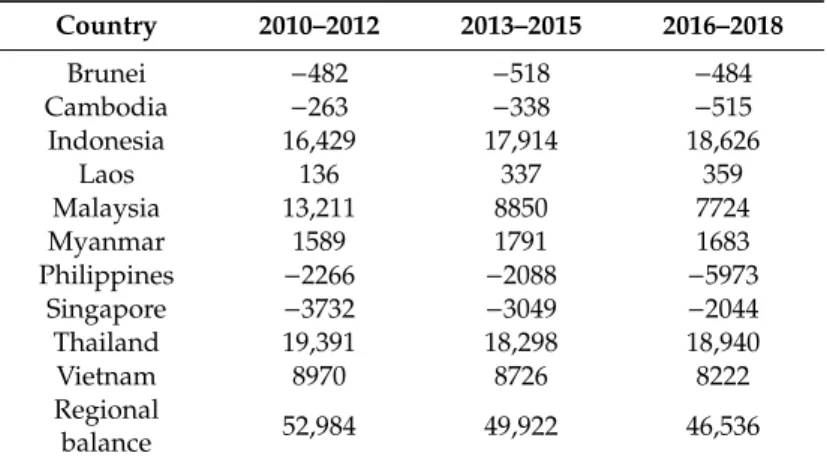
Analyzing agri-food trade balance gives further insights into the trade patterns described above (Table5). First, the ASEAN region has traditionally been a net exporter of agri-food goods, although on a decreasing extent from 2010 to 2012 to 2016 to 2018. In terms of country-level performance, Indonesia, Laos, Malaysia, Myanmar, Thailand and Vietnam have a trade surplus. Indonesia, despite being the largest producer of the region, has only the second largest trade surplus, however, that shows a continuous increase during the analyzed years. Already indicated by its large agri-food exports, Thailand was able to reach the highest trade surplus. This indicates a higher export unit value than that of Indonesia. However, the Thai agri-food trade balance decreased from 2010 to 2012 to 2016 to 2018. Besides Indonesia, only Laos was able to increase its trade surplus in the analyzed period.
Brunei, Cambodia, Philippines and Singapore have a trade deficit. Although Cambodia has the most significant agricultural sector (22.01% of the GDP and 33.65% of the employment) within the region, its trade deficit increased in the last 9 years. Contrary to Cambodia, Singapore could decrease its trade deficit from USD 3.7 billion to 2.0 billion. This is in line with the dynamic growth of the Singaporean agri-food exports.
Table 5.Agri-food trade balance of the ASEAN, 2010–2018, USD million at current prices.
Country 2010–2012 2013–2015 2016–2018
Brunei −482 −518 −484
Cambodia −263 −338 −515
Indonesia 16,429 17,914 18,626
Laos 136 337 359
Malaysia 13,211 8850 7724
Myanmar 1589 1791 1683
Philippines −2266 −2088 −5973
Singapore −3732 −3049 −2044
Thailand 19,391 18,298 18,940
Vietnam 8970 8726 8222
Regional
balance 52,984 49,922 46,536
Source: authors’ composition based on [31] data.
As to agri-food exports by product, animal or vegetable fats and oils were the most important agricultural commodities of the ASEAN countries, providing one-fourth of the regional, and more than one-third of the global exports (Table6). Apart from this product group, the most important products differ regionally (ASEAN level) and globally (World level). These patterns predict mixed competitive positions in regional and global markets for agri-food trade products ([13,14]).
Table 6.Export share of the top five agri-food product groups in the ASEAN exports, 2010–2018.
Product Groups 2010–2012 2013–2015 2016–2018 ASEAN destination
Animal or vegetable fats and oils 23.80% 17.27% 16.97%
Beverages, spirits and vinegar 9.14% 12.19% 11.61%
Miscellaneous edible preparations 6.87% 9.54% 10.17%
Preparations of cereals, flour, starch or milk, pastrycooks’ products 6.75% 8.00% 7.51%
Cereals 10.27% 6.81% 5.53%
Sum of top five products 56.83% 53.81% 51.78%
World destination
Animal or vegetable fats and oils 36.74% 31.14% 28.85%
Fish and crustaceans, mollusks and other aquatic invertebrates 9.51% 8.98% 8.66%
Edible fruit and nuts, peel of citrus or melons 3.33% 4.82% 7.80%
Preparations of meat, of fish or of crustaceans, mollusks or other
aquatic invertebrates 7.48% 7.62% 7.55%
Miscellaneous edible preparations 3.20% 4.70% 5.73%
Sum of top five products 60.26% 57.26% 58.59%
Source: authors’ composition based on [31] data.
At the ASEAN-level, beverages, spirits and vinegar and miscellaneous edible preparations have shares above 10%. Cereals preparations are the fourth important regional export product group.
Cereals had 10.27% average share in the first third of the analyzed period, which went back to 5.53%
by the end of the period. Regional trade is quite concentrated as the top five product groups give more than half of the total agri-food export.
Animal or vegetable fats and oils are the most important export products at world level, too.
Their share in the total exports is even higher than that of the ASEAN level (28.85%). All the other four product groups have less than 10% share. Fish and different fish products are traded mostly internationally, as 9 out of the 10 ASEAN members have direct sea connection. Additionally, edible fruit and nuts, as well as preparations are on the top five list. International trade is more concentrated than that of the regional, these products give 60% of the total exports on an average.
6. Export Competitiveness of ASEAN Agri-Food Trade
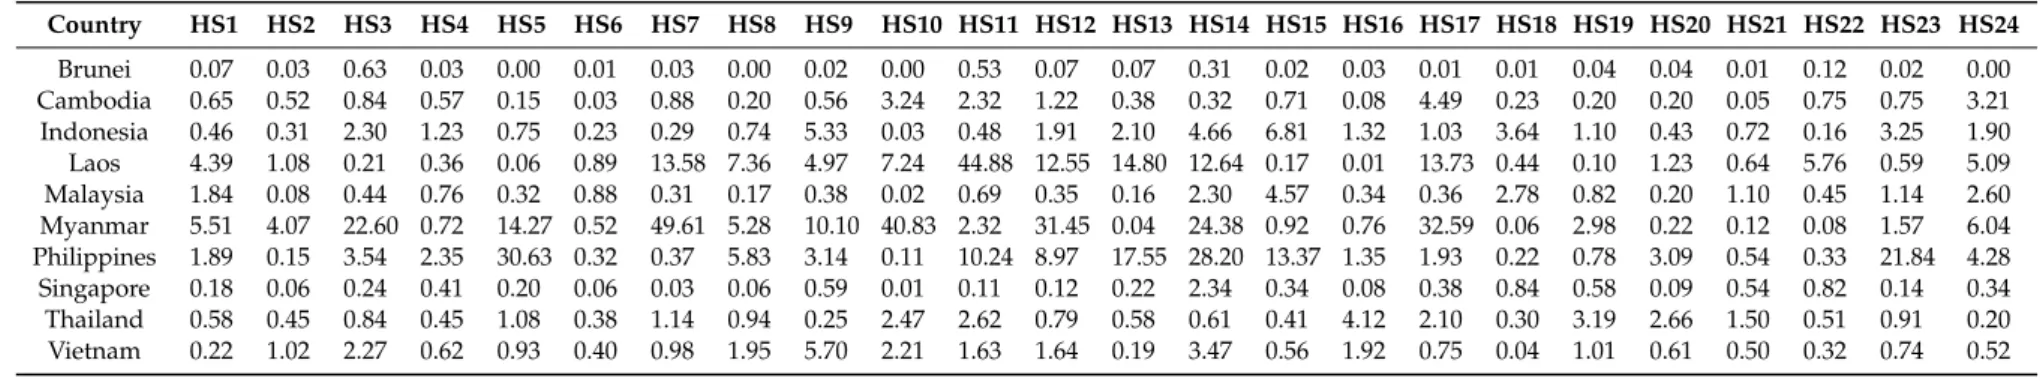
The revealed comparative advantages of the ASEAN region are analyzed by the Balassa index as described in the methodology section. First, ASEAN–World relations are analyzed, meaning that global competitiveness in agri-food trade of the ASEAN countries is presented. Detailed, country and product group level results can be found in AppendixB. In this regard, Myanmar (18.88), Laos (8.21) and the Philippines (5.36) lead the region (2010–2018 averages are in brackets) with a relatively high but decreasing level of comparative advantages (Table7). Myanmar had a relatively high comparative advantage in fish (HS3; 22.60), vegetables (HS7; 49.61), cereals (HS10; 40.83), oil seeds (HS12; 31.45), vegetable plaiting materials (HS14; 24.38) and sugar (HS17; 32.59) trade in global markets in the period analyzed. Laos excelled at exporting products of the milling industry (HS11; 44.88) to world markets, while the Philippines was relatively good at exporting products of animal origin (HS5; 30.63), vegetable plaiting materials (HS14; 28.20) and residues of the food industry (HS23; 21.84) to global markets.
Brunei, Malaysia and Singapore were the countries in the region lacking comparative advantages in agri-food trade on the world market in the whole period analyzed. In general, however, comparative advantages have decreased between 2010 and 2018, suggesting deteriorating competitive positions in agri-food trade on the world market.
Table 7.ASEAN–World Balassa indices of agricultural exports by country, 2010–2018.
Country 2010–2012 2013–2015 2016–2018
Brunei 0.03 0.15 0.24
Cambodia 0.88 1.23 1.18
Indonesia 1.73 1.96 2.09
Laos 9.19 6.45 8.98
Malaysia 0.92 0.88 0.85
Myanmar 23.27 20.78 12.59
Philippines 5.98 6.04 4.07
Singapore 0.27 0.25 0.25
Thailand 1.27 1.22 1.18
Vietnam 1.98 1.36 1.10
Source: authors’ composition based on [31] data.
These results are not fully in line with the literature ([12–14]) stating that comparative advantages and agricultural productivity go together—based on Tables1 and2, the case of the Philippines contradicts associated theory and previous expectations. As to processed products, the evolving picture is also rather mixed as both raw materials and processed products drive revealed comparative advantages in the ASEAN countries in the period analyzed. This is partly in line with previous literature ([12,14]) and our initial expectations.
However, when trading amongst each other, different competitive patterns have become available.
Laos (17.17), Cambodia (15.46) and Myanmar (12.39) had relatively high levels of comparative advantages in regional agri-food trade (Table 8). In ASEAN–ASEAN regional trade, Laos was especially competitive in meat (HS2; 32.99), live trees (HS6; 18.75), edible vegetables (HS7; 34.00), cereals (HS10; 35.63), products of the milling industry (HS11; 31.39) and oil seeds (HS12; 20.23), while Cambodia excelled at meat (HS2; 41.24), oil seeds (HS12; 43.13) and sugar (HS17; 48.09) trade.
Myanmar has been significantly good at production and trade of meat (HS2; 11.89), fish (HS3; 21.17), products of animal origin (HS5; 23.94), oil seeds (HS12; 15.00), vegetable plaiting materials (HS14;
10.27) and residues and waste from the food industry (HS23; 10.10) in the period analyzed. Singapore remained the only country without competitive positions in regional agri-food trade. Moreover, in the majority of the cases, comparative advantages have weakened also in regional markets. There is no clear sign that either raw materials or processed products would drive comparative advantages. These mixed results are in line with some previous literature ([12,13]), though they contradict others on clear signs of processed products having higher comparative advantages ([15,16]). Detailed, country and product group level results can be found in AppendixC.
Table 8.ASEAN–ASEAN Balassa indices of agri-food exports by country, 2010–2018.
Country 2010–2012 2013–2015 2016–2018
Brunei 1.28 2.02 1.24
Cambodia 13.69 20.12 12.57
Indonesia 1.63 1.68 1.46
Laos 24.82 15.76 10.94
Malaysia 1.62 1.45 1.41
Myanmar 14.77 11.28 11.11
Philippines 4.36 3.77 2.40
Singapore 0.71 0.74 0.76
Thailand 1.43 1.37 1.33
Vietnam 2.75 2.00 1.83
Source: authors’ composition based on [31] data.
The complexity of intra-ASEAN trade becomes evident from the arguments above. On the one hand, based on most of the literature ([12–14]), it is observable that countries with the highest levels of agricultural potential and productivity excelled in regional trade. On the other hand, a variety of products gave the basis of comparative advantages in regional agri-food trade, somehow contradicting the literature on raw materials-processed agri-food products discussed above ([15,16]). Moreover, it can be concluded that comparative advantages are higher in the case of intra-ASEAN agri-food trade than global trade, supporting the majority of the empirical literature ([12,16,18]).
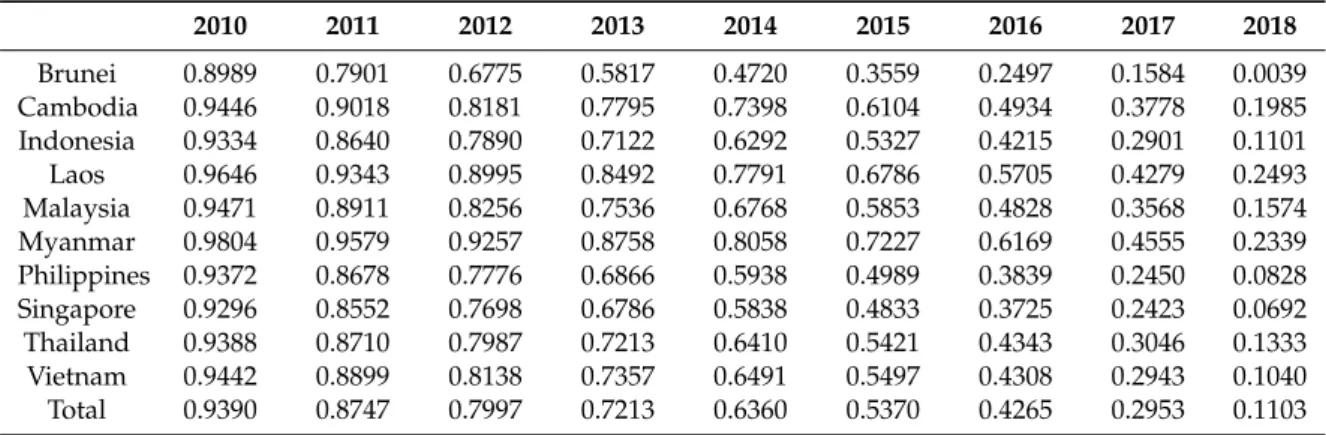
The decreasing level of comparative advantages is also evident from deteriorating survival rates either in regional or in global terms (Tables9and10). In other words, results confirm that in general the survival times are not constant over the period analyzed. Survival chances of 98% at the beginning of the period fell to 0–25% by the end of the period, suggesting that a generally fierce competition exists in global as well as regional agri-food trade. Results vary by country, though the highest survival times exist for Cambodia, Laos and Myanmar—countries with generally high comparative advantages.
The equality of the survival functions across the countries can be checked using two non-parametric tests (Wilcoxon and log-rank tests) and results of these tests show that the hypothesis of equality across survivor functions can be rejected at the 1% level of significance.
Table 9.Survival functions of the ASEAN agri-food trade with the world, 2010–2018.
2010 2011 2012 2013 2014 2015 2016 2017 2018
Brunei 0.8901 0.7778 0.6655 0.5640 0.4533 0.3359 0.2288 0.1348 0.0023 Cambodia 0.9276 0.8438 0.7526 0.6869 0.6087 0.4718 0.3505 0.1942 0.0455 Indonesia 0.9141 0.8272 0.7360 0.6426 0.5452 0.4452 0.3359 0.2115 0.0511 Laos 0.9459 0.8893 0.8470 0.7639 0.6844 0.5639 0.4393 0.2992 0.1155 Malaysia 0.9026 0.8065 0.7074 0.6080 0.5066 0.3994 0.2901 0.1672 0.0232 Myanmar 0.9820 0.9315 0.8668 0.7910 0.7132 0.6209 0.5058 0.3358 0.1261 Philippines 0.9247 0.8543 0.7596 0.6606 0.5581 0.4537 0.3417 0.2023 0.0427 Singapore 0.9070 0.8084 0.6975 0.5869 0.4767 0.3636 0.2494 0.1316 0.0064 Thailand 0.9167 0.8283 0.7368 0.6398 0.5403 0.4347 0.3209 0.1965 0.0424 Vietnam 0.9269 0.8514 0.7612 0.6688 0.5733 0.4623 0.3431 0.2059 0.0408 Total 0.9189 0.8337 0.7403 0.644 0.5446 0.4356 0.3213 0.1919 0.0364
Source: authors’ composition based on [31] data.
Table 10.Survival functions of the regional ASEAN agri-food trade, 2010–2018.
2010 2011 2012 2013 2014 2015 2016 2017 2018
Brunei 0.8989 0.7901 0.6775 0.5817 0.4720 0.3559 0.2497 0.1584 0.0039 Cambodia 0.9446 0.9018 0.8181 0.7795 0.7398 0.6104 0.4934 0.3778 0.1985 Indonesia 0.9334 0.8640 0.7890 0.7122 0.6292 0.5327 0.4215 0.2901 0.1101 Laos 0.9646 0.9343 0.8995 0.8492 0.7791 0.6786 0.5705 0.4279 0.2493 Malaysia 0.9471 0.8911 0.8256 0.7536 0.6768 0.5853 0.4828 0.3568 0.1574 Myanmar 0.9804 0.9579 0.9257 0.8758 0.8058 0.7227 0.6169 0.4555 0.2339 Philippines 0.9372 0.8678 0.7776 0.6866 0.5938 0.4989 0.3839 0.2450 0.0828 Singapore 0.9296 0.8552 0.7698 0.6786 0.5838 0.4833 0.3725 0.2423 0.0692 Thailand 0.9388 0.8710 0.7987 0.7213 0.6410 0.5421 0.4343 0.3046 0.1333 Vietnam 0.9442 0.8899 0.8138 0.7357 0.6491 0.5497 0.4308 0.2943 0.1040 Total 0.9390 0.8747 0.7997 0.7213 0.6360 0.5370 0.4265 0.2953 0.1103
Source: authors’ composition based on [31] data.
These results are well in line with the empirical literature and previous expectations ([21–23]).
On the one hand, it is evident that the duration of revealed comparative advantages is limited in time either in global as well as in regional markets for the ASEAN countries, suggesting that the chances for preserving competitive positions with the same product structure are limited. On the other hand, it also becomes clear that the highest chances for the same structure to survive in the long run is only valid for countries with generally and relatively high levels of comparative advantages.
There are many policy lessons coming out from the analysis above. First of all, countries should focus and mainstream on the export of those products which they have a comparative advantage in, based on the results of this paper. Processed and higher value-added products should be prioritized as countries gain more with their exports. It should also be clear for countries in which markets they are competitive by which products—our results can help to find them. The brevity of comparative advantage positions in global as well as regional markets in time should also be noted and strategies for concentrating on long-lasting competitive positions and associated product structures should be developed.
However, one should also be aware of the limitations of the paper when reading the results above.
First of all, ASEAN trade data, as is the case for many times, were not fully available as some data were missing for some country-product relations. Moreover, we used HS6 classification of products, while some other papers opted for other classification systems like Standard International Trade Classification (SITC) or Broad Economic Categories (BEC). Results might also be different as the paper ed applied only the original Balassa index, while some other papers have used different Balassa-based indices. Furthermore, every region has specific trade patterns, thereby contributing to the existing results of the literature. These reasons may mean that not all of the results presented are in line with previous literature, though our results are valid in this specific context.
7. Conclusions
The paper analyzed the competitiveness of the ASEAN countries agri-food trade on global and regional markets between 2010 and 2018 and reached several conclusions. Results suggest that agriculture has the highest share of value added in Cambodia and Myanmar, while the highest share of agricultural employment is observable in Laos and Myanmar. The results also suggest that Myanmar, Laos and the Philippines have the highest levels of agri-food trade competitiveness in the world market, suggesting that the productivity-based comparative advantages theory is just partly valid to ASEAN countries.
As far as product structure is concerned, our results were mixed, as raw materials as well as processed products are both sources of comparative advantages in the region. However, it has become evident that comparative advantages in regional agri-food trade are generally higher than in global agri-food trade which is in line with previous literature and expectations.
However, stability tests indicated that agri-food trade advantages had weakened for all countries concerned, though to a different extent. This process was even stronger at world level, suggesting that international competition is sharper than regional competition. Consequently, in line with previous literature, chances for the same product structure to be competitive in the long run is generally low, suggesting fierce competition on agri-food markets.
Some policy lessons were also drawn based on the results above. Competitiveness of the ASEAN countries can be strengthened by increasing the level of product processing, by concentrating on the export of higher value-added products, by concentrating more on regional trade and by mainstreaming the export of products with competitive potentials. Future research might analyze the region with different competitiveness indicators or compare the results with different regions.
Author Contributions:Conceptualization, T.M. and A.J.; methodology, T.M. and A.J.; software, A.J.; validation, T.M. andÁ.S.; formal analysis, T.M. andÁ.S.; investigation,Á.S.; resources, T.M. andÁ.S.; data curation, T.M. and Á.S.; writing—original draft preparation, T.M. andÁ.S.; writing—review and editing, A.J.; visualization, T.M.;
supervision, A.J.; project administration, T.M. and A.J.; funding acquisition, A.J. All authors have read and agreed to the published version of the manuscript.
Funding:This research was funded and supported by the National Research, Development and Innovation Office under grant number 119669, titled “Competitiveness of Agriculture in International Trade: A Global Perspective”.
The authors gratefully acknowledge the financial support.
Conflicts of Interest:The authors declare no conflict of interest.
Appendix A
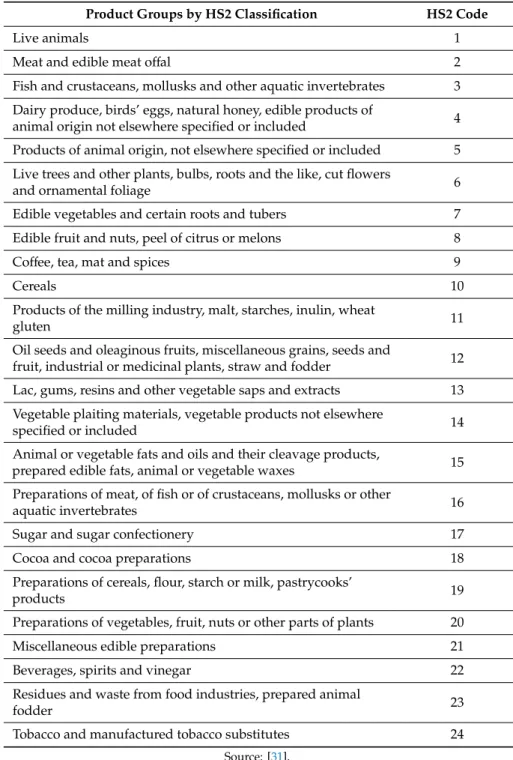
Table A1.HS2 classification of the agricultural product groups.
Product Groups by HS2 Classification HS2 Code
Live animals 1
Meat and edible meat offal 2
Fish and crustaceans, mollusks and other aquatic invertebrates 3 Dairy produce, birds’ eggs, natural honey, edible products of
animal origin not elsewhere specified or included 4 Products of animal origin, not elsewhere specified or included 5 Live trees and other plants, bulbs, roots and the like, cut flowers
and ornamental foliage 6
Edible vegetables and certain roots and tubers 7 Edible fruit and nuts, peel of citrus or melons 8
Coffee, tea, mat and spices 9
Cereals 10
Products of the milling industry, malt, starches, inulin, wheat
gluten 11
Oil seeds and oleaginous fruits, miscellaneous grains, seeds and
fruit, industrial or medicinal plants, straw and fodder 12 Lac, gums, resins and other vegetable saps and extracts 13 Vegetable plaiting materials, vegetable products not elsewhere
specified or included 14
Animal or vegetable fats and oils and their cleavage products,
prepared edible fats, animal or vegetable waxes 15 Preparations of meat, of fish or of crustaceans, mollusks or other
aquatic invertebrates 16
Sugar and sugar confectionery 17
Cocoa and cocoa preparations 18
Preparations of cereals, flour, starch or milk, pastrycooks’
products 19
Preparations of vegetables, fruit, nuts or other parts of plants 20
Miscellaneous edible preparations 21
Beverages, spirits and vinegar 22
Residues and waste from food industries, prepared animal
fodder 23
Tobacco and manufactured tobacco substitutes 24
Source: [31].
Appendix B
Table A2.ASEAN–World Balassa indices of agricultural exports by product, 2010–2018.
Country HS1 HS2 HS3 HS4 HS5 HS6 HS7 HS8 HS9 HS10 HS11 HS12 HS13 HS14 HS15 HS16 HS17 HS18 HS19 HS20 HS21 HS22 HS23 HS24 Brunei 0.07 0.03 0.63 0.03 0.00 0.01 0.03 0.00 0.02 0.00 0.53 0.07 0.07 0.31 0.02 0.03 0.01 0.01 0.04 0.04 0.01 0.12 0.02 0.00 Cambodia 0.65 0.52 0.84 0.57 0.15 0.03 0.88 0.20 0.56 3.24 2.32 1.22 0.38 0.32 0.71 0.08 4.49 0.23 0.20 0.20 0.05 0.75 0.75 3.21 Indonesia 0.46 0.31 2.30 1.23 0.75 0.23 0.29 0.74 5.33 0.03 0.48 1.91 2.10 4.66 6.81 1.32 1.03 3.64 1.10 0.43 0.72 0.16 3.25 1.90 Laos 4.39 1.08 0.21 0.36 0.06 0.89 13.58 7.36 4.97 7.24 44.88 12.55 14.80 12.64 0.17 0.01 13.73 0.44 0.10 1.23 0.64 5.76 0.59 5.09 Malaysia 1.84 0.08 0.44 0.76 0.32 0.88 0.31 0.17 0.38 0.02 0.69 0.35 0.16 2.30 4.57 0.34 0.36 2.78 0.82 0.20 1.10 0.45 1.14 2.60 Myanmar 5.51 4.07 22.60 0.72 14.27 0.52 49.61 5.28 10.10 40.83 2.32 31.45 0.04 24.38 0.92 0.76 32.59 0.06 2.98 0.22 0.12 0.08 1.57 6.04 Philippines 1.89 0.15 3.54 2.35 30.63 0.32 0.37 5.83 3.14 0.11 10.24 8.97 17.55 28.20 13.37 1.35 1.93 0.22 0.78 3.09 0.54 0.33 21.84 4.28 Singapore 0.18 0.06 0.24 0.41 0.20 0.06 0.03 0.06 0.59 0.01 0.11 0.12 0.22 2.34 0.34 0.08 0.38 0.84 0.58 0.09 0.54 0.82 0.14 0.34 Thailand 0.58 0.45 0.84 0.45 1.08 0.38 1.14 0.94 0.25 2.47 2.62 0.79 0.58 0.61 0.41 4.12 2.10 0.30 3.19 2.66 1.50 0.51 0.91 0.20 Vietnam 0.22 1.02 2.27 0.62 0.93 0.40 0.98 1.95 5.70 2.21 1.63 1.64 0.19 3.47 0.56 1.92 0.75 0.04 1.01 0.61 0.50 0.32 0.74 0.52
Source: authors’ composition based on [31].
Appendix C
Table A3.ASEAN–ASEAN Balassa indices of agricultural exports by product, 2010–2018.
Country HS1 HS2 HS3 HS4 HS5 HS6 HS7 HS8 HS9 HS10 HS11 HS12 HS13 HS14 HS15 HS16 HS17 HS18 HS19 HS20 HS21 HS22 HS23 HS24 Brunei 1.67 13.88 4.96 1.30 0.01 0.21 0.44 0.15 0.20 0.08 0.98 0.17 0.47 0.01 0.58 1.01 0.04 0.10 0.54 0.42 0.04 0.20 0.04 0.00 Cambodia 14.35 41.24 13.49 4.64 2.59 1.18 28.06 9.17 3.85 9.17 13.81 43.13 2.44 12.29 3.41 8.69 48.09 0.08 0.29 7.70 0.99 12.45 4.99 9.24 Indonesia 1.64 0.81 2.47 0.78 1.50 1.07 0.97 1.48 2.83 1.15 1.48 1.70 2.08 3.34 2.69 0.80 0.92 2.49 0.98 0.44 0.64 0.59 1.91 1.35 Laos 11.07 32.99 0.94 0.86 8.93 18.75 34.00 11.93 10.83 35.63 31.39 20.23 19.17 11.24 2.90 0.04 14.86 0.19 0.26 6.57 0.24 6.37 7.86 7.27 Malaysia 1.80 1.92 1.21 1.51 0.98 2.92 2.11 1.21 0.93 1.06 1.65 1.43 0.66 1.46 2.04 1.25 0.81 1.93 1.30 1.40 1.54 1.25 1.13 1.81 Myanmar 0.89 11.89 21.17 5.13 23.94 1.40 19.20 1.97 8.93 15.62 3.44 15.00 1.38 10.27 4.23 1.70 1.99 0.22 2.03 0.44 0.06 0.88 10.10 4.58 Philippines 3.38 2.33 2.85 3.96 6.76 0.13 0.94 4.94 1.66 7.03 4.93 8.15 10.45 4.97 5.61 1.19 4.10 0.53 1.29 3.03 0.49 0.95 8.41 7.05 Singapore 1.02 1.36 0.71 0.77 0.85 0.29 0.41 1.18 0.66 0.44 0.55 0.76 1.27 0.50 0.65 0.59 0.51 0.65 0.29 0.87 0.40 1.09 0.57 0.41 Thailand 2.75 2.28 0.77 1.72 2.46 1.35 0.87 0.97 0.25 2.12 1.57 1.55 0.98 0.07 0.78 2.08 2.44 0.36 2.27 1.74 1.99 1.21 1.68 0.42 Vietnam 0.90 2.20 3.16 0.77 3.52 1.61 1.92 1.47 4.18 4.29 2.61 1.63 0.20 2.23 1.74 3.41 1.26 0.14 1.35 0.79 1.88 1.51 4.56 1.09
Source: authors’ composition based on [31].
References
1. Balassa, B. Trade liberalization and revealed comparative advantage. Manch. Sch. Econ. Soc. Stud.1965, 33, 99–123. [CrossRef]
2. Koopman, R.; Wang, Z.; Wei, S.-J. Tracing value-added and double counting in gross exports.Am. Econ. Rev.
2014,104, 459–494. [CrossRef]
3. Schneider, M.R.; Paunescu, M. Changing varieties of capitalism and revealed comparative advantages from 1990 to 2005: A test of the Hall and Soskice claims.Socio-Econ. Rev.2012,10, 731–753. [CrossRef]
4. Costinot, A.; Donaldson, D.; Komunjer, I. What goods do countries trade? A quantitative exploration of Ricardo’s ideas.Rev. Econ. Stud.2012,79, 581–608. [CrossRef]
5. Jagdambe, S.; Kannan, E. Effects of ASEAN-India free trade agreement on agricultural trade: The gravity model approach.World Dev. Pers.2020,19, 100212. [CrossRef]
6. Smith, A.An Inquiry into the Nature and Causes of the Wealth of Nations; Methuen & Co.: London, UK, 1776.
7. Ricardo, D.On the Principles of Political Economy and Taxation; John Murray: London, UK, 1817.
8. Heckscher, E. The Effect of Foreign Trade on the Distribution of Income. Ekon. Tidskr.1919,21, 497–512.
9. Ohlin, B.Interregional and International Trade; Harvard University Press: Cambridge, MA, USA, 1933.
10. Rybczynski, T.M. Factor endowments and relative commodity prices.Economica1955,22, 336–341. [CrossRef]
11. Jambor, A.; Babu, S. Competitiveness of Global Agriculture: Policy Lessons for Food Security; Springer:
Berlin/Heidelberg, Germany, 2016; 199p. [CrossRef]
12. Fert˝o, I. Global Agri-food trade competitiveness: Gross versus value added exports.AGRIS Online Pap. Econ.
Inform.2018,10, 39–47. [CrossRef]
13. Bojnec, S.; Fert˝o, I. Agri-food comparative advantages in the European Union countries by value chains before and after enlargement towards the East.J. Agric. Sci.2019,30, 69–77. [CrossRef]
14. Jambor, A.; Toth, A.T.; Koroshegyi, D. Competitiveness in the trade of spices: A global evidence.Bulg. J.
Agric. Sci.2018,24, 729–736. [CrossRef]
15. Mizik, T.; Gal, P.; Torok, A. Does Agricultural Trade Competitiveness Matter? The Case of the CIS Countries.
AGRIS Online Pap. Econ. Inform.2020,12, 61–72. [CrossRef]
16. Bojnec, S.; Fert˝o, I. Economic crisis and the fragility of comparative advantage in european agriculture.Ger. J.
Agric. Econ.2018,67, 147–159. Available online:https://www.gjae-online.de/articles/economic-crisis-and- the-fragility-of-comparative-advantage-in-european-agriculture/.(accessed on 6 October 2020).
17. Matkovski, B.; Kalas, B.; Zekic, S.; Jeremic, M. Agri-food competitiveness in South East Europe. Outlook Agric.2019,48, 326–335. [CrossRef]
18. Smutka, L.; Maitah, M.; Svatos, M. Changes in the Czech agrarian foreign trade competitiveness–different groups of partners’ specifics.Agric. Econ. Czech2018,64, 399–411. [CrossRef]
19. Kastakova, E.; Baumgartner, B.; Zatko, M. The impact of the russian embargo on its agri-food trade with the EU: Analysis by selected indicators.Int. Organ. Res. J.2018,13, 256–271. [CrossRef]
20. Bojnec, S.; Fert˝o, I. The duration of global agri-food export competitiveness.Br. Food J.2017,6, 1378–1393.
[CrossRef]
21. Bojnec, S.; Fert˝o, I. Drivers of the duration of comparative advantage in the European Union’s agri-food exports.Agr. Econ. Czech2018,64, 51–60. [CrossRef]
22. Balogh, J.; Jambor, A. Determinants of revealed comparative advantages: The case of cheese trade in the European Union.Acta Aliment. Hung.2016,46, 1–7. [CrossRef]
23. Torok, A.; Jambor, A. Determinants of the revealed comparative advantages: The case of the European ham trade.Agr. Econ. Czech2016,62, 471–482. [CrossRef]
24. Deardorff, A.V. Comparative advantage: The theory behind measurement, 27–40. InGlobalisation, Comparative Advantage and the Changing Dynamics of Trade; OECD Publishing: Paris, France, 2011. [CrossRef]
25. Hoang, V.V.; Tran, K.T. Comparative advantages of alternative crops: A comparison study in Ben Tre, Mekong Delta, Vietnam.AGRIS Online Pap. Econ. Inform.2019,11, 35–47. [CrossRef]
26. Bojnec, S.; Fert˝o, I. European Enlargement and Agro-Food Trade. Can. J. Agric. Econ. 2008,56, 563–579.
[CrossRef]
27. Besedes, T.; Prusa, T.J. The role of extensive and intensive margins and export growth.J. Dev. Econ.2011, 96, 371–379. [CrossRef]
28. Cleves, M.A.; Gould, W.W.; Gutierrez, R.G.An Introduction to Survival Analysis Using Stata; Stata Press:
College Station, TX, USA, 2004; 308p, Available online:https://www.stata.com/bookstore/survival-analysis- stata-introduction/(accessed on 6 October 2020).
29. FAOStat. Land Use. Available online:http://www.fao.org/faostat/en/#data/RL(accessed on 6 October 2020).
30. WDI, W.B.s. World Development Indicators. Available online: https://databank.worldbank.org/source/
world-development-indicators(accessed on 6 October 2020).
31. WITS, W.B.s. World Integrated Trade Solution. Available online:https://wits.worldbank.org(accessed on 12 October 2020).
32. FAO. Value of Agricultural Production. Available online:http://www.fao.org/faostat/en/#data/QV(accessed on 6 October 2020).
Publisher’s Note:MDPI stays neutral with regard to jurisdictional claims in published maps and institutional affiliations.
©2020 by the authors. Licensee MDPI, Basel, Switzerland. This article is an open access article distributed under the terms and conditions of the Creative Commons Attribution (CC BY) license (http://creativecommons.org/licenses/by/4.0/).