85th Annual Conference of the Agricultural Economics Society Warwick University
18 - 20 April 2011
Impacts of EU Accession on Hungarian Primary and Processed Agricultural Trade
Attila Jambor
Assistant Professor, Corvinus University of Budapest E-mail: attila.jambor@uni-corvinus.hu
Copyright 2010 by Attila Jambor. All rights reserved. Readers may make verbatim copies of this document for non-commercial purposes by any means, provided that this copyright notice appears on all such copies.
Abstract
In 2004, Hungary joined the European Union (EU) along with nine other Central and Eastern European Countries, causing several changes in the field of agriculture. One of the major changes was the transformation of national agri-food trade. The aim of the paper is to analyse the effects of EU accession on the Hungarian primary and processed agri-food trade, especially considering revealed comparative advantages, by using recent data. Results suggest that EU accession raised the intensity of trade contacts but had a negative impact on trade balance. Nominal values of both exports and imports increased after 2004, however, Hungarian agriculture is increasingly based on raw material export and processed food import. It also turned out that revealed comparative advantages of Hungarian primary agri-food products in EU15 remained almost constant after accession, while comparative advantages of processed agri-food products has been gradually increasing by time and even reached the satisfactory level in some cases. From the policy perspective, it is apparent that there is a need for deeper structural reforms of the Hungarian agricultural and food sector is the future.
Keywords: EU accession, agri-food trade, primary and processed products JEL code: Q17, Q18
Acknowledgement
The author gratefully acknowledges financial support from the Hungarian Scientific Research Fund No. 83119 “Changes and determinants of Central and Eastern European agricultural trade”.
Introduction
In 2004, Hungary joined the European Union (EU) along with nine other Central and Eastern European Countries, causing several changes in the field of agriculture. One of the major changes was the transformation of national agri-food trade, as indicated by several authors (Fertő 2008, Bojnec and Fertő 2008b, Jambor 2010). On the whole, recent literature states that EU accession has had an overall positive impact on the NMS, though performance of individual countries might show differences (Csaki and Jambor, 2010).
On the one hand, there has been limited number of research on the impacts of accession on trade specialisation in Hungary. Though it is clear that vast majority of NMS still have a negative agricultural trade balance, Hungary has increased agricultural trade substantially after 2004 with EU15 due to the elimination of former trade barriers and maintained its net exporter position.
On the other hand, it is demonstrable that national agri-food trade with EU15 is mainly based on raw material export and processed food import (e.g. Csaki and Jambor 2009, Fertő 2008). It seems that fragmentation of agri-food trade between new and old member states have created an interesting situation: EU12 export agricultural raw materials to EU15, which are processed there and then imported back as processed agricultural products. This situation has significant consequences to the vertical agri- food chains as well as the processing industry, which are both touched upon in the paper.
The aim of the paper, therefore, is to expand the scant literature of the field by providing a comprehensive analysis of the effects of EU accession on national primary and processed agri-food trade. In order to reach this aim, the paper is structured as follows. First, a brief literature review is given on empirical research analysing CEE agri-food trade after accession, followed by the demonstration of the methods and data used. Second, structural changes in Hungarian primary and processed agricultural trade are analysed to provide a background for analysis. The third part of the paper looks behind data by using the revealed comparative advantages method for Hungarian and EU15 primary and processed agri-food trade. Fourth, discussion on results of various indices is followed by a policy implication part, thereby combining micro and macro level economic analyses.
Research on CEE agricultural trade
Despite its apparent importance, relatively little research has been made on the effects of EU accession on CEE agricultural trade. Bojnec and Fertő (2009) have investigated the determinants of price and quality competition in agro-food trade between the CEC- 5 and the EU-15 in the pre-enlargement period. They found that the Czech Republic and Slovakia have made catching up in successful quality competition, but not in successful price competition. However, Hungary and Poland have also made catching up in successful quality competition and to a lesser extent in successful price competition. Only Slovenia has not made any significant catching up in successful quality competition.
Fertő (2008) analysed evolving patterns of agri-food trade in eight CEE countries by using empirical procedures based around the classic Balassa index. He concluded that EU accession increased the intensity of trade in the region, though had a negative impact on agro-food relative trade advantages for all eight analyzed countries. He also found higher and more stable relative trade advantages for bulk primary raw agricultural commodities and less for consumer-ready foods, implying competitiveness shortcomings in food processing.
Bojnec and Fertő (2008a) analysed the integration of agricultural trade between South- East Europe and EU15 and found that in spite of the predominantly inter-industry nature of trade in this respect, the proportion of vertical intra-industry trade in total agricultural trade is increasing, generating a change in resource allocations between agricultural sectors. Moreover, the authors showed that agricultural trade of different quality and price products between the two regions is a consequence of trade liberalisation, economic growth and the transition in agricultural sectors.
Bojnec and Fertő (2008b) investigated the level, composition, and differences in the dynamics of revealed comparative advantage and trade specialization patterns of the 12 new member states in 1999-2006. They pointed out that trade increased with the EU enlargement and so did revealed comparative advantage in agro-food products, though there were catching-up difficulties in higher added-value processed products.
Jambor (2010) analysed structural changes in Hungarian agricultural trade after EU accession, especially considering intra-industry trade. His results suggest that EU accession raised the intensity of trade contacts but had a negative impact on trade balance. It was also proven that nominal values of both exports and imports increased after 2004, however, Hungarian agriculture is increasingly based on raw material export and processed food import. Moreover, it turned out that after accession, national agricultural exports by country and product has shown a high but decreasing level of concentration, while in the case of agricultural imports, concentration was increasingly high by country and consistently low by products.
Methods and data used
The various methods elaborated around the theory of revealed comparative advantages provide the basis for analysis. The original index of revealed comparative advantages was first published by Balassa in 1965 who defined the following (Balassa, 1965):
Bij ⎟⎟⎠
⎜⎜ ⎞
⎝
⎟⎟ ⎛
⎠
⎜⎜ ⎞
⎝
=⎛
nt nj it
ij
X X X
X , (1)
where x means export, i indicates a given country, j is for a given product, t stands for a group of products and n for a group of countries. It follows that revealed comparative advantage or disadvantage index of exports to reference countries can be calculated by comparing a given country’s export share from its total export - in correlation with the focus country’s export share in their total export. If B>1, a given country has a comparative advantage compared to focus countries - or, in contrast, a revealed comparative disadvantage.
The Balassa-index is especially criticized because it is seen to neglect the different effects of agricultural policies and asymmetric values. Trade structure is distorted by different state interventions and trade limitations, while the asymmetric value of the B index reveals that it extends from one to infinity if a country enjoys comparative advantage from a product, but in case of comparative disadvantage, it varies between zero and one, which overestimates a sector’s relative weight.
In connection with the problem of asymmetric values, the distribution of the Balassa- index was analysed by Hinloopen and van Marrewijk (2001) by classifying the B- index into four categories: Category A: 0<B≤1, Category B: 1<B≤2, Category C:
2<B≤4, Category D: 4<B. Product groups pertaining to Category A show a lack of comparative advantage, while those in Category B show a weak comparative advantage, to Category C average and to Category D a strong comparative advantage.
A further problem with the Balassa-index is its questionable ability to measure comparative advantages. Hillman (1980) developed a necessary and sufficient condition for the correspondence between the Balassa-index and pre-trade relative prices for a specific sector under homothetic preferences, the so-called Hillman condition. By using the notations of the first equation, it can be expressed as:
1 − Xij / Xnj > Xij / Xit (1 − Xit / Xnt) (2) This condition (2) is to be met for the Balassa-index to ensure that if a country’s export increases, so does the Balassa-index. In order to empirically test the condition, Marchese and de Simone (1989) converted the second equation into:
HI = (1 − Xij / Xjn) / Xij / Xti (1 − Xti / Xtn) (3) If HI>1, the B-index is suitable for measuring comparative advantage. The first empirical test of the Hillman condition was executed by Marchese and de Simone (1989) by analysing exports of 118 developing countries at different level of aggregation. They found that the Hillman condition does not hold for about 9.5 percent of the value of exports in their sample, while Hinloopen and Van Marrewijk (2001) proved that the Hillman condition does not hold for about half percent of the number of observations, which corresponds to about seven percent of the value of exports.
According to the latest empirical tests, based on around 18 million observations coming from 183 countries and 28 years, violations of the Hillman condition are small as a share of the number of observations but often represent a disproportionally large value of trade (Hinloopen and van Marrewijk, 2008). It was also proven by the authors that violations do not occur randomly across sectors or countries but they occur foremost in sectors producing primary products or that are natural-resource intensive.
On the whole, Hinloopen and van Marrewijk (2008) recommend the test as a standard diagnostic tool when analysing revealed comparative advantages.
Vollrath suggested three different specifications of revealed comparative advantages in order to eliminate the disadvantages of the Balassa-index (Vollrath, 1991): relative trade advantage index, logarithm of relative export advantage and relative competitiveness. Relative trade advantage index (RTA) takes both exports and imports into account and is the difference between relative export advantage index (RXA) and the relative import advantage index (RMA).
Expressed pro forma:
RTAij = RXAij – RMAij (4)
where RXAij = Bij és RMAij = (mij / mit) / (mnj / mnt) (m means the import), that is,
RTAij = [ (xij / xit) / (xnj / xnt) ] - [ (mij / mit) / (mnj / mnt) ] (5) If RTA > 0, this reveals that a given country has a comparative advantage compared to focus countries - or, in contrast, a revealed comparative disadvantage. This index takes into consideration effects of demand as well as those of supply so it is closer to the comparative advantages approach than indices based on exports. The higher the value, the more competitive the country is. Vollrath called his second index the logarithm of relative export advantages (lnRXA) and his third, revealed competitiveness (RC), which is the difference between the logarithm of relative export advantages and that of relative import advantages:
RCij = ln RXAij – ln RMAij (6) Positive lnRXA and RC indices indicate a competitive advantage, while negative values indicate competitive disadvantage. A benefit from their use - compared to the first two indices - is that they are symmetric to the pole. Furthermore, they account for export- and import side trade distortions and are also able to manage intra-industry trade. This latter advantage is at the same time the disadvantage of the RC-index: if there is no intra-industry trade, the index can not be interpreted.
In order to calculate the various indices mentioned above, the paper has used the Eurostat trade database by the HS6 system. Agri-food trade is defined as trade in food and beverages (HS 1-24), resulting in 697 products in 24 products groups pertaining to agriculture (after data cleaning). Data at the individual six digit level were classified into the following six groups according to their level of processing, in line with the classification of Broad Economic Categories (BEC) defined by UN: food and beverages (F&B), primary, mainly for industry processing (111); F&B, primary, mainly for household consumption (112); F&B, processed, mainly for industry use (121); F&B, processed, mainly for household consumption (122); industrial supplies not elsewhere specified – primary (21), and industrial supplies not elsewhere specified – processed (22). The paper works with trade data for 1999-2008 and divides this period into two sub-periods (1999-2003, 2004-2008), providing a basis for analysing effects of EU accession clearly. In this context, the EU is defined as the member states of the EU15.
Changes in Hungarian agri-food trade structure
The share of the EU15 in Hungarian agri-food trade was stable before 2004, while it significantly changed after accession (Figure 1). In the period 1999-2003, 41-51% of national agricultural export, import and trade balance was coming from trade with EU15, while after accession, various changes have occurred.
Figure 1: Share of Hungarian agri-food trade with the EU15 in Hungary’s total agri-food trade, percentage, 1999-2008
0%
10%
20%
30%
40%
50%
60%
70%
1999 2000 2001 2002 2003 2004 2005 2006 2007 2008 Export Import Balance
Source: Own composition based on EUROSTAT (2011)
First of all, the share of agricultural import from the EU15 in total Hungarian agricultural imports increased above 60%, that of agricultural exports raised above 50% until 2007, while that of the trade balance decreased below 35% (except for 2004). It is observable that after accession, around 60% of the total national agricultural imports and around 50% of exports are accounted for by trade with the EU15, although a continuously lower share of total trade balance originates from the EU15 (according to trade statistics, the national agricultural trade balance with Eastern European countries - both EU and non-EU members - increases). One can conclude, therefore, that intensity of agricultural trade relations with EU15 countries was enhanced by accession, though it resulted in lower profitability.
Similar conclusions can be drawn if analysing the value of Hungarian agri-food trade with EU15 (Table 1). Hungarian agri-food export grew by more than 2.5 times from 1999 to 2008 in nominal terms, while import values in the same period more than quadrupled, resulting in an almost 50% of increase in trade balance, which is continuously positive, contrary to many other countries in the region (Csaki and Jambor, 2010). However, EU accession clearly deteriorated the export/import ratio of Hungarian agri-food trade as it became 1.5 (from 2.34) to 2008 (from 1999), meaning that agri-food import is increasing to a greater extent than agri-food export (Table 1).
Table 1: Hungarian agri-food trade with EU15 in million euros, 1999-2008 Mio euro 1999 2000 2001 2002 2003 2004 2005 2006 2007 2008
Export 2151 2424 2810 2811 2841 3102 3428 3755 4905 5801 Import 919 1092 1242 1366 1481 2008 2508 2754 3226 3878 Balance 1232 1331 1568 1445 1360 1094 920 1001 1679 1923 Export/Import 2.34 2.22 2.26 2.06 1.92 1.54 1.37 1.36 1.52 1.50 Source: Own calculations based on EUROSTAT (2011)
In order to determine the stability of export structure, the linear correlation coefficient of Hungarian agri-food export to EU15 has been calculated (Table 2). It is apparent that Hungarian agri-food export was not stable in the period analysed as the correlation coefficient is measurably decreasing over time. After accession, the value of the
coefficient, compared to 1999, remained below 0.7 and reached its minimum in 2007 (Table 2). These results suggest that the product mix of Hungarian agri-food export has been continuously changing after EU accession.
Table 2: Correlation coefficient for Hungarian agri-food export with EU15, 1999-2008
1999 2000 2001 2002 2003 2004 2005 2006 2007 2008
1999 1.00
2000 0.95 1.00
2001 0.92 0.91 1.00 2002 0.79 0.74 0.86 1.00 2003 0.72 0.76 0.80 0.90 1.00 2004 0.68 0.68 0.77 0.92 0.96 1.00 2005 0.64 0.59 0.74 0.90 0.86 0.95 1.00
2006 0.60 0.52 0.66 0.85 0.78 0.89 0.96 1.00
2007 0.46 0.34 0.50 0.72 0.59 0.74 0.84 0.93 1.00 2008 0.51 0.45 0.61 0.82 0.74 0.84 0.91 0.92 0.92 1.00 Source: Own calculations based on EUROSTAT (2011)
An analysis of agricultural trade by degree of processing reveals further changes in structure (Figure 2 and 3). As apparent from Figure 2, the share of Hungarian primary agri-food export increased substantially in total agri-food export after EU accession, though was still below the level of 2001. This growth was basically due to the increase of primary agri-food export for industry processing (111), the share of which more than doubled from 1999 to 2008. Meanwhile, the share of the other two BEC categories pertaining to primary products (112 and 21) remained constant over the period analysed (Figure 2).
Figure 2: Structure of Hungarian agri-food export to EU15 by degree of processing, 1999-2008
0%
10%
20%
30%
40%
50%
60%
70%
80%
90%
100%
1999 2000 2001 2002 2003 2004 2005 2006 2007 2008 Primary (111) Primary (112) Primary (21) Processed (121) Processed (122) Processed (22)
Source: Own composition based on EUROSTAT (2011)
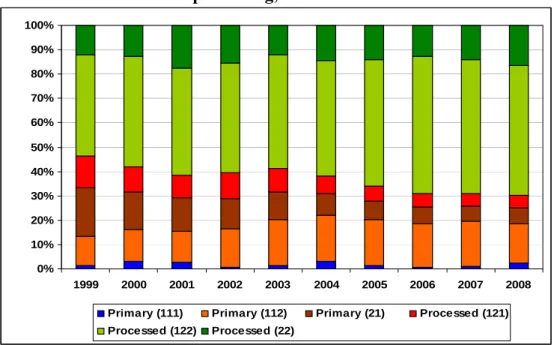
However, as expected on the basis of literature (Fertő, 2008), the share of primary products decreased after accession in line with the increase of processed agri-food products import. Processed products for household consumption (122) had the greatest share in Hungarian agri-food import from EU15 before accession and this situation has not changed after 2004 (Figure 3). The high share of processed agri-food products, mainly for household consumption (122) should be noted in case of both exports and imports, implying large intra-industry trade in such products.
Figure 3: Structure of Hungarian agri-food import from EU15 by degree of processing, 1999-2008
0%
10%
20%
30%
40%
50%
60%
70%
80%
90%
100%
1999 2000 2001 2002 2003 2004 2005 2006 2007 2008 Primary (111) Primary (112) Primary (21) Processed (121) Processed (122) Processed (22)
Source: Own composition based on EUROSTAT (2011)
It can be concluded that the share of Hungarian agri-food trade with EU15, together with its nominal value, has grown after EU accession, though a smaller trade balance is realised in these markets. Product structure has remained relatively stable after accession regarding imports, though changed measurably regarding exports.
Specialisation of Hungarian agri-food trade
Before executing the calculations, it is worth analysing whether the Hillman-condition holds or else, the Balassa-index is inappropriate for measuring revealed comparative advantage. Following Marchese and de Simone (1989), the B indices calculated from our data set are found to be consistent with Hillman’s condition, thereby the B-index is suitable for measuring comparative advantage.
By analysing the Balassa-indices specified in the literature review, various patterns of Hungarian agri-food trade specialisation become visible (Table 3).
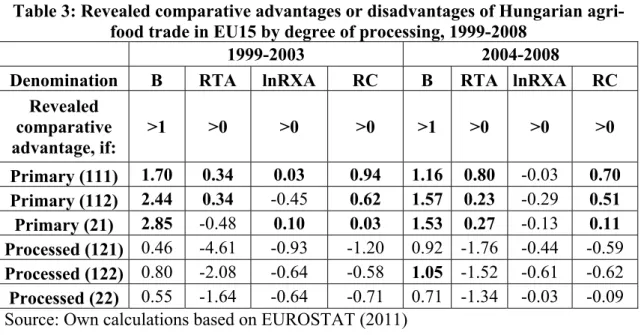
Table 3: Revealed comparative advantages or disadvantages of Hungarian agri- food trade in EU15 by degree of processing, 1999-2008
1999-2003 2004-2008
Denomination B RTA lnRXA RC B RTA lnRXA RC Revealed
comparative
advantage, if: >1 >0 >0 >0 >1 >0 >0 >0 Primary (111) 1.70 0.34 0.03 0.94 1.16 0.80 -0.03 0.70 Primary (112) 2.44 0.34 -0.45 0.62 1.57 0.23 -0.29 0.51 Primary (21) 2.85 -0.48 0.10 0.03 1.53 0.27 -0.13 0.11 Processed (121) 0.46 -4.61 -0.93 -1.20 0.92 -1.76 -0.44 -0.59 Processed (122) 0.80 -2.08 -0.64 -0.58 1.05 -1.52 -0.61 -0.62
Processed (22) 0.55 -1.64 -0.64 -0.71 0.71 -1.34 -0.03 -0.09 Source: Own calculations based on EUROSTAT (2011)
First of all, it can be clearly seen that primary agri-food products have a revealed comparative advantage in most cases in both sub-periods, while processed agri-food products lack such advantages. This argument is fully in line with previous research on the topic (Bojnec and Fertő, 2008). However, the extent of revealed comparative advantages/disadvantages has changed by accession, in a surprising way. Primary agri- food products show a slightly decreasing trend of revealed comparative advantages and revealed competitiveness after accession, while processed agri-food products have improved their comparative/competitive positions in EU15 markets. However, these changes are valid only to a marginal extent and it would be a mistake to exaggerate these trends.
Changes by individual BEC categories are also worth to be analysed. Though possessing the highest share in export and import values, processed products for household consumption (122) had a significant comparative/competitive disadvantage in most cases, while primary agri-food products, mainly for industry processing (111), had a weak comparative/competitive advantage in the majority of cases.
Variations were rather low inside sub-periods, suggesting rather stable patterns of trade (with small deviations between years) still after accession (Table 4). The variation of RCA indices does not show a clear pattern before and after accession, nor do that of the comparative advantages/disadvantages, as suggested in previous research (Fertő, 2008). Low variations underpin the argument of slight overall changes.
Table 4: Variation of revealed comparative advantages or disadvantages of Hungarian agri-food trade in EU15 by degree of processing, 1999-2008
1999-2003 2004-2008 Denomination
B RTA lnRXA RC B RTA lnRXA RC
Primary (111) 0.27 1.21 0.20 0.27 0.40 0.57 0.15 0.19 Primary (112) 0.22 0.49 0.06 0.07 0.16 0.11 0.20 0.26 Primary (21) 0.57 0.51 0.12 0.19 0.29 0.23 0.18 0.19 Processed (121) 0.26 1.50 0.33 0.46 0.36 0.67 0.26 0.31 Processed (122) 0.15 0.48 0.10 0.15 0.08 0.21 0.08 0.15 Processed (22) 0.20 0.50 0.20 0.21 0.33 1.21 0.14 0.29 Source: Own calculations based on EUROSTAT (2011)
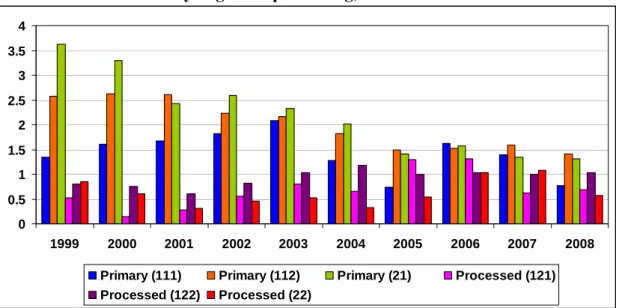
However, by analysing the distribution of B indices over time, major trends become more visible (Figure 4). On the one hand, it is apparent from Figure 4 that revealed comparative advantages of Hungarian primary agri-food products in EU15 trade were decreasing from 1999-2003 and remained almost constant thereafter. The largest decrease is observable in the case of primary agri-food products for industry processing (111). On the other hand, revealed comparative advantages of processed agri-food products has been gradually increasing by time and even reached the satisfactory level in some cases. Note that processed products for household consumption (122) had a value above one in each year after accession, indicating a slight comparative advantage in those products giving the majority of Hungarian agri- food exports in value terms.
Figure 4: The distribution of B indices of Hungarian agri-food trade with EU15 by degree of processing, 1999-2008
0 0.5 1 1.5 2 2.5 3 3.5 4
1999 2000 2001 2002 2003 2004 2005 2006 2007 2008
Primary (111) Primary (112) Primary (21) Processed (121) Processed (122) Processed (22)
Source: Own composition based on EUROSTAT (2011) Stability of revealed comparative advantages
In order to analyse the impacts of EU accession on Hungarian agri-food trade specialisation, the stability of RCA indices were calculated by using various methods.
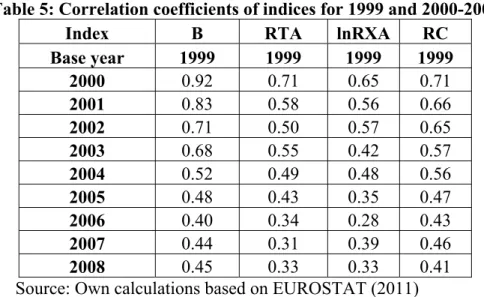
First of all, the correlation between each RCA index in time period t and subsequent time periods was determined. Using 1999 as a base year, results reveal that correlation
indices for 2000-2003 are relatively high, while that of 2004-2008 are relatively low and the overall trend is decreasing, indicating that EU accession resulted in a changing structure of comparative advantages after 2004 (Table 5).
Table 5: Correlation coefficients of indices for 1999 and 2000-2008
Index B RTA lnRXA RC
Base year 1999 1999 1999 1999
2000 0.92 0.71 0.65 0.71
2001 0.83 0.58 0.56 0.66
2002 0.71 0.50 0.57 0.65
2003 0.68 0.55 0.42 0.57
2004 0.52 0.49 0.48 0.56
2005 0.48 0.43 0.35 0.47
2006 0.40 0.34 0.28 0.43
2007 0.44 0.31 0.39 0.46
2008 0.45 0.33 0.33 0.41
Source: Own calculations based on EUROSTAT (2011)
In order to analyse how the structure of comparative advantages have changed after accession, stability of the B index was calculated by running a regression on the dependent variable, B index at time t2 (for sector i in country j), which is tested against the independent variable – the B index in year t1 (7).
Bijt2 = αi + βiB ijt1 + εij (7) where α and β are standard linear regression parameters and ε is a residual term. If β = 1, then this suggests an unchanged pattern of B between periods t1 and t2, meaning there is no change in the overall degree of specialization in Hungarian agri-food trade.
On the one hand, if β > 1, the existing specialization of Hungary is strengthened, meaning that a low level of specialization in the initial period leads to less specialization in the future, which is called β divergence (Bojnec and Fertő, 2008b).
On the other hand, if 0 < β < 1, commodity groups with low initial B indices grow over time, which is called β convergence (Bojnec and Fertő, 2008b). However, if β < 0, a change in the sign of the index is shown.
By using pooled data to estimate various lags for Equation 7, the resulting β values show that trade patterns have significantly changed after 2004 (Table 6). By running the model with only a single lag, the value of β was relatively high but increasing the number of time lags measurably decreases β values. The β/R ratios indicate that the pattern of revealed comparative advantage has converged, or in other words, low B values increased over time while high values decreased, resulting in despecialisation of Hungarian agri-food trade after accession.
Table 6: Stability of the B index between 2008 and 1999
Lags α β R2 R β/R N
1 0.239 0.784 0.696 0.834 0.940 6273
2 0.378 0.654 0.555 0.745 0.877 5576
3 0.489 0.561 0.436 0.660 0.850 4879
4 0.546 0.491 0.376 0.613 0.801 4182
5 0.615 0.405 0.288 0.536 0.755 3485
6 0.657 0.357 0.248 0.498 0.715 2788
7 0.736 0.304 0.192 0.437 0.694 2091
8 0.719 0.266 0.204 0.451 0.590 1394
Source: Own calculations based on EUROSTAT (2011) Note: Significant at all levels
Another type of analysing stability of the value of the B indices is by using Markov transition probability matrices to identify the persistence and mobility of B indices (Bojnec and Fertő, 2008b). By classifying products into two categories - products with revealed comparative disadvantage (B < 1) and products with revealed comparative advantage (B > 1) -, it can be demonstrated whether the revealed comparative advantage of Hungarian agri-food trade with EU15 has been lost or strengthened during the analysed period. Results suggest that B indices remained relatively stable in the period analysed as the probability of passing from one state to another from 1999 to 2008 was relatively low (Table 7).
Table 7: Markov transition probability matrix for B indices for Hungarian agri- food trade, 1999 and 2008
Category B<1 B>1 Total
B<1 96.76 3.24 100.00
B>1 19.86 80.14 100.00
Total 86.02 13.98 100.00
Source: Own calculations based on EUROSTAT (2011)
Products with revealed comparative export disadvantage (B < 1) shifted to a revealed comparative export advantage (B > 1) with very low probability, while in moving backward, chances were much higher. It is also apparent that the majority of products had a revealed comparative disadvantage in the period analysed and as Table 7 suggest, this situation has become even worse after accession – an unfavourable trend for Hungary.
Discussion and policy recommendations
An examination of the trade structures and trade patterns performed above suggests that export of Hungarian agri-food products increased after accession to a lesser extent than import of such products, in relation with EU15. What is more, national exports were even more specialised in low value-added primary agri-food products, while import was mainly based on higher value-added processed agri-food products. This suggests comparative disadvantage in agri-food trade for Hungary with EU15, basically due to the rapid emergence of vertically coordinated food chains including hypermarkets, supermarkets and multinational agro-processing companies with
regional procurement systems, thus creating new and much more competitive conditions for producers, processors and consumers.
In the past few years, Hungary has experienced a significant increase in the market share of foreign-origin products, generally sold at a lower price than national agri-food products. However, some of the cheap products on shelves can sometimes be of dubious quality due to use of the lowest cost raw materials and occasionally inappropriate ingredients. Agricultural producers and agri-food processors are not always able to adjust, or to cope with business practices employed by the large chains which are occasionally not entirely fair. The concentrated and Europe-wide procurement systems of the major chains create high requirements for suppliers and impose strong price pressures as well, especially for farmers and agri-food processors (Csaki and Jambor, 2010).
These impacts were strengthened the embedded inefficiencies of the Hungarian agri- food processing sector, causing hard times for the industry. In the past 20 years, the rather fragmented and mainly foreign-owned national food processing industry was anyway struggling with, inter alia, problems of over-capacities, lack of markets, inappropriate marketing techniques and inefficient as well as uncompetitive work management. The Hungarian food processing industry in the soviet era got accustomed to the lack of competition as all products, irrespective of their quality and price, could be sold. This created a market structure where several small and medium enterprises, lacking economies of scale, could prosper.
When Hungarian agri-food processing companies found themselves in the EU27 market, most of their original problems were deepened, causing many small and medium sized processors to go bankrupt. One of the biggest challenges facing the industry was (and still is) their increasing input costs (due to the rising prices of national raw materials and new standards coming with accession) together with their decreasing income (due to the increased price competition of retailers). Moreover, national taxes are well above the average of the EU15 (and also of the NMS region), causing several disadvantages to national companies in competition with their foreign counterparts.
On the whole, it is apparent that there is a need for deeper structural reforms of the Hungarian agricultural and food sector is the future. It should be recognised that the relationship between producers, processors and the market is undergoing a major shift.
Vertically organised food chains and the dramatically changing food trade are starting to dominate more and more. The most important tasks of the near future are as follows:
1. Effective food processing should be based on a competitive agricultural sector.
Therefore, competitiveness of national agriculture should be enhanced in order to provide competitive prices of raw materials for processors so that high value added agricultural products can appear on EU27 markets at a reasonable price.
2. Agricultural policy should help supporting the adaptation of agri-food producers and processors to make sure that they can fit in with the new market conditions. Relationships among market actors (producers, processors and retailers) in the supply chain should be strengthened in order to exploit possible synergies. Agricultural policies should also support horizontal cooperation
among producers and processors so as to ensure market access for their products.
3. Structural changes are needed in the national food processing industry by supporting investment for developing existing technologies and rural infrastructure in order to become competitive at the international level. Private and public investment of the agro-food industry and the development of modern supply chains can also improve farmers’ access to markets, technology, and inputs (including credit). These policies can be integrated in the rural development schemes of the countries, but also in national action plans.
Conclusions
The paper analysed the impacts of EU accession on Hungarian primary and processed agri-food trade and has reached a number of conclusions. First of all, by analysing structural changes in Hungarian primary and processed agri-food trade, it turned out that the share of Hungarian agri-food trade with EU15, together with its nominal value, has grown after EU accession, though a smaller trade balance is realised in these markets. Product structure has remained relatively stable after accession regarding imports, though changed measurably regarding exports. It was also demonstrated that Hungarian agriculture is increasingly based on raw material export and processed food import.
Second, by analysing trade specialisation for Hungarian agri-food trade, it was pointed out that primary agri-food products had a revealed comparative advantage in most cases after accession, while processed agri-food products was in lack of such advantages. Results show that processed products for household consumption (122), having the greatest share in national agri-food export and import, had a significant comparative/competitive disadvantage in most cases, while primary agri-food products, mainly for industry processing (111), had a weak comparative/competitive advantage in the majority of cases. It also turned out that revealed comparative advantages of Hungarian primary agri-food products in EU15 trade were decreasing from 1999-2003 and remained almost constant thereafter, while comparative advantages of processed agri-food products has been gradually increasing by time and even reached the satisfactory level in some cases. As to the stability of revealed comparative advantages, it turned out that EU accession resulted in a changing structure of comparative advantages after 2004. The pattern of revealed comparative advantage has converged, resulting in a despecialisation of Hungarian agri-food trade after accession.
Third, based on the analyses performed, discussion of results was given together with various policy recommendations. On the whole, it is apparent that there is a need for deeper structural reforms of the Hungarian agricultural and food sector is the future. It should be recognised that the relationship between producers, processors and the market is undergoing a major shift and agricultural policy should (1) enhance the competitiveness of national agriculture, (2) help supporting the adaptation of agri-food producers and processors and (3) support investment in the national food processing industry.
References
Balassa, B. 1965. Trade Liberalization and „Revealed” Comparative Advantage. The Manchester School, Vol. 33. pp. 99–123
Bojnec, Š. and Fertő, I. 2008a. Degree and pattern of agro-food trade integration of South-Eastern European countries with the European Union. In: Thomas Glauben, Jon H. Hanf, Michael Kopsidis, Agata Pieniadz, Klaus Reinsberg (eds.) Agri-Food Business: Global Challenges - Innovative Solutions, Studies on the Agricultural and Food Sector Vol. 46. Leibniz Institute of Agricultural Development in Central and Eastern Europe, Halle (Saale), pp. 118-133
Bojnec, Š. and Fertő, I. 2008b. European Enlargement and Agro-Food Trade.
Canadian Journal of Agricultural Economics, 56(4), pp. 563-579
Bojnec, Š. and Fertő, I. 2009. Determinants of agro-food trade competition of Central European countries with the European Union. China Economic Review, 20. (2). 327- 333
Csaki, Cs. and Jambor, A. 2010. Five Years of Accession: Impacts on Agriculture in the NMS. EuroChoices, 9(2), pp. 10-17
Eurostat 2011. http://epp.eurostat.ec.europa.eu/portal/page/portal/eurostat/home (accessed January 2011)
Fertő, I. 2008. The evolution of agri-food trade patterns in Central European countries.
Post-Communist Economies, 20(1), pp. 1-10
Hillman, A. L. 1980. Observations on the relation between Revealed Comparative Advantage and Comparative Advantage as indicated by Pre-Trade Relative Prices.
Weltwirtschaftliches Archiv, No. 116, pp. 315–321
Hinloopen, J. and van Marrewijk, C. 2001. On the Empirical Distribution of the Balassa Index. Weltwirtschaftliches Archiv, No. 137, pp. 1-35.
Hinloopen, J. and van Marrewijk, C. 2008. Empirical relevance of the Hillman condition and the comparative advantage: 10 stylized facts. Applied Economics, Vol.
40 (18), pp. 2313–2328.
Jambor, A. 2010. Intra-industry trade of Hungarian agricultural products and the EU- accession. Studies in Agricultural Economics. No. 111., pp. 95-114
Marchese, S. and de Simone, F.N. 1989. Monotonicity of indices of revealed comparative advantage: Empirical evidence on Hillman’s Condition.
Weltwirtschaftliches Archiv, No. 125, pp. 158–67
Vollrath, T. L. 1991. A Theoretical Evaluation of Alternative Trade Intensity Measures of Revealed Comparative Advantage. Weltwirtschaftliches Archiv, 130(2) pp. 265–279