* Corvinus University of Budapest, Hungary, email: judit.nagy@uni-corvinus.hu
** Corvinus University of Budapest, Hungary, email: zsofia.jambor@uni-corvinus.hu
JEL CLASSIFICATION: L62
ABSTRACT: Numerous studies handle analyses of revealed comparative advan- tages of global trade (especially in agricul- ture sector) using Balassa index, but the selected automobile industry represents new potentials to study. This study focuses on the competitiveness of automobile in- dustry, which is a key sector due to its high value-added activities, a competitive mar- ket, with increasing technology require- ments and high employment characteris- tics. The aim of our paper is to analyse the revealed comparative advantages of global automobile trade as well as the duration and stability of Balassa indices by apply- ing Markov transition probability matrices and Kaplan-Meier survival function. The source of data is global automobile exports at HS6 level for 1997-2016. The paper has reached numerous conclusions. First, by analysing characteristics of global automo- bile trade, it turned out that China, USA,
Japan and Germany were the biggest pro- ducers of cars, however the top exporters were Germany, Japan and Canada in the period analysed, together giving 40% of all products exported – the top10 countries, however, gave 71% of concentration. Sec- ond, our analysis has made it clear that the most traded/exported automobile product is vehicle with only sparkling ignition in- ternal combustion (1500-300cm3) (870323) globally, giving more than 40% of all vehicle exports between 1997 and 2016. Third, the calculation of Balassa indices showed that Spain and Japan had highest comparative advantages in all periods analysed among the most important automobile exporters in the world.
KEY WORDS: revealed comparative ad- vantage, automobiles, trade, stability, du- ration
https://doi.org/10.2298/EKA1818061N
Judit Nagy*
Zsófia Jámbor**
COMPETITIVENESS IN GLOBAL TRADE:
THE CASE OF THE AUTOMOBILE INDUSTRY
1. INTRODUCTION
In the modern world the topic of competitiveness has been a focus of attention for decades, and is based on numerous definitions, interpretations, and approaches. Competitiveness can be interpreted according to level; for example, it has been grouped according to micro, meso, and macro levels. Micro-level competitiveness exists at the firm level and is “the ability to produce products/services that people will purchase over those of competitors”
(Wijnands, Bremmers, Van Der Meulen and Poppe 2008, p.3). According to Domazet (2012, p.294–295), competitiveness “resides in the ability of firms to consistently and profitably produce products that meet the requirements of an open market in terms of price, quality, etc.” In summary, we can conclude that at the micro-level the meaning of competitiveness is very closely linked to the creation of dual value, a process that includes both the consumer’s and the owner’s value (Chikán 2008a, p.28). Meso-level competitiveness is mainly linked to regional competitiveness. According to Kitson, Martin, and Tyler (2004, p.992), “regional (and urban) competitiveness might be defined as the success with which regions and cities compete with one another in some way”. Gorton, Hubbard, and Fertő (2013, p.4) define regional competitiveness as “the ability to offer an attractive and sustainable environment for firms and residents to live and work”. Thus, meso-level competitiveness is situated between micro- and macro-level competitiveness and cannot be interpreted as the aggregation of several firms in a given area, but is a more complex phenomenon. Macro-level competitiveness, or national competitiveness, is “the capability of a national economy to operate ensuring the increasing welfare of its citizens and the sustainable growth of its factor productivity. This capability is realized through maintaining an environment for its companies and other institutions to create, utilize and sell goods and services meeting the requirements of global competition and changing social norms” (Chikán 2008b, p. 25).
According to Porter (1990), a nation’s competitiveness depends on four interconnected factors (diamond model): factor conditions, demand conditions, related and supporting industries, and firm strategy, structure, and rivalry.
‘Factor conditions’ refer to the labour pool, local raw material sources, and everything that is important for effective production. ‘Demand conditions’
cover the characteristics of demand for the end product in the domestic market:
if customer needs are sophisticated they can pressure companies to higher standards. ‘Related and supporting industries’ that are globally competitive constitute a stable background for downstream industries. They can supply
cost-effective, high-quality inputs and are sources of innovation. ‘Firm strategy, structure, and domestic rivalry’ can also determine a nation’s competitiveness.
National circumstances specify how a company is created; domestic traditions define management style; and domestic rivalry pressurizes firms to be cost effective, innovative, and customer-oriented. Domestic rivalry can be even greater when geographic concentration is high. In Porter’s opinion, government has a role in creating an environment in which companies can achieve competitive advantage. Direct state development programmes can only succeed in nations which are in the early stages of the development process.
The national level of competitiveness is strongly tied to international trade theory, which aims to explain why nations trade with each other. The most influential work in this area was by David Ricardo in 1817, who produced the theory whereby nations focus on the production and trade of products with comparative advantage.
As evident from the literature, there are various different methods for measuring competitiveness. Bhawsar and Chattopadhyay (2015) provide an excellent review on the different methods of measuring competitiveness. On the national level, competitiveness can be measured by national productivity, balance of trade, labour productivity, and foreign exchange rate. As our paper concentrates on trade-based macro-level competitiveness we have opted to use the Balassa index, which captures competitiveness through trade flows.
Based on the Ricardian theory of comparative advantage, Balassa (1965) created an index of revealed comparative advantage. This study analyses revealed comparative advantage in the global automobile trade, which, to the best to our knowledge, is currently missing from the literature. It contributes to the existing literature in three ways. First, it applies the theory of revealed comparative advantage to a key manufacturing industry. Second, it analyses a product which is economically important, as automobiles represent a key sector in the global economy. Third, the paper identifies the factors lying behind comparative advantage in car manufacturing.
The paper is structured as follows. After this short introduction, Section 2 presents a short review of the automobile sector, including the relevant empirical research. Section 3 describes the methodology and the data used.
Section 4 introduces the key findings regarding the global automotive trade’s descriptive statistics. Section 5 summarizes the patterns and stability of the
comparative advantage, presents the main conclusions, and lists future research possibilities.
2. LITERATURE REVIEW
In our paper we investigate the global competitiveness factors of the automotive industry and identify which countries have a comparative export advantage and what this advantage is based on.
In the past three decades there have been huge changes in both the organisation and the geography of production (Pavlinek 2015). The industry can be broken down geographically into the following regions: Europe (excluding Russia);
North America (Canada, USA, Mexico); Japan and South Korea; the BRICs (Brazil, Russia, India, China); and the rest of the world (RoW). In 2007 the BRICs and RoW accounted for approximately 30% of global profits, rising to 60% in 2012 (Mohr et al. 2013).
In the last decades the most important tendencies in the industry have been the introduction of modular production, a reduction in the number of direct suppliers, and organising the production network on a macro-regional scale (Pavlinek 2015). Different regions used to have different competitive potentials.
In North America, automotive manufacturers and their suppliers tended to cluster together in industrial cities such as Detroit, which was advantageous because of the strong local base of specialized suppliers (Krugman 1993;
Sturgeon, Van Biesebroeck and Gereffi 2008), while demand was also close.
Now North American car manufacturers can exploit low-cost production in Mexico, which is still close to the end market.
In Europe car manufacturers face fierce competition, which at the end of the 20th century forced them to expand into former socialist countries in Central and Eastern Europe. While Western European automakers kept innovation activity and high value-added production for themselves, the CEE region attracted manufacturers with its skilled workers, cheap wages, and close geographic proximity to Western European markets. Also, as living standards grew, Central and Eastern Europe became a relevant market (Pavlínek 2015;
Jürgen-Krzywdzinski 2009).
In the automotive industry, reaching economies of scale is a prerequisite for keeping production costs as low as possible. Therefore, many developing
countries try to protect the industry with direct or indirect import barriers and/or state-initiated development programmes, which is how the Japanese and South Korean automotive industries were established.
The Japanese car industry was developed after WWII. Thanks to its production methods, specific company structure, and state subsidies, exports to the USA rose from 300,000 cars in the 1960s to 11 million cars in the 1980s (Sturgeon et al. 2008). Dyer (1996) finds that Japanese automakers have more specialized suppliers than in the US, and Toyota assembly plants, for example, are geographically concentrated, which results in a more specialized and productive value chain than at Nissan or General Motors.
South Korea’s government-led economic development programme was one of the most successful. In 1962 South Korea introduced the Automotive Industry Protection Law, which prohibited the importation of complete cars but exempted parts and components. In the 1970s the oil crisis endangered the entire industry and the escape route was to restructure and reorient the industry and expand production to reach economies of scale. This was not feasible without exports, which South Korea targeted at the most lucrative market, the USA. At the end of the 20th century, Korea was selling 80% of its exports in the U.S. and was exporting half of the cars it manufactured (Green 1992).
In the early 1990s, India also started a state development programme for its automotive industry. The country has the advantage of a skilled and educated English-speaking workforce, but it also has poor infrastructure, a complicated tax structure, and inflexible labour laws, which outmatch the labour cost advantage (Narayanan-Vashisht 2008).
Chinese economic growth was driven by FDI and labour productivity growth, which were 1.5 times higher than in India. Car-makers and Tier 1 suppliers very quickly reached world standard; however, the lower stages (Tiers 2 and 3) are still below global standards. China also uses tariff and quota policies, coupled with local content regulation. The Chinese auto industry is very fragmented, the quality is low, and improvement is needed in technological and managerial skills (Narayanan-Vashisht 2008). However, internal demand for cars is increasing, the price of the final product is cost-competitive, and in 2012 half the global sales growth came from China (Mohr et al. 2013).
In the 1970s the Philippine automotive industry was also supported by the state, which implemented several development programmes (Aldaba 2007). Thanks to these, the Philippine automotive sector is competitive with other ASEAN countries in terms of product quality and delivery, but not in terms of price. A skilled and cheap workforce cannot offset the unavailability of raw materials (resulting in expensive imports), strong unions, strikes, and weak internal demand.
Although the Republic of South Africa is a relatively small market for automakers, the state recognised its potential and promoted exports through subsidies. Exports started to grow dynamically, new investors entered the industry, and the parts and components industry also grew. Thanks to the state’s development strategy the sector is competitive with Western Europe, except regarding delivery flexibility because of the large geographical distance (Barnes, Kaplinsky, and Morris 2004).
Porter’s ‘diamond’ model says that factors of competitive advantage depend on each other. From the previous synopsis we can see that nations try to exploit more than one factor at the same time. In North America, factor conditions, supporting industries, and domestic rivalry force companies to fight for competitive advantage. In Europe the drivers of competitive advantage are factor conditions, demand conditions, and supporting industries. Japan and South Korea have a strong supporting industrial base, specific and successful management methods, and considerable domestic demand, while domestic factors are also important. The BRICs and the RoW base their competitive advantage on factor conditions, while state programmes to develop supporting industries and domestic demand are tending to increase in these countries.
Previous empirical research on revealed comparative advantage in trade is vast and varies in scope and focus. Abidin and Loke (2008) examine Malaysian export data (for several sectors) and conclude that the country has a comparative advantage in electric, electronic, and machinery products but not in automobile goods. Cinicioglu, Önsel and Ülengin (2012) use the Bayesian network model to identify Turkey’s competitiveness. They find that the competitiveness of countries that develop technology is higher than that of countries that only buy technology. Spatz and Nunnenkamp (2002) analyse the revealed comparative advantage of Germany, Japan, and US as key automobile manufacturing countries globally, and conclude that globalisation negatively affected the comparative advantage of these countries, especially of the US.
3. METHODOLOGY
The paper is based on the revealed comparative advantage index, originally defined by Balassa (1965) as follows:
RCAij (1)
where X indicates exports, i means a given country, j is a given product, t is a group of products, and n stands for a group of countries. Consequently, the index can be calculated by comparing a given country’s export share of a certain commodity in its total exports with the export share of the commodity in total exports of a reference group of countries. If the value of the RCA index is higher than 1 the country has a comparative advantage compared to the reference countries; if it is 1 or lower it has a revealed comparative disadvantage.
The original index is criticised for many reasons, especially because of its asymmetry and because it neglects the various effects of economic policies. The problem of asymmetry stems from the fact that its value varies from only zero to one for products/sectors in which the country has a revealed comparative disadvantage, but from one to infinity for those with comparative advantage, thereby overestimating sectors’ relative weight. Moreover, government intervention – especially protectionist policies – strongly affects international trade and associated markets, but the RCA index does not measure this impact.
Vollrath (1991) suggested three other specifications of comparative advantage to solve the above problems. First, he introduced a revealed comparative advantage index for imports (RMA), substituting export values with import values in the original index as follows:
RMAij (2)
As opposed to the RCA index, RMA values below one mean comparative advantage, thereby solving the problem of asymmetry. The second index suggested by Vollrath (1991) is the revealed trade advantage index (RTA), which is a simple transformation of the first and second equations:
nt nj it
ij
X X X
X
nt nj it
ij
M M M
M
RTAij = RXAij – RMAij (3) Positive values here imply comparative advantage. Third, Vollrath (1991)
created a revealed competitiveness index (RC) by taking the natural log of the RCA and RMA indices as follows:
RCij = ln RXAij – ln RMAij (4)
The RC index is symmetric to zero and positive values mean revealed competitiveness. Dalum et al. (1998) also tried to solve the asymmetric value problem of the original Balassa index and created the Symmetric Comparative Advantage (RSCA) index:
(5) The RSCA takes values between –1 and 1, where positive values indicate a
comparative advantage in exports, and values between –1 and 0 a comparative disadvantage.
Proudman and Redding (1998) suggested weighting the original Balassa index by the number of products (N) as follows:
(6)
Following their idea, if the value of a product’s RCA index is higher than the RCA index for all products, country j has a comparative advantage in product i.
Hoen and Oosterhaven (2006) provided another transformation of the original index:
(7)
where ARCA is the additive revealed comparative advantage index, with values above zero meaning a comparative advantage. Research by Yu, Cai, and Leung
1
/ 1
B B
RSCA
Nj ij
ij ij
N RCA WRCA RCA
1
1
1 ( ( ))
ij ij
i ij
ij X X
ARCA X
(2009) and by Yu, Cai, Loke, and Leung (2010) adopts an alternative measure to analyse the dynamics of comparative advantage, the Normalised Comparative Advantage (NRCA) index, defined as follows:
(8)
where Xij represents actual exports and stands for the comparative-average-neutral level in exports of commodity j for country i. If NRCA > 0, a country’s comparative advantage in the world market is positive.
As well as calculating static comparative advantage indices we also measure stability and duration, following the logic of Bojnec and Fertő (2008). First, Markov transition probability matrices are calculated to analyse the stability of the SRCA index, evaluating the mobility of revealed comparative advantage across space and time. In addition, Bojnec and Fertő (2008) use the non- parametric Kaplan-Meier product limit estimator as a measure of the duration of indices. According to Bojnec and Fertő, a sample contains n independent observations (denoted as ti; ci), where i = 1, 2, . . . , n; ti is the survival time, while ci is the censoring indicator variable C of observation i (C = 1 if a failure occurred, and 0 otherwise). Moreover, it is assumed that there are m < n times recorded failures. Then we denote the rank-ordered survival times as t(1) < t(2)
< … < t(m), nj indicates the number of subjects at risk of failing at t(j), and dj
denotes the number of observed failures. The Kaplan-Meier estimator of the survival function is then (with the convention that ˆS(t) = 1 if t < t(1)):
(9)
This paper employs global automobile trade data from the World Bank’s World Integrated Trade Solution database. Data was retrieved at the HS-6 level for all countries of the world from 1997 to 2016 for nine products (see product list in the Appendix).
Note that the methodology presented above has a number of limitations. First, the trade data is not totally trustworthy, for a number of reasons: disaggregated values might not add up; missing value problems exist; data varies by
i iijj ijj
2ijij j i
ij
ij EE X
X E X E X E E
NRCA X
EiXij
EjXij
j j j t i
t n
d t n
S
()
) ˆ(
classification; and export and respective import values for the same destination might not be equal. Second, Balassa-based indices are sensible to zero values.
Third, database cleaning might result in the loss of useful information. Fourth, for space and correlation reasons the paper mainly concentrates on the presentation of the original Balassa index. Last but not least, the phenomenon of double counting appears. Double counting arises during Balassa index calculation when a given export product is also part of a group of export products and when the analysed country belongs to a given group of countries.
The solution would be to exclude the analysed item from the group when calculating. As, in our case, the analysed products and countries appear in the selected groups of products and countries with a marginal ratio, we have made an exception and not changed the original indices.
4. DESCRIPTIVE STATISTICS
The automotive industry is one of the most globalised industries. It successfully recovered from the economic crisis, and industry profits were 31% higher in 2012 than in the last pre-crisis year, 2007 (Mohr et al. 2013). According to WTEx (Workman 2018) information, in 2016 the automobile industry led in terms of exports, exceeding even crude oil earnings (due to relatively low oil prices). According to the news4business website (2017), in 2017 it grew globally, with automobile companies and their supplier networks having a record income. Based on Forbes’ 2017 Global 2000 ranking report, the world’s top ten automobile and truck companies (in terms of production) are as follows: Toyota Motor (Japan), Volkswagen Group (Germany), Daimler (Germany), Ford Motor (United States of America), BMW Group (Germany), General Motors (Unites States of America), Honda Motor (Japan), Hyundai Motor (South Korea), Nissan Motor (Japan), and SAIC Motor (China) (Schmitt 2017). New trends in the car business are clearly defined as electric cars, safety requirements, environmental regulations, and increasing focus on emerging markets.
Regarding the production of cars and commercial vehicles, the top ten countries are China (annual production of more than 28 million vehicles in 2016), the USA, Japan, Germany, India, South Korea, Mexico, Spain, Canada, and Brazil (OICA.net 2017), representing more than 77% of global personal and commercial vehicle production.
As for global automobile trade, Germany, Japan, and Canada were the biggest exporters in the period analysed, together constituting 40% of all exports, while the top ten countries comprised 71% of the concentration (Table 1): together Germany, Japan, Canada, the USA, South Korea, the United Kingdom, Spain, Belgium, France, and Mexico represented 81.74%, 73.19%, 68.82%, and 68.37%
of total global automobile product exports for the periods 1997–2001, 2002–
2006, 2007–2011, and 2012–2016, respectively (WITS 2017).
Thus, the top producers of automobiles are not necessarily the top exporters.
The top-ranking exporters are countries that have less domestic need for cars than their annual production. Consequently, if they want to sustain production and economies of scale they need to export. Huge car producers like China and India have a fast-developing market and can sell most of their automobile products domestically.
Table 1: Top 10 automobile exporters in the world, 1997–2016, by country (in 1000 US$)
Country 1997–2001 2002–2006 2007–2011 2012–2016 1997–2016 Germany 60,717,149 98,579,229 132,868,350 152,165,113 111,082,460
Japan 52,791,714 76,034,334 92,713,321 91,127,746 78,166,779 Canada 31,289,701 34,929,224 33,830,236 45,720,822 36,442,496 U.S.A. 16,166,998 24,146,296 38,645,973 53,265,488 33,056,189 South Korea 10,352,495 22,697,598 32,172,230 42,140,865 26,840,797
U K 14,164,343 21,230,890 27,232,504 38,095,704 25,180,860 Spain 16,344,542 23,035,898 28,507,158 30,984,570 24,718,042 Belgium 10,739,725 26,517,532 27,716,977 29,586,107 23,640,085 France 19,224,543 31,027,391 24,624,749 18,832,853 23,427,384 Mexico 12,974,355 13,829,225 21,065,940 31,642,182 19,877,926 Concentration 81.74% 73.19% 68.82% 68.37% 71.20%
Note: Countries are listed in decreasing order based on their 1997–2016 averages.
Source: Own calculation based on WITS (2017) data.
On a product basis, the category of vehicles with spark-ignition internal combustion reciprocating piston engines and a cylinder capacity between 1500cc and 3000cc comprised 40% of global automobile exports in the period
analysed (Figure 1). This category was followed by over-3000cc cars (code 870324), accounting for another 20% of global exports. Third came diesel engines between 1500cc and 2500cc (code 870332), with another 20%. All in all, these three categories constituted more than 80% of global automobile exports, implying a high rate of concentration.
Figure 1: Top 10 automobile exports in the world, 1997–2016, by product (%)
Note: See detailed product codes and meanings in the Appendix.
Source: Own calculation based on WITS (2017) data.
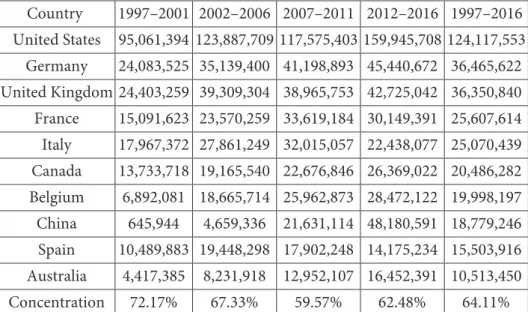
As for global automobile imports, the vast majority of automobile exporters are also importers of the same product (Table 2). The USA, for instance, which was the 4th major exporter of automobiles, was also by far the leading importer of cars (Table 2). Germany, the United Kingdom, France, Canada, Belgium, and Spain were also among the top ten exporters and importers of automobiles, showing signs of intra-industry trade. Italy, China, and Australia are not top exporters but take a large share of total global imports. Note that the concentration of the 10 biggest car importers was 72%, 67%, 59%, and 62% in the respective sub-periods analysed (WIT, 2017).
0%
10%
20%
30%
40%
50%
60%
70%
80%
90%
100%
1997‐2001 2002‐2006 2007‐2011 2012‐2016 1997‐2016 870310 870321 870322 870323 870324
870331 870332 870333 870390
Table 2: Top 10 automobile importers in the world, 1997–2016, by country (in 1000 US$)
Country 1997–2001 2002–2006 2007–2011 2012–2016 1997–2016 United States 95,061,394 123,887,709 117,575,403 159,945,708 124,117,553
Germany 24,083,525 35,139,400 41,198,893 45,440,672 36,465,622 United Kingdom 24,403,259 39,309,304 38,965,753 42,725,042 36,350,840 France 15,091,623 23,570,259 33,619,184 30,149,391 25,607,614 Italy 17,967,372 27,861,249 32,015,057 22,438,077 25,070,439 Canada 13,733,718 19,165,540 22,676,846 26,369,022 20,486,282 Belgium 6,892,081 18,665,714 25,962,873 28,472,122 19,998,197 China 645,944 4,659,336 21,631,114 48,180,591 18,779,246 Spain 10,489,883 19,448,298 17,902,248 14,175,234 15,503,916 Australia 4,417,385 8,231,918 12,952,107 16,452,391 10,513,450 Concentration 72.17% 67.33% 59.57% 62.48% 64.11%
Note: Countries are listed in decreasing order based on their 1997–2016 averages.
Source: Own calculation based on WITS (2017) data.
5. COMPARATIVE ADVANTAGE – PATTERNS AND STABILITY
Calculating the Balassa indices (Table 3) reveals the specialisation of the global automobile trade. Spain and Japan had the highest comparative advantage in all periods analysed, suggesting high potential competitiveness France, Canada, and Germany also had relatively high comparative advantage in global automobile exports, while similar numbers for other analysed countries varied significantly. Mexico, despite being one of the biggest global automobile exporters, generally had low comparative advantage.
Table 3: Original Balassa index for the most important global automobile exporters, 1997–2016
Country 1997–2001 2002–2006 2007–2011 2012–2016 1997–2016 Germany 1.15 1.18 1.25 1.54 1.28
Japan 1.85 2.03 1.76 1.42 1.77 Canada 1.43 1.18 1.17 1.39 1.29 USA 0.67 0.94 1.26 1.19 1.01 South Korea 1.17 1.16 0.95 0.92 1.05 UK 0.81 0.77 1.12 1.39 1.02 Spain 3.70 2.39 2.47 2.35 2.73 Belgium 0.92 1.20 1.12 1.31 1.14 France 1.26 1.55 1.37 1.22 1.35 Mexico 0.56 0.62 0.92 1.35 0.86 Source: Own calculation based on WITS (2017) data
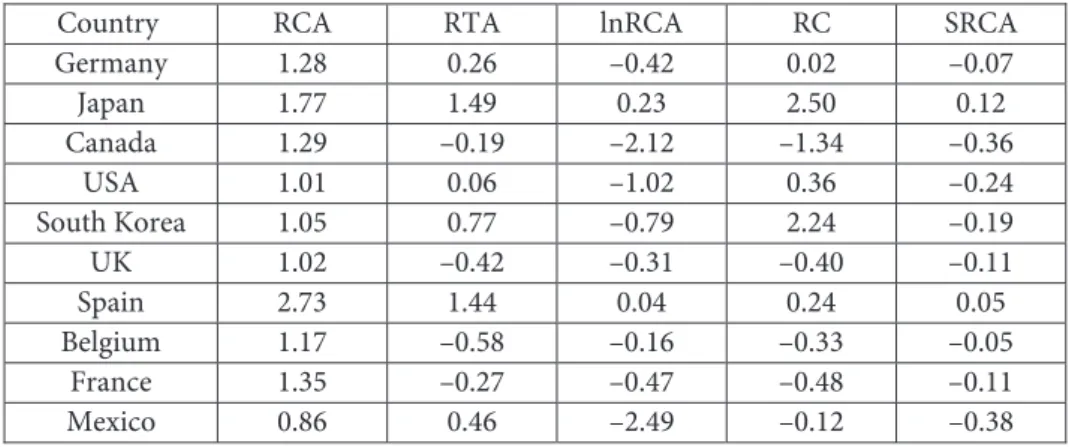
However, results vary significantly by the method used (Table 4). Only Japan and Spain had a comparative advantage in all period and all indices. According to the RTA index, and similar to the lnRCA and SRCA indices, Japan and Spain were the countries with the highest comparative advantage. However, the RC index found Japan and South Korea to be the most competitive nations in the global automobile trade.
Table 4: Balassa-based indices for the most important global automobile exporters, 1997–2016
Country RCA RTA lnRCA RC SRCA Germany 1.28 0.26 –0.42 0.02 –0.07
Japan 1.77 1.49 0.23 2.50 0.12 Canada 1.29 –0.19 –2.12 –1.34 –0.36
USA 1.01 0.06 –1.02 0.36 –0.24 South Korea 1.05 0.77 –0.79 2.24 –0.19 UK 1.02 –0.42 –0.31 –0.40 –0.11 Spain 2.73 1.44 0.04 0.24 0.05 Belgium 1.17 –0.58 –0.16 –0.33 –0.05
France 1.35 –0.27 –0.47 –0.48 –0.11 Mexico 0.86 0.46 –2.49 –0.12 –0.38 Note: WRCA, ARCA, and NRCA indices gave inconsistent results for our sample and therefore are omitted.
Source: Own calculation based on WITS (2017) data.
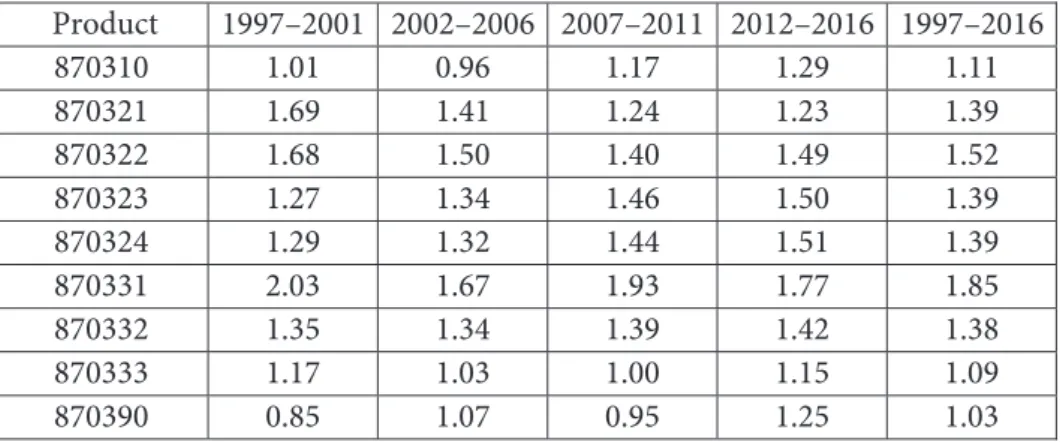
At the product level, diesel engine cars below 1500cc capacity (870331) were the product with the highest competitive potential globally, followed by vehicles with only spark-ignition internal combustion reciprocating piston engines and a cylinder capacity of 1000cc–1500cc (870322). These types of car were mainly produced in Spain and Japan, respectively.
Table 5: The original Balassa index for the most important global automobile products, 1997–2016
Product 1997–2001 2002–2006 2007–2011 2012–2016 1997–2016 870310 1.01 0.96 1.17 1.29 1.11 870321 1.69 1.41 1.24 1.23 1.39 870322 1.68 1.50 1.40 1.49 1.52 870323 1.27 1.34 1.46 1.50 1.39 870324 1.29 1.32 1.44 1.51 1.39 870331 2.03 1.67 1.93 1.77 1.85 870332 1.35 1.34 1.39 1.42 1.38 870333 1.17 1.03 1.00 1.15 1.09 870390 0.85 1.07 0.95 1.25 1.03
Note: Product names in the Appendix.
Source: Own calculation based on WITS (2017) data.
The degree of mobility in the SRCA index is estimated by using Markov transition probability matrices (Figure 2). The results show a relatively low mobility of the SRCA index for the global automobile trade in most of the countries, suggesting stable competitive potential. Seven countries maintained a comparative advantage in more than 70% of product groups, while the UK, South Korea, and Spain had the lowest mobility measures, implying heavy competition in the sector.
Figure 2: The mobility of the SRCA index, 1997–2016, by country, %
Source: Own calculation based on WITS (2017) data.
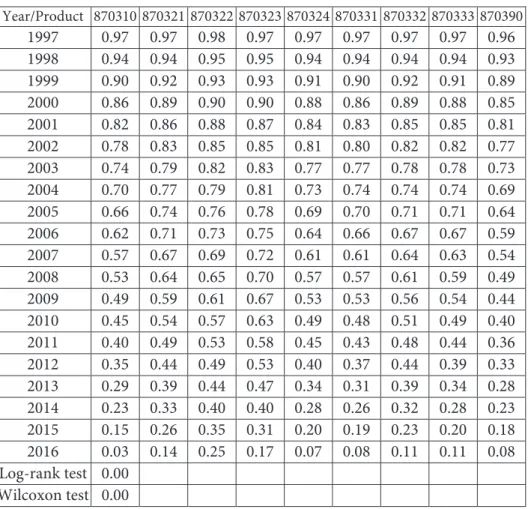
The non-parametric Kaplan-Meier product limit estimator (Equation 9) was estimated to determine the duration of revealed comparative advantage in global automobile exports. The results confirm that, in general, survival times are inconsistent over the period analysed (Table 6 & Table 7). Survival chances of 98% at the beginning of the period fell to 7%–26% by the end of the period, suggesting fierce competition in the global automobile trade. The results vary by country (Table 6) – Germany, the UK, and Belgium had the highest survival times – and by product group (Table 7) – the highest survival times were for cars with 1000–1500cc (870322) and 1500–3000 cc (870323) petrol engines.
64% 66% 68% 70% 72% 74% 76%
USA Belgium France Germany Japan Canada Mexico Spain South Korea UK
Table 6: Kaplan-Meier survival rates for Balassa indices and tests for equality of survival function in global automobile trade, by country, 1997–2016
Year/ Country Survivor function Germany Japan Canada USA South Korea UK Spain Belgium France Mexico
1997 0.97 0.97 0.98 0.96 0.96 0.97 0.97 0.98 0.98 0.97 0.97 1998 0.94 0.94 0.96 0.92 0.92 0.94 0.94 0.96 0.97 0.94 0.93 1999 0.91 0.92 0.94 0.89 0.88 0.91 0.91 0.94 0.96 0.91 0.89 2000 0.88 0.90 0.93 0.85 0.84 0.88 0.88 0.92 0.93 0.88 0.85 2001 0.85 0.88 0.92 0.81 0.80 0.86 0.83 0.91 0.90 0.85 0.81 2002 0.81 0.86 0.91 0.77 0.76 0.83 0.77 0.89 0.87 0.82 0.77 2003 0.78 0.83 0.90 0.73 0.72 0.80 0.73 0.86 0.84 0.79 0.73 2004 0.74 0.80 0.88 0.68 0.67 0.78 0.70 0.83 0.82 0.76 0.68 2005 0.71 0.77 0.86 0.64 0.64 0.75 0.67 0.80 0.80 0.73 0.63 2006 0.67 0.73 0.85 0.59 0.60 0.72 0.63 0.76 0.78 0.69 0.58 2007 0.63 0.69 0.83 0.55 0.56 0.68 0.60 0.73 0.75 0.65 0.53 2008 0.59 0.64 0.81 0.50 0.54 0.64 0.57 0.69 0.71 0.61 0.48 2009 0.55 0.60 0.77 0.46 0.50 0.58 0.55 0.65 0.67 0.57 0.44 2010 0.50 0.56 0.75 0.42 0.46 0.53 0.51 0.58 0.63 0.53 0.39 2011 0.46 0.52 0.71 0.37 0.42 0.48 0.47 0.52 0.60 0.49 0.35 2012 0.41 0.47 0.66 0.32 0.38 0.43 0.44 0.46 0.56 0.45 0.32 2013 0.36 0.43 0.59 0.27 0.33 0.37 0.41 0.40 0.51 0.40 0.29 2014 0.30 0.42 0.48 0.21 0.27 0.28 0.38 0.34 0.43 0.34 0.24 2015 0.22 0.39 0.35 0.14 0.19 0.21 0.33 0.24 0.34 0.27 0.19 2016 0.11 0.31 0.15 0.05 0.09 0.07 0.26 0.11 0.23 0.15 0.08 Log-
rank
test 0
Wilco xon
test 0
Source: Own calculation based on WITS (2017) data.
Table 7: Kaplan-Meier survival rates for Balassa indices and tests for equality of survival function in global automobile trade, by product, 1997–2016 Year/Product 870310 870321 870322 870323 870324 870331 870332 870333 870390
1997 0.97 0.97 0.98 0.97 0.97 0.97 0.97 0.97 0.96 1998 0.94 0.94 0.95 0.95 0.94 0.94 0.94 0.94 0.93 1999 0.90 0.92 0.93 0.93 0.91 0.90 0.92 0.91 0.89 2000 0.86 0.89 0.90 0.90 0.88 0.86 0.89 0.88 0.85 2001 0.82 0.86 0.88 0.87 0.84 0.83 0.85 0.85 0.81 2002 0.78 0.83 0.85 0.85 0.81 0.80 0.82 0.82 0.77 2003 0.74 0.79 0.82 0.83 0.77 0.77 0.78 0.78 0.73 2004 0.70 0.77 0.79 0.81 0.73 0.74 0.74 0.74 0.69 2005 0.66 0.74 0.76 0.78 0.69 0.70 0.71 0.71 0.64 2006 0.62 0.71 0.73 0.75 0.64 0.66 0.67 0.67 0.59 2007 0.57 0.67 0.69 0.72 0.61 0.61 0.64 0.63 0.54 2008 0.53 0.64 0.65 0.70 0.57 0.57 0.61 0.59 0.49 2009 0.49 0.59 0.61 0.67 0.53 0.53 0.56 0.54 0.44 2010 0.45 0.54 0.57 0.63 0.49 0.48 0.51 0.49 0.40 2011 0.40 0.49 0.53 0.58 0.45 0.43 0.48 0.44 0.36 2012 0.35 0.44 0.49 0.53 0.40 0.37 0.44 0.39 0.33 2013 0.29 0.39 0.44 0.47 0.34 0.31 0.39 0.34 0.28 2014 0.23 0.33 0.40 0.40 0.28 0.26 0.32 0.28 0.23 2015 0.15 0.26 0.35 0.31 0.20 0.19 0.23 0.20 0.18 2016 0.03 0.14 0.25 0.17 0.07 0.08 0.11 0.11 0.08 Log-rank test 0.00 Wilcoxon test 0.00
Source: Own calculations based on WITS (2017) data.
The equality of the survival function is checked using Wilcoxon and log-rank tests. The results show that the hypothesis of equality across survivor functions can be rejected at all levels of significance, meaning that similarities in the duration of comparative advantage across the most important global automobile exporters are absent (Tables 6 and 7).
Last but not least, following Widodo (2009) and Lafay (1992), this paper uses product maps based on Balassa indices and the Trade Balance Index (TBI) to
calculate the dynamics of export specialisation. The TBI index is defined as follows (Lafay 1992):
(10) where X means exports, M means imports, and i indicates a given country.
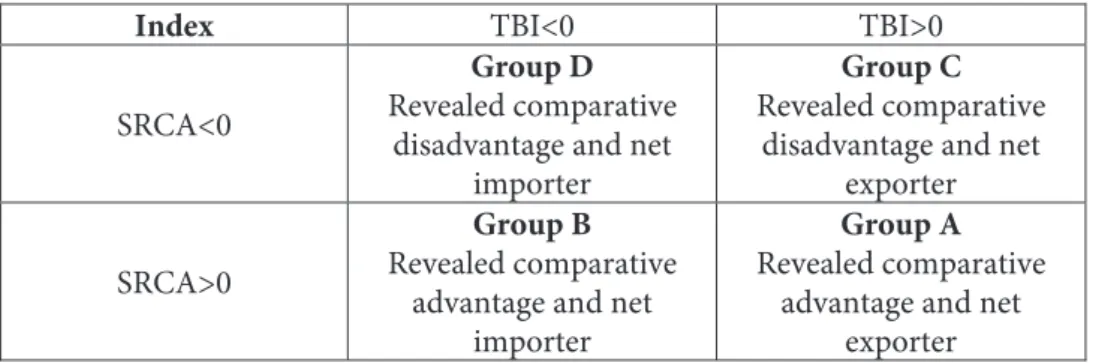
Using the method of Widodo (2009), Balassa indices and the TBI index can be matched to create a product map based on a simple matrix (Table 8). Using these maps in time allows for the analysis of trade patterns in a dynamic context.
Table 8: Product map categories
Index TBI<0 TBI>0
SRCA<0
Group D Revealed comparative
disadvantage and net importer
Group C Revealed comparative
disadvantage and net exporter SRCA>0
Group B Revealed comparative
advantage and net importer
Group A Revealed comparative
advantage and net exporter
Source: Own composition based on Widodo (2009).
Due to the large number of products and countries, an alternative way of visualizing the product maps is used here, counting the frequencies of products that belong to the four groups mentioned in Table 8 and comparing them to the total number of observations. Thus, the percentage of products belonging to each category becomes apparent.
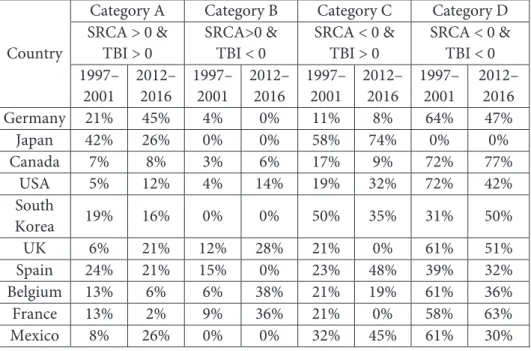
We find that most of the products of the biggest global automobile exporters belong to Category A or D, suggesting a high share of cases where a country exports (imports) products with a comparative advantage (disadvantage) (Table 9). However, there are huge differences between countries in this respect.
Almost every second German car exported in 2012–2016 had a comparative advantage, while this share was only 2% for France and 6% for Belgium.
Moreover, 77% of Canadian cars with comparative disadvantage were imported, while this was only 30% for Mexico (and 0% for Japan).
Xi Mi
Xi Mi
TBI /
There are also large differences in the other two categories of the product maps.
Almost 75% of Japanese automobile products were classified as Category C, meaning that they were exported without any comparative advantage, suggesting a very offensive strategy in the global market. At the other end of the spectrum, France and Belgium had a high and increasing share of Category B products, suggesting that almost a third of such cars were imported, despite these countries having a comparative advantage in car manufacture. On the whole, there is a general trend of German, British, and Mexican products having improved comparative advantage and potential, while cars from the Asian market appear to have suffered from a loss of competitiveness recently.
Table 9: Product map of top ten automobile exporters in the world, 1997–2016
Country
Category A Category B Category C Category D SRCA > 0 &
TBI > 0
SRCA>0 &
TBI < 0
SRCA < 0 &
TBI > 0
SRCA < 0 &
TBI < 0 1997–
2001 2012–
2016 1997–
2001 2012–
2016 1997–
2001 2012–
2016 1997–
2001 2012–
2016
Germany 21% 45% 4% 0% 11% 8% 64% 47%
Japan 42% 26% 0% 0% 58% 74% 0% 0%
Canada 7% 8% 3% 6% 17% 9% 72% 77%
USA 5% 12% 4% 14% 19% 32% 72% 42%
South
Korea 19% 16% 0% 0% 50% 35% 31% 50%
UK 6% 21% 12% 28% 21% 0% 61% 51%
Spain 24% 21% 15% 0% 23% 48% 39% 32%
Belgium 13% 6% 6% 38% 21% 19% 61% 36%
France 13% 2% 9% 36% 21% 0% 58% 63%
Mexico 8% 26% 0% 0% 32% 45% 61% 30%
Source: Own composition based on Widodo (2009).
6. CONCLUSIONS
This paper analyses the global trade competitiveness of automobile production, paying special attention to exports. The paper reaches a number of conclusions.
First, analysis of the characteristics of the global automobile trade shows that China, the USA, Japan, and Germany were the biggest producers of cars.
However, in the period analysed the top exporters were Germany, Japan, and
Canada, together producing 40% of all exports, while the top ten countries provided 71% of the concentration. On the other hand, the USA, Germany, and the United Kingdom were the biggest importers, mainly for the purpose of re- exporting. Second, our analysis revealed that globally the most traded/exported automobiles were vehicles with spark-ignition internal combustion engines (1500–3000cc) (870323), comprising more than 40% of all vehicle exports between 1997 and 2016. Third, the calculation of Balassa indices showed that of the most important automobile exporters in the world, Spain and Japan had the highest comparative advantage in all periods analysed. Analyses using the various indices showed similar results. According to RTA, lnRCA, and SRCA indices, Japan and Spain had the largest comparative advantage in automobile production; however, the RC index found Japan and South Korea to be the most competitive. The relatively low mobility of the SRCA index for the global automobile trade for most of the countries suggests stable competitive potential.
Regarding the duration of revealed comparative advantage in global automobile exports in general, the survival times are inconsistent over the period analysed, and their decline suggests fierce competition in the global automobile trade.
Future research might investigate why Japan and Spain are so competitive, which requires a thorough investigation of Japanese and Spanish automobile production and export strategies.
REFERENCES
Abidin, M. Z., & Loke, W. H. (2008). Revealed comparative advantage of Malaysian exports: the case for changing export composition. Asian Economic Papers, 7(3), pp. 130–147. DOI: 10.1162/
asep.2008.7.3.130
Aldaba, R. M. (2007). Assessing the competitiveness of the Philippine auto parts industry. (No.
2007–14). PIDS Discussion Paper Series.
Bhawsar, P., & Chattopadhyay, U. (2015). Competitiveness: review, reflections and directions.
Global Business Review, 16(4), pp. 665–679. DOI: 10.1177/0972150915581115
Balassa, B. (1965): Trade Liberalization and Revealed Comparative Advantage. The Manchester School, 33, pp. 99–123. DOI: 10.1111/j.1467-9957.1965.tb00050.x
Barnes, J., Kaplinsky, R., & Morris, M. (2004). Industrial policy in developing economies:
Developing dynamic comparative advantage in the South African automobile sector. Competition
& Change, 8(2), pp. 153–172. DOI: 10.1080/1024529042000271416
Bojnec, Š., & Fertő, I. (2008). European Enlargement and Agro-Food Trade. Canadian Journal of Agricultural Economics, 56(4), pp. 563–579. DOI: 10.1111/j.1744-7976.2008.00148.x
Chikán, A. (2008a). Vállalatgazdaságtan. Aula Kiadó, Budapest.
Chikán, A. (2008b). National and firm competitiveness: a general research model. Competitiveness Review: An International Business Journal, 18(1–2), pp. 20–28. DOI: 10.1108/10595420810874583 Cinicioglu, E. N., Önsel, S., & Ülengin, F. (2012). Competitiveness analysis of automotive industry in Turkey using Bayesian networks. Expert Systems with Applications, 39, pp. 10923–10932. DOI:
10.1016/j.eswa.2012.03.032
Dalum, B., Laursen, K., & Villumsen, G. (1998). Structural Change in OECD Export Specialisation Patterns: de-specialisation and ‘stickiness’. International Review of Applied Economics, 12(3), pp.
423–443. DOI: 10.1080/02692179800000017
Domazet, T. (2012). Regional cooperation striving for competitiveness and finance. Ekonomika Preduzeća, 60(5–6), pp. 290–300. DOI: 10.5937/ekopre1206290D
Dyer, J. H. (1996). Specialized supplier networks as a source of competitive advantage: Evidence from the auto industry. Strategic Management Journal, 17(4), pp. 271–291. DOI: 10.1002/
(SICI)1097-0266(199604)17:4<271::AID-SMJ807>3.0.CO;2-Y
Green, A. E. (1992). South Korea’s automobile industry: Development and prospects. Asian Survey, 32(5), pp. 411–428. DOI: 10.2307/2644974
Gorton, M., Hubbard, C., & Fertő, I. (2013). Theoretical background and conceptual framework.
Halle: Leibniz Institute of Agricultural Development in Transition Economies (IAMO), working paper, pp. 1–48.
Hoen, A. R., & Oosterhaven, J. (2006). On the measurement of comparative advantage. Annals of Regional Science, 40(3), pp. 677–691. DOI: 10.1007/s00168-006-0076-4
Jürgens, U., & Krzywdzinski, M. (2009). Changing east–west division of labour in the European automotive industry. European Urban and Regional Studies, 16(1), pp. 27–42. DOI:
10.1177/0969776408098931
Kitson, M., Martin, R., & Tyler, P. (2004). Regional Competitiveness: An Elusive yet Key Concept?
Regional Studies, 38(9), pp. 991–999. DOI: 10.1080/0034340042000320816
Krugman, P. & Venables, A. (1993). Integration, specialization and adjustment. National Bureau of Economic Research. Working paper #4559. pp. 1–32.
Lafay, G. (1992). The Measurement of Revealed Comparative Advantages. In M.G. Dagenais and P.A. Muet (Eds.), International Trade Modeling, Chapman & Hill, London.
Mohr, D., Müller, N., Krieg, A., Gao, P., Kaas, H. W., Krieger, A., & Hensley, R. (2013). The road to 2020 and beyond: What’s driving the global automotive industry? McKinsey&-Company (Pub.), Automotive & Assembly–Latest thinking, available online at https://www.mckinsey.com/~/
media/mckinsey/dotcom/client_service/Automotive%20and%20Assembly/PDFs/McK_The_
road_to_2020_and_beyond.ashx, 1–25.
Narayanan, B. G., & Vashisht, P. (2008). Determinants of competitiveness of the Indian Auto Industry. Indian Council for Research on International Economic Relations, Working Paper, 201.
News4business website (2017). Roland Berger: Rekord bevételt könyvelhettek el 2017-ben a globális autóipari beszállítók. Retrieved from: http://www.news4business.hu/kozlemenyek/press_release.
php?id=35481 Downloaded 17.01.2018
OICA.net (2017). 2016 Production statistics. Retrieved from: http://www.oica.net/category/
production-statistics/2016-statistics/ Downloaded 11.04.2018.
Pavlínek, P. (2015). Foreign direct investment and the development of the automotive industry in central and eastern Europe. In: Galgóczi, B., Drahokoupil, J., & Bernaciak, M. (Eds.), Foreign investment in eastern and southern Europe after 2008. Still a lever of growth? Brussels: ETUI, 209–
255.
Porter, M. E. (1990). Competitive advantage of nations. Harvard Business Review, 68(2), pp. 73–93.
Ricardo, D. (1817). The principles of political economy and taxation. New York: Macmillan, 1909.
Schmitt, B. (2017). World’s Largest Automakers: Renault-Nissan Outranks Volkswagen, Could Pass
#1 Toyota. Forbes. Retrieved from: https://www.forbes.com/sites/bertelschmitt/2017/05/30/worlds- largest-automakers-renault-nissan-outranks-volkswagen-could-pass-1-toyota/#afdcd25e51ab Downloaded 10.11.2017.
Spatz, J., & Nunnenkamp, P. (2002). Globalization of the automobile industry: traditional locations under pressure? Kiel Working Paper, 1093, pp. 1–51.
Sturgeon, T., Van Biesebroeck, J., & Gereffi, G. (2008). Value chains, networks and clusters:
reframing the global automotive industry. Journal of Economic Geography, 8(3), pp. 297–321. DOI:
10.1093/jeg/lbn007
Vollrath, T. L. (1991). A theoretical evaluation of alternative trade intensity measures of revealed comparative advantage. Weltwirtschaftliches Archiv, 130(2), pp. 263–279. DOI: 10.1007/
BF02707986
Widodo, T. (2009). Comparative advantage: theory, empirical measures and case studies. Review of Economic and Business Studies, 4, pp. 57–81.
Wijnands, J. H. M., Bremmers, H. J., Van Der Meulen, B. M. J., & Poppe, K. J. (2008). An economic and legal assessment of the EU food industry’s competitiveness. Agribusiness, 24(4), pp. 417–439.
DOI: 10.1002/agr.20167
Workman, D. (2018). Car Exports by Country. World’s Top Exports website. Retrieved from http://
www.worldstopexports.com/car-exports-country/ on 30.03.2018.
World Integrated Trade Solution (WITS) database (2017). World Bank. Open access on the Internet: https://wits.worldbank.org/ Downloaded 05.10.2017.
Yu, R., Cai, J., & Leung, P. S. (2009). The normalized revealed comparative advantage index.
Annals of Regional Science, 43(1), pp. 267–282. DOI: 10.1007/s00168-008-0213-3
Yu, R., Cai, J., Loke, M. K., & Leung, P. S. (2010). Assessing the comparative advantage of Hawaii’s agricultural exports to the US mainland market. Annals of Regional Science, 45(2), pp. 473–485.
DOI: 10.1007/s00168-009-0312-9
Received: June 25, 2018 Accepted: August 20, 2018
APPENDIX
Automobile product codes and associated descriptions at HS6 level
870310 Vehicles specially designed for travelling on snow, golf cars and similar vehicles 870321 Vehicles with only spark-ignition internal combustion reciprocating piston engine, cylinder capacity not over 1000cc 870322 Vehicles with only spark-ignition internal combustion reciprocating piston engine, cylinder capacity over 1000 but not over 1500cc 870323 Vehicles with only spark-ignition internal combustion reciprocating piston engine, cylinder capacity over 1500 but not over 3000cc 870324 Vehicles with only spark-ignition internal combustion reciprocating piston engine, cylinder capacity over 3000cc 870331 Vehicles with only compression-ignition internal combustion piston engine (diesel or semi-diesel), cylinder capacity not over 1500cc
870332 Vehicles with only compression-ignition internal combustion piston engine (diesel or semi-diesel), cylinder capacity over 1500 but not over 2500cc
870333 Vehicles with only compression-ignition internal combustion piston engine (diesel or semi-diesel), cylinder capacity over 2500cc 870390 Vehicles for transport of persons (other than those of heading no. 8702) n.e.c. in heading no. 8703
Source: Own composition based on World Bank database (2017).