Final version:
http://www.mnmk.ro/documents/2013-01/1-3-1-13.pdf
Citation:
Kenesei, Zs. - Gyulavári, T. – Seer, L. (2013): The Role of Marketing in Corporate Competitiveness: Marketing Practice Analysis of Hungarian Companies, Management &
Marketing, 11 (1), pp. 7-28., ISSN: 1841-2416.
THE ROLE OF MARKETING IN CORPORATE
COMPETITIVENESS: MARKETING PRACTICE ANALYSIS OF HUNGARIAN COMPANIES
Associate Professor PhD Zsófia KENESEI Corvinus University Budapest, Hungary
Email: zsofia.kenesei@uni-corvinus.hu
Assistant Professor PhD Tamás GYULAVÁRI Corvinus University Budapest, Hungary Email: tamas.gyulavári@uni-corvinus.hu
PhD Candidate László SEER Corvinus University Budapest, Hungary Email: laszlo.seer@uni-corvinus.hu
Abstract:
The objective of this article is to analyse the marketing practice of Hungarian companies. On the one hand, the role of marketing function in the company has been revealed, and on the other hand the relationship between marketing efforts and market performance has been investigated. In frame of the Hungarian Competitiveness Studies, 300 marketing executives were surveyed to rate the marketing practice of their companies, concentrating on branding, pricing policy, applied marketing channels and promotional activities. The results confirm that sophisticated marketing practice leads to higher business performance.
Keywords: marketing tools, competitiveness, performance 1. Introduction
A great many conditions can be identified in an economy that can have effects on the practice and the standards of marketing. Besides these there are several development indicators, cultural and societal factors, which exhibit a significant dispersion on an international scale and can have an impact on marketing. These external factors are constantly changing and along with them the role of marketing activity alters, as well.
In our research program called ‘In Global Competition’ we had the possibility to track these changes and (based on the present snapshot) to examine what the current situation of marketing practice at Hungarian companies was.
Primary data for testing our hypotheses were collected via questionnaire survey among 300 companies and within in each company four managers responsible for different functions were asked to participate. As far as it was possible, the company’s
general manager, its marketing manager, financial manager and production manager administrated distinct questionnaires concerning their special field. This study focuses on data regarding marketing function.
First of all, the objective of this article is to explore the role of marketing at a firm and its connections to other functions. Secondly, this study focuses on marketing tools that companies use, and explores the relationships between them and the performance of companies. Our focus in this research is the question whether the marketing practice of leading companies differs from those of laggards or not? We will analyse the contribution of branding, pricing, distribution strategy and advertising policies to the performance of the companies involved. Throughout the analysis, results of the present study will be contrasted with the ones of the same research from 2004, making it possible to compare and to assess the development of marketing practice of Hungarian firms.
2. Competitiveness Research
The Hungarian Competitiveness Research Center conducted its first research in 1996 and since then it is the fourth time that similar method and questionnaire have been used to assess the competitiveness of Hungarian companies. The main goal of these research projects is to investigate how strategies and operations of companies contribute to their competitiveness in the global economy.
As we are dealing with competitiveness research in case of companies, the need for an integrated understanding of the concept is rather important. The definition that we accepted states as follows: "Firm competitiveness is a capability of a firm to sustainably fulfil its double purpose: meeting customer requirements and realizing profit. This capability is realized through offering goods and services for the market which are valued higher by customers than those offered by competitors." (Chikán, 2008, p. 24.). However, in the literature there are some attempts to integrate the antecedents of this concept into the definition. Because of its complex modes of action, these attempts had been less fortunate. The factors influencing each other and their contribution to competitiveness cannot be commonly defined. On the other hand, because of the dynamic nature of this system, it is difficult to mark on which of the corporate processes we should focus on with our analysis. The investigation of the Competitiveness Research Center therefore concentrates on the wide variety of corporate processes, which enable us to analyse the impact on the performance in separate and parallel ways.
Data collection was carried out between May and November 2009 and a 13%
response rate was achieved. In frame of our research, questionnaire-based interviews were conducted with 300 companies and within each company managers responsible for four organizational areas (the CEO, marketing, financial and production executives) answered separate standardized questionnaires. Two thirds of the sample consisted of companies with more than 50 employees since some of the research questions were only relevant for them.
As the data collection in 2009 was the fourth phase of the research series, we had the opportunity to compare the current results to the previous ones. For this comparison we used primarily data from 2004 however it is worth noting that the two samples of companies in frame of the multiple-cross sectional research slightly differ in terms of composition as firms with less than 50 employees were measured only in the last research phase in 2009.
The questionnaire used in the research also included questions regarding general characteristics of companies besides the ones inquiring their marketing practices. In our analysis we concentrated on size, ownership, export orientation, market
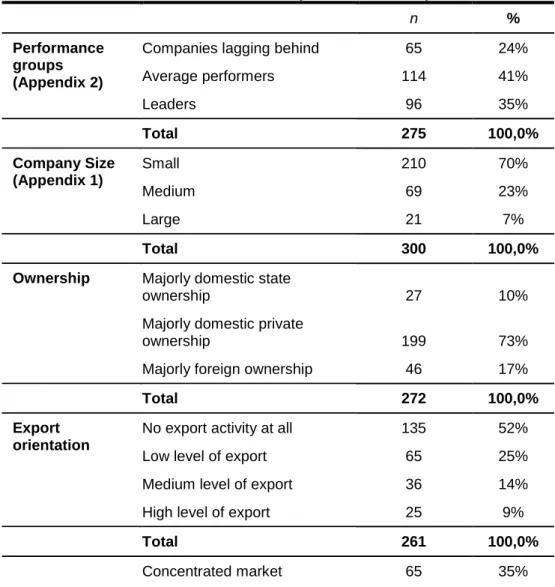
concentration and ability of reacting to market changes. Table 1 describes the firms investigated and summarizes the distribution of these attributes.
In our investigation we characterize the corporate performance with an artificially created variable which has three levels: laggards, average performers and leaders.
We formed this variable based on characterizations given by senior managers of their own company. In this characterization they determined the performance of the company compared to the industry, based on profit, return of investment, market share, technology level, management and aspects of product quality. Using cluster analysis the three groups mentioned above were found in the following distribution:
24%, 41% and 35% (Appendix 2 provides more details). The questionnaires contained mainly 5-point Likert-scales and relationships were explored by applying ANOVA tests comparing means of the evaluations. Our main dependent variable throughout the analysis was the generated performance variable mentioned above.
Table 1 The characteristics of companies in the sample
n %
Performance groups (Appendix 2)
Companies lagging behind 65 24%
Average performers 114 41%
Leaders 96 35%
Total 275 100,0%
Company Size (Appendix 1)
Small 210 70%
Medium 69 23%
Large 21 7%
Total 300 100,0%
Ownership Majorly domestic state
ownership 27 10%
Majorly domestic private
ownership 199 73%
Majorly foreign ownership 46 17%
Total 272 100,0%
Export orientation
No export activity at all 135 52%
Low level of export 65 25%
Medium level of export 36 14%
High level of export 25 9%
Total 261 100,0%
Concentrated market 65 35%
Market concentration
Moderately concentrated
market 72 39%
Fragmented market 48 26%
Total 185 100,0%
3. The perceived role of marketing in corporate success
The role of marketing function has been investigated since the emergence of the concept (Bund et al., 1957). This continuous interest has resulted in several researches that proved the importance of marketing function in company performance (Webster, 1992; Sarkees et al., 2010; Cespedes,1990; Conant et al., 1990; Harrison et al., 2007; Homburg et al., 1999; Menon et al., 1996; Moorman and Rust, 1999). On the basis of these researches, it is rational to assume that the corporate function, which is the most closely related to the market, is also the most important one. Based on this assumption our first research question was whether the perception of the firms’ managers was consistent with this view, and whether there is a difference in the perception of the different areas?
3.1. The overall assessment of the role of marketing
According to the surveys conducted by the Competitiveness Research Center, commercial and marketing activity had always been considered one of the most important corporate functions by senior and marketing executives. In a survey performed five years before it was ranked 4th among the factors examined by marketing executives, just as it appeared in the survey conducted in 2009 (Appendix 3.). It was an interesting result that senior executives (general managers, executive managers) considered the marketing function more important than marketing executives because they ranked it 3rd right before cost management. It is also worth mentioning that sales similarly to the results obtained 5 years before, was considered the second most important field after senior management. The sales function is closely related to the marketing activity of the company and in practice often providing the sales function is the most important task of marketing departments. These results are in accordance with the results of Homburg et al. (1999), who found that marketing and sales are relatively influential compared to other roles within the company. In particular marketing is the most influential function in terms of strategic direction.
Compared to the situation five years ago, there also happened some small changes in the evaluation of functions regarding ranking, however the most important ones have not changed. Mostly the importance of the accounting field has risen by six positions. Payroll management and logistics have improved by three, finances and the handling/controlling of stored goods by two positions in the ranking.
Compared to the situation from five years ago marketing executives now give less importance to research & development, which was rated fourth in the ranking. This function occupies the last position in the present ranking. Strategic planning, controlling and quality assurance have also dropped by three positions.
In total we can summarize that the decreased importance of these areas is due to the appearance of the crisis because for at least some of the companies the survival is the main goal, therefore corporate functions with a long term impact gain relatively less priority.
3.2. The relationship of commercial and marketing functions with other corporate areas
According to the marketing concept in the coordination of corporate functions, market orientation has to prevail therefore marketing must have a greater impact on other corporate activities (Kotler and Keller, 2011). We examined how marketing executives see this to prevail within their own companies.
Among the results the most conspicuous one is that marketing function practically has the same impact on other corporate functions as these on the marketing function (Table 2). In practice this interdependence is reciprocal.
Marketing is connected mostly with production and least with research &
development (R&D). We might conclude that it is probably a Hungarian peculiarity that research & development activities of multinational companies are not carried out in Hungary therefore it is not development but production by which Hungarian marketing activity is affected the most.
Table 2 The reciprocal impact of marketing and other corporate functions according
to marketing executives Impact of marketing
function on other functions (mean)
Other functions impact on the marketing
function (mean)
Differen ce
Production 3.84 3.84 0.00
Finance 3.40 3.66 -0.26
Logistics 3.29 3.38 -0.09
Information-
management 3.27 3.32 -0.05
Human resources 3.13 3.10 0.03
R & D 2.98 2.93 0.05
Scale: 1 – the effect is negligible; 5 – the effect has a determining nature
Although the relationship between marketing and R&D seems to be poor in case of Hungarian companies, it is evident that leading companies’ marketing efforts have higher impact on R&D. This can imply that in the case of leading companies the commercial/marketing function influences the trend of R&D on a greater than average scale. This result confirms the commonly accepted principle that cooperation between commercial/marketing and R&D functions allows a higher level customer demand satisfaction thereby it can increase the market performance of the company (Table 3).
Table 3 The effect of the commercial and marketing function on the company’s R&D
activity based on corporate performance
Performance Impact of the marketing function on the company’s R&D activity (Mean)
Laggards 2.85
Average performers 2.69
Leaders 3.39
Total 2.98
p < 0.05; Scale: 1 – the effect is negligible; 5 – the effect has a determining nature
4. The effect of marketing tools on competitiveness
Having discussed the perceived role of marketing function within the organisation, we now go on to reveal the extent to which marketing tools influence their market success. The effects of the marketing mix elements on brand equity were explored by Yoo et al. (2000). The research investigated five marketing mix activities and proved that frequent price promotions have a negative effect on brand equity, while high advertising expenditure, high price and high distribution density are examples of brand building activities.
From the items of the marketing mix we will highlight branding, pricing principles, the type of distribution channels used and advertising activity. These tools make an essential contribution to the efficiency of marketing work and based on our prior assumptions also to the corporate competitiveness.
4.1. The branding practice of companies
Brand management is a determining area of product policy, which also helps to make products distinctive. The extent to which the company uses the toolset of branding strongly influences its efficiency in competition (Simon and Sullivan, 1993). This is even more accurate in case of consumer markets however its effects can be detected also in case of business customers (Kotler and Pfoertsch, 2006). Contrary to our expectations, the situation which was found five years ago has not changed by the growing spread of branded products but exactly the opposite way. The proportion of companies which produce dominantly branded products (which distribute branded products in a proportion of 90-100%) has dropped from 35% to 21%, while the proportion of companies which distribute predominantly non-branded products (which distribute no-branded products in a proportion of 0-10%) has risen from 34% to 43%
(Figure 1). There can be more factors behind this drop, inter alia the tendency that companies produce private label products as suppliers, instead of producing their own branded products.
n (2004) = 185 ; n (2009) = 204
43%
36%
21%
34%
31%
35%
0% 10% 20% 30% 40% 50%
0-10%
11-89%
90-100%
2004 2009
Figure 1. Share of branded products on the most important market of the company
The practice of branding is most common in case of companies with foreign ownership, obviously because of the more sophisticated application of marketing.
State-owned companies are profiting the least from the opportunities of branding.
Not only the ownership, but also the sector can significantly influence branding practice. Based on common considerations (Kotler and Keller, 2011) we can assume that in those sectors where the amount of undifferentiated mass products is significant, branding gains less emphasis than on differentiated product markets.
Accordingly the proportion of branded products has to be smaller in the agricultural and construction industries than in the manufacturing, engineering, commercial and services industries. Based on the data we can state that the extractive, energy, construction and the agricultural industries use the possibility of branding the least while commerce, chemical and engineering industries use it the most. When branding is used as kind of a marketing-benchmark, marketing gains a greater importance in these industries.
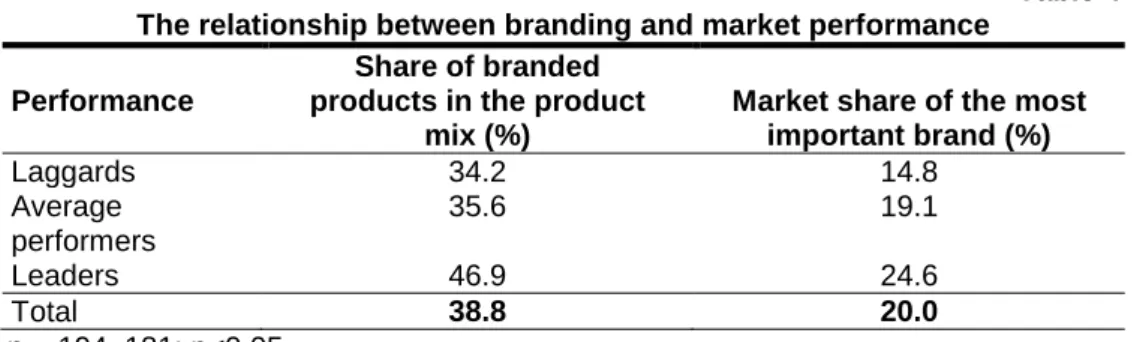
From the point of view of our focus of analysis, it is important to examine the connections between branding practice and corporate competitiveness. Table 4 shows that „leaders” carry on a much significant branding policy, than “laggards” and
“average performers”. Companies which pursue stronger branding can achieve better market positions in the course of competition (Table 4).
Table 4 The relationship between branding and market performance
Performance
Share of branded products in the product
mix (%)
Market share of the most important brand (%)
Laggards 34.2 14.8
Average performers
35.6 19.1
Leaders 46.9 24.6
Total 38.8 20.0
n = 194, 181; p<0.05
The results indicate that 42% of the companies do not have any branded products while in our research conducted 5 years ago only 33.7% could not mention a branding strategy followed. Before discussing the analysis of brand types, we should take a look at which companies do not use branding at all. By sectors it is probably not surprising that these cases can be primarily found in the agricultural (72%), extractive (75%) and construction (71%) industries. It is a more interesting result that services use branding relatively seldom (55% of them do not brand). This is probably due to a fragmented supply structure, which is typical of the significant part of these companies, therefore branding would be a significant investment. The most powerful branding can be found in the commerce industry where only 22% of the companies declared that they do not use any kind of branding strategies. This obviously does not mean that they apply their own brand name, but the fact that in their product range branded products gain a major role. This supports our assumption that it is typical of trade companies to distribute „branded products of other companies” to much greater extent (42%) than the total sample (20.8%).
Concerning branding strategies, different types of branding can be followed. In our analysis based on literature (Keller et al., 2012) four types are differentiated:
corporate branding, product branding, corporate and product branding, co-branding.
In case we reduce our focus of analysis to branding strategies of those companies which apply any kind of branding, we can avoid bias produced by data of the companies which do not do branding. Therefore our sample size for the next part of the analysis will be 138 companies.
Based on this data we can state that more than 50% of the sample companies use their own company name as an independent brand (Table 5), while the practice of independent product branding is typical for nearly third of the sample. The co-use of the corporate brand and the product brand is quite rare (18.8%), as well as common branding (11.6%). During our further analysis we are going to seek answers to the question whether different branding practices could differ along the companies’
characteristics, competitiveness and their market conditions
Table 5 The distribution of branding strategy types of the analysed companies
Branding strategy %
Corporate branding 52.9
Product branding 35.5
Corporate and product branding 18.8
Co-branding 11.6
n = 138
As for the branding strategies, corporate brand usage is a preferred marketing tool primarily in case of food manufacturers and service providers while product branding is more common in the engineering, chemical and light industries.
An important condition of applying marketing tools is measurement. There is a possible measuring point of branding efficiency which is brand value. In this respect, the questionnaire filled out by financial executives contains information. The number of companies which deal with measuring their own brand value consists 26% of the sample. Within the group companies which also use this information in the decision process can be separated. They already give only 13.6% of the sample (Table 6).
Table 6 The proportion of companies measuring brand value
Brand value measurement %
Do not measure it 73.6
Do measure it 12.7
Measure it and use it in decisions 13.6 n = 220
Having examined this part of the sample thoroughly, we observe that companies measuring brand value can be described mostly by their efficiency in competition, namely competition leaders use brand value measurement to a much greater extent than average performers (Table 7). Very few laggards apply brand value measurement. On this basis it can be concluded that brand value measurement is an important step in ensuring competitiveness: companies which are able to create, consciously manage branded products and measure their efficiency, can gain significant competitive advantage.
Table 7 Relationship between the existence of brand value measurement among
branded product owner companies and the market performance
Performance Measuring brand value
(%)
Laggards 16
Average performers 42
Leaders 46
Total 38
n = 108, p < 0.05 4.2. Pricing
Company pricing is one of the most direct sources of corporate profitability, and thereby of competitiveness as well. In the interpretation of competitiveness not surprisingly price paid by consumers leading to profitability is an integral part of the concept (Chikán and Czakó, 2009). Colloquially speaking, by competitive prices we understand lower prices. But by our definition of competitiveness, regarding prices, concentrates on higher profitability. As it can be seen in Figure 8, the prices of leading companies are not lower, but they even have higher price ranges. These results reinforce the findings of Yoo et al. (2000) that higher prices lead to stronger brands which results higher profitability.
On the one hand, this can mean that they have the quality and customer relations by which they can enforce their prices on the market. On the other hand, it can also mean that these companies have more room regarding pricing therefore they can react in a better way to market challenges.
Table 8 Relationship between the market performance and the price level of its main
product/service compared to competitor (%) Price level (%)
Performance Low Medium High
Laggards and average performers 15,3 76.4 8.3
Leaders 7,8 70.1 22.1
Total 12,7 13.3 14.0
n = 236; p<0.05
The simplest way of pricing is cost-based pricing because companies usually have the appropriate data for it. Earlier results indicate however that corporate managers are aware of the importance of prices, but they still would not choose to use more complex, skill-requiring pricing methods. Based on the pricing practice analysis of 77 industrial companies Ingelbleek et al. (2003) concluded that the success of new products can be facilitated if the company forms the price of the product using the perceived value of the customers. This effect is particularly strong in a lowly competitive environment and greater product advantage. They advise that competitor-based pricing should be used on markets where product differentiation prevails.
Table 9 The average proportion of the usage of information during pricing at
companies
Pricing strategy %
Costs 55.3
Competitors’ price 23.2
Customers’ reservation price 21.5 n = 252
Companies in our sample primarily rely on their costs when determining the prices (to an average extent of 55.3%), while they take the other two factors into account to a smaller extent (Table 9). According to our analysis, however, this does not influence corporate performance despite the fact that averagely higher proportion of laggards makes decisions on the basis of costs, although this difference is not statistically significant.
In recession time it is price-based marketing tools which come into perspective, therefore the possibility of price war-like phenomenon increases. However it’s interesting to see that companies primarily react to such activities of their competitors not by price-based means (Table 10). The application of price campaigns and promotions come in the row only after communication and quality improvements of additional services.
Among companies based on performance groups, only in one instance, in case of applying the above mentioned price promotions was possible to detect a significant difference. The laggard companies intend not to apply this tool the main cause of which could be the fact that among leading companies as we have already seen there are generally in a higher proportion those which sell their products in higher price categories therefore they can manoeuvre in discounts.
Table 10 The probability of answer given to possible price-related challenges of
competitors
Price related answers to competitors price cut Mean We try to strengthen the advantage/prestige of the
product/brand, and – as a result – to defend it 3.57 We defend by raising the standard of additional services 3.42 We try to offset this effect with price-discounts and promotions
until a certain level 3.36
We try to reduce its effect with rapid product innovation 3.08 If necessary, we enter into an open „price war” 2.81 We don’t react because thanks to our former activity our
customers are not flexible to our competitors’ price discounts 2.33
We don’t react, we tolerate the losses 2.12
n = 252-256; Scale: 1 = not likely at all, 5 = very likely
4.3. Distribution channels
It is an important part of a company’s marketing activity where and on how many points it allows access to its products. Research results suggest the importance of this element of the marketing mix, also pointing out that in many cases the formation of distribution channels affects the performance of the marketing activity (Ataman et al., 2010; Bronenberg et al., 2000).
During the competitiveness research the importance of distribution channels was analysed from different viewpoints from which we emphasize the role of distribution intensity. Distribution is intensive when products and services are placed in a large number of stores or in different access points. The distribution strategy of a company depends on several factors but we find probable that the more sales points it sells its products, the more consumer oriented it can be considered. At the same time we assume that it will perform better in the competition (Ataman et al., 2010). We tested this hypothesis in two ways: on the one hand we analysed the access points relative to competitors and on the other hand by the company’s own sales possibilities. Our respondents assessed whether their competitors could be characterized by a more powerful sales activity than the company surveyed. From the results we can state that in most cases the number of sales points is the same, but leading companies provide more access points to their products for their customers (Table 11).
Table 11 How many access points does the company’s product/service have compared
to its competitors (%)
Access points compared to the competitors (%)
Performance Less Same number More
Laggards 30.0 54.4 15.8
Average performers 8.0 72.0 20.0
Leaders 8.0 63.6 28.4
Total 13.1 64.9 22.0
n = 245; p<0.01
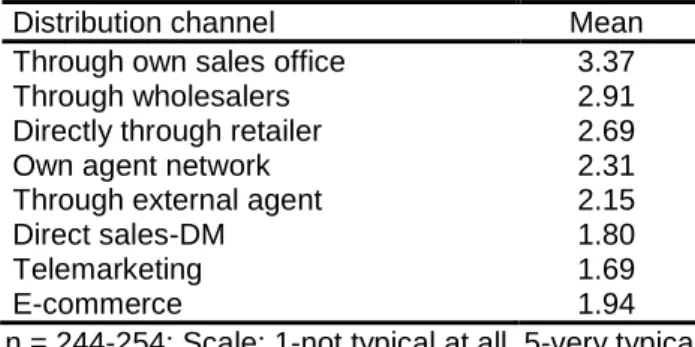
If we also analyse what distribution channels they choose, it can be outlined that their own corporate sales have a crucial importance followed by wholesale and retail.
The use of agents and other non-physical channels gains lower importance in the sales strategies of Hungarian companies (Table 12).
Table 12 Specific distribution channels in the process of delivering products/services
to end-users
Distribution channel Mean
Through own sales office 3.37
Through wholesalers 2.91
Directly through retailer 2.69
Own agent network 2.31
Through external agent 2.15
Direct sales-DM 1.80
Telemarketing 1.69
E-commerce 1.94
n = 244-254; Scale: 1-not typical at all, 5-very typical
The type of the chosen distribution channel can be influenced by several factors (customer composition, sector, nature of product etc.) However, the decision regarding the number of ways in which the company can reach out to the customers can be more likely the specific feature of marketing activity standards. Summarizing the different types, we get an aggregated value with the help of which we can characterize how many intermediaries the company uses in order to get to the final customers.
Our preliminary assumption is that the more types are used, the more successful the company gets in the competition. This assumption has been confirmed as there is a significant relationship between the two variables (Table 13).
Table 13 The effect of the diversity of distribution channels on the company’s market
performance
Performance Diversity of distribution channels*
Mean
Laggards 17.0
Average performers 18.8
Leaders 19.8
Total 18.7
(*variable created by summarizing the values of distribution channels) n=178, p<0.05
Bauer and Agárdi (2011) showed that regarding distribution channels companies can be characterized in four ways. Companies using:
- their own sales office, - wholesalers and retailers, - agents or,
- non-physical channels.
We investigated weather companies vary in their market performance across these four channel types. We came to the conclusion that significant association can be identified only along the fourth one that is in case of usage of non-physical channels.
In this context we can conclude that leading companies are those who strongly use these distribution channels (Table 14). This also can be an opportunity for companies because this way their competitiveness can increase.
Table 14 The effect of the usage of non-physical channels on market performance
Performance Non-physical channels*
Mean
Laggards 3.5
Average performers 3.9
Leaders 4.6
Total 4.0
(*average of DM, telemarketing & e-commerce) n = 180; p<0.05
4.4. Advertising activity of companies
The main function of advertising is to build brand equity through product differentiation (Boulding et al., 1994). There are several evidences that advertising does build brand equity (Villarejo-Ramos et al., 2005) and thus increases firms’
profitability.
Advertising activity can be measured in several ways. In our research we analyse changes in the companies’ advertising expenditure, their applied principles behind determining advertising budgets and we also analyse how advertising costs are split between different cost-centres.
Based on the results we can state that compared to our survey conducted five years ago, advertising budgets in terms of revenue increased significantly (Figure 2). This, of course, can be explained by the combined effect of two factors, namely the actual amounts spent on advertising and sales decline. Despite this growth of their advertising budget, companies participating in the research feel that proportionately they spend less on this field than their competitors. This obviously perceptual difference occurs in a significant way in all our prior competitiveness analyses;
therefore we can state that the perception of corporate marketing professionals regarding competitor’s advertising expenditure is systematically distorted.
2004: n own = 238, n competitor = 142; 2009: n own = 215, n competitor = 148 Figure 2. Advertising expenditure as a percentage of the revenue
The proportion of companies not spending at all on advertising is 9.3% and those stating the minimum amount (1% or less) account for 41% of the total sample. This indicates that in case of many companies advertising has not been incorporated in everyday practice, even if we define the term of advertising expenditure very broadly (advertising, sales promotion, direct marketing, sponsorship). So, not only do they not spend on TV or newspaper ads (which are not adequate tools for many companies) but they do not even try to communicate with their customers in any way (regardless whether they are active in the B2B or B2C markets).
We investigated which companies are more active in terms of advertising and in conclusion we can state that bigger, more active and successful companies have a
3,2%
5,3%
7,0%
9,0%
0,0%
1,0%
2,0%
3,0%
4,0%
5,0%
6,0%
7,0%
8,0%
9,0%
10,0%
Own company Competitor
2004 2009
more significant advertising activity (Table 15). This confirms our prior assumption that the proper application of marketing practice is an important condition of remaining competitive and of achieving the leading position.
We also made another interesting observation in the process of our data analysis:
less competitive companies and those who are less able to keep up with market changes also perceive that they have smaller advertising expenditure than their competitors. As we have already highlighted, estimating the competitor’s advertising expenditure is purely perceptual therefore we can conclude that companies feel the problem of not spending on advertising and probably this is why they feel that their competitors with larger budget gain competitive advantage.
Table 15 Relationship between performance and average advertising expenditure as a
percentage of revenue
Advertising expenditure as a percentage of revenue (%) Performance Company’s expenditure Competitor’s expenditure
Laggards 3.6 7.0
Average
performers 7.5 8.0
Leaders 8.8 9.8
Total 7.0 9.0
n = 204; 142
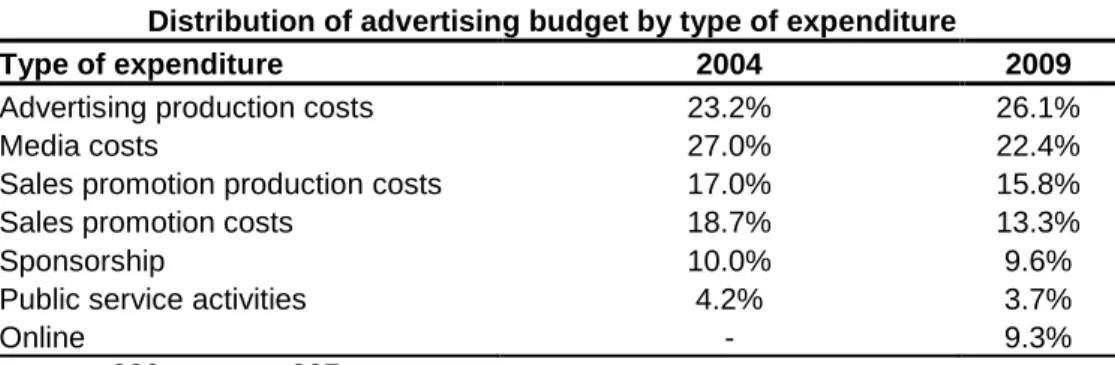
Online communication which was not measured last time probably had an effect on the decrease of advertising expenditure in traditional media. This effect was strengthened by the fact that media costs have decreased significantly during the last few years, and corporate appearance has become cheaper. Compared to the results of previous competitiveness researches, it was this research in which it appeared for the first time that production costs of advertisements exceeded advertising placement costs. Sums spent on sales promotion campaigns also have dropped by 5 per cent (Table 16).
Table 16 Distribution of advertising budget by type of expenditure
Type of expenditure 2004 2009
Advertising production costs 23.2% 26.1%
Media costs 27.0% 22.4%
Sales promotion production costs 17.0% 15.8%
Sales promotion costs 18.7% 13.3%
Sponsorship 10.0% 9.6%
Public service activities 4.2% 3.7%
Online - 9.3%
n (2004) = 239; n (2009) = 207
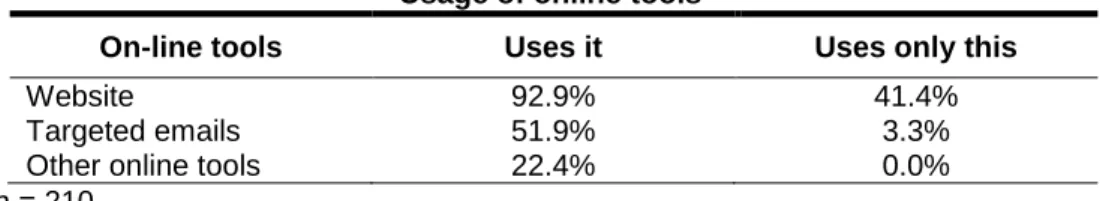
In our sample we could identify 210 companies using some kind of online communication tools. Their vast majority (92.9%) runs a website and almost half of them do not use any other online communication tool (Table 17).
Table 17 Usage of online tools
On-line tools Uses it Uses only this
Website 92.9% 41.4%
Targeted emails 51.9% 3.3%
Other online tools 22.4% 0.0%
n = 210
A relatively high proportion of the companies (51.9%) applies targeted emails and a smaller proportion of them (22.4%) uses other online tools, as well (e.g. online campaigns, blog, chat, web 2.0 applications etc.). Today online presence has become widely accepted among companies, however, it primarily means the usage of websites
5. Summary
Marketing is considered by company executives as one of the key areas in achieving market success. Both senior managers and marketing managers attribute major importance to the company’s sales and marketing activity. The relationship of the marketing department with other departments can be mainly characterized mutual and the interdependence between them has been considered similarly by the companies. The interdependence measured by some of the functions can show some differences: the strongest relationship was measured in case of production, while R&D activity presented the weakest. In case of leading companies, however, their R&D activity is led by marketing to greater extent.
When examining marketing tools we discussed the branding practice of the companies and based on the results we can state that the market share of branded products has decreased a bit in the last years. Nevertheless it can be observed that the best performing companies have a much more significant branding practice. In their case the product brand, the corporate brand and the two together appear in a higher proportion than in case of other companies. The application of an even more conscious brand management carries an even bigger potential. It is an example of this that while almost half of somewhat successful companies follow the development of their brand value, in case of laggards only 1 out of 6 proceeds the same way.
Regarding pricing, leading companies are typically present on the market with higher prices which can give them more room in using price-based tools in competition. It is an interesting result of our analysis that while distribution channels typically do not differ by performance groups, the number of used distribution channels already shows significant differences. Competition leader companies offer their products/services at much more sales points then the laggard ones.
About the advertising activity of the companies we can say that average performers and leaders can be jointly characterized by a somewhat different approach to communications than the laggards. The former group of companies perceives to smaller extent that they spend less on advertising than their competitors and they can be characterized by more complex controlling mechanisms. It can also be stated that regardless to market position the importance of online communication is stronger.
Based on the analysis of the effect of companies’ marketing activity on competitiveness, we can conclude that leading companies are characterized by a much stronger activity regarding the usage of every marketing tool. Therefore,
corresponding with our assumptions we can state that marketing really contributes to corporate competitiveness.
Acknowledgements:
This research was funded by the European Union (TAMOP-4.2.1/B-09/1/KMR- 2010-005)
REFERENCES
Ataman, M. Berk, Harald J. Van Heerde, and Carl F. Mela (2010), “The Long Term Effect of Marketing Strategy on Brand Sales”, Journal of Marketing Research, 47, 866-882.
Blattberg, Robert C. and Kenneth J. Winniewski. (1989), “Price-Induced Patterns of Competition”, Marketing Science, 8, 291-309.
Boulding. William, Eunkyu Lee, and Richard Staelin (1994), “Mastering the Mix: Do Advertising, Promotion, and Salesforce Activities Lead to Differentiation?”, Journal of Marketing Research, 31, 159-172.
Bund, Henry and James W. Carroll (1957), “The changing role of the marketing function”, Journal of Marketing, 21, 268-325.
Cespedes, Frank V. (1990), “Agendas, incubators, and marketing organizations”, California Management Review, 33, 27–53.
Chikán, Attila and Czakó Erzsébet (2009), Versenyben a világgal: Vállalataink versenyképessége az új évezred küszöbén, Budapest: Akadémiai Kiadó.
Conant Jeffrey S., Michael P. Mokwa and P. Rajan Varadarajan (1990), “Strategic types, distinctive marketing competencies and organizational performance: A multiple measures-based study”, Strategic Management Journal, 11, 365–383.
Csesznák Anita and Wimmer Ágnes (2011), Vállalati jellemzők és összefüggéseik a válság időszakában – A „Versenyben a világgal” kutatási program 2009. évi felmérésében résztvevő vállalatok jellemzése, Budapest: BCE Vállalatgazdaságtan Intézet, Versenyképesség Kutató Központ.
Ferris. Paul, James Oliver and Comelis De Kluyver (1989), “The Relationship Between Distribution and Market Share”, Marketing Science, 8, 107-127.
Harrison‐Walkera L. Jean and Grady Perdue (2007), “The role of marketing in the valuation of a firm: Exploring the underlying mechanism”, Journal of Strategic Marketing, 15, 377–386.
Homburg, Christian, John P. Workman, Jr. and Harley Krohmer (1999), “Marketing’s influence within the firm”, Journal of Marketing, 63, 1–17.
Ingenbleek, Paul, Marion Debruyne, Ruud T. Frambach and Theo M. M. Verhallen (2003), “Successful new product pricing practices: a contingency approach”, Marketing Letters, 14, 289-305.
Kotler, Philip and Waldemar Pfoertsch (2006), B2B Brand Management, Berlin:
Springer.
Keller, Kevin Lane, Tony Apéria, and Mats Georgson (2012), Strategic Brand Management: a European Perspective, Essex: Pearson Education.
Kotler, Philip and Kevin Lane Keller (2011), Marketing Management, Prentice Hall.
Lindsay, Marsha (1989), “Establish Brand Equity Through Advertising”, Marketing News, (January 22), 16.
Matyusz, Zsolt (2011), A 2009-es versenyképességi adatfelvétel vállalati mintájának alapjellemzői és reprezentativitása, Budapest: BCE Vállalatgazdaságtan Intézet, Versenyképesség Kutató Központ.
Menon, Anil, Sundar G. Bharadwaj and Roy Howell (1996), “The quality and effectiveness of marketingstrategy: Effect of functional and dysfunctional conflict in intraorganizational relationships”, Journal of the Academy of Marketing Science, 24, 294-313.
Moorman, Christine and Roland T. Rust (1999), “The role of marketing”, Journal of Marketing, 63, 180–197.
Olson. Jerry C. (1977), “Price as an Informational Cue: Effects on Product Evaluations”, in Consumer and Industrial Buying Behavior, Arch Woodside, Jagdish N. Sheth. and Peter D. Bennett, eds. New York: Elsevier, 267-286.
Scherer, Frederic M. and David Ross (1990), Industrial Marketing Structure and Economic Performance, Boston: Houghton Mifflin.
Sarkeesa, Matthew, John Hullandb and John Prescott (2010), “Ambidextrous organizations and firm performance: the role of marketing function implementation”, Journal of Strategic Marketing, 18, 165-184.
Simon, Carol J. and Mary W. Sullivan (1993), “The Measurement and Determinants of Brand Equity: A Financial Approach”, Marketing Science, 12, 28-52.
Rao, Akshay R. and Kent B. Monroe (1989), ”The Effect of Price, Brand Name, and Store Name on Buyers' Perceptions of Product Quality: An Integrated Review”, Journal of Marketing Research, 26, 351-357.
Yoo, Boonghee, Naveen Donthu and Sungho Lee (2000), “An Examination of Selected Marketing Mix Elements and Brand Equity”, Journal of the Academy of Marketing Science, 28, 195-211.
Webster, Frederick E., Jr. (1992), “The changing role of marketing in the corporation”, Journal of Marketing, 56, 1–17.
Villarejo-Ramos, Angel F. and Manuel J. Sánchez-Franco (2005), ”The impact of marketing communication and price promotion on brand equity”, Journal of Brand Management, 12, 431-444.
APPENDICES
Appendix 1: Firm size characteristics – category boundaries Categories: Size by
number of employees
Size by asset value Size by revenue
Small
company 0- 49
employees
< 10 million euros (< 2.65 billion HUF)
< 10 million euros (< 2.65 billion HUF) Medium
company 50 – 249 employees
Between 10and 43 million euros (between 2.65 and 11.395 billion HUF)
Between 10 and 50 million euros (between 2.65 and 13.25 billion HUF) Large
company more than 250 employees
≥ 43 million euros (≥ 11.395 billion HUF)
≥ 50 million euros (≥ 13.25 billion HUF)
Appendix 2: Company performance
Grouping by company performance was made by rating provided by the top management. In question below we requested top managers to rate their company in relation to their industry average, furthermore, (in case of multiple industries) to the performance of their most important industry. (1 – deeply under industry average; 2 – somewhat below industry average; 3 – similar to industry average; 4 – somewhat above industry average; 5 – leading the industry) based on the following aspects:
a) Return on sales b) Return on investment
c) Market share (based on sales revenue) d) Technological level
e) Management performance f) Product/Service quality
Based on the data collected, more than 90% of the companies could have been categorized. After cluster analysis the following three groups have been determined:
Laggards: With a better-than-average level of product quality and management within the internal industry they can be characterized by a somewhat below the average technology level and below the average market share and financial performance.
Average performers: This group is characterized by an above the average product quality, management and technology level, an average level of market share and an above the average profitability.
Leaders: This group has an above the average performance in every examined performance trait. In the opinion of the managers mostly product quality,
management and technology level are outstanding from the industry average.
Regarding market share the advantage is less and regarding profitability it is felt even less by the responding managers.
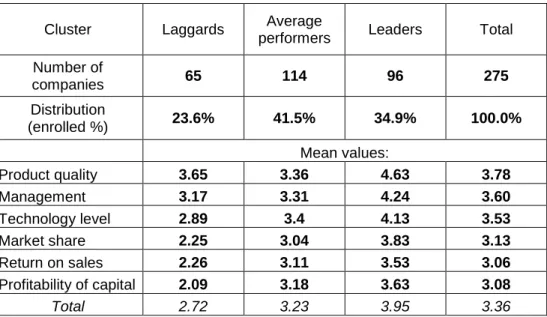
Table 15 summarizes the distribution of the sample and the traits of the performance clusters based on the given variables.
Mean values across performance clusters
Cluster Laggards Average
performers Leaders Total Number of
companies 65 114 96 275
Distribution
(enrolled %) 23.6% 41.5% 34.9% 100.0%
Mean values:
Product quality 3.65 3.36 4.63 3.78
Management 3.17 3.31 4.24 3.60
Technology level 2.89 3.4 4.13 3.53
Market share 2.25 3.04 3.83 3.13
Return on sales 2.26 3.11 3.53 3.06
Profitability of capital 2.09 3.18 3.63 3.08
Total 2.72 3.23 3.95 3.36
We emphasize the fact that the rating of performance items was based not on objective factors but on the managers’ self-assessment. Previous experiences show that in case of financial factors, which are measurable in a simpler way, self- assessment is more precise than in case of the more subjectively interpretable quality and resource level factors. Answers also could reflect the interdependence between different competition factors: the level of quality, management and technology can ground market efficiency and financial performance (however we cannot necessarily conclude it).
Appendix 3: The weight of the corporate areas from the perspective of company success according to the judgment of marketing executives.
2004 2009
Activity area n Mean St. dev. n Mean St. dev.
Top management 288 4.82 0.44 241 4.59 0.67
Sales 283 4.43 0.84 235 4.34 0.86
Cost management 284 4.21 0.92 236 4.23 0.79
Commerce/Marketing 282 4.17 1.00 236 4.20 0.95
Production 272 4.11 1.15 233 4.20 1.09
Acquisition 285 3.88 0.97 232 4.08 0.92
Finances 286 3.72 0.95 235 4.03 0.88
Payroll management 284 3.63 0.98 235 4.02 0.87
Quality assurance 284 3.89 1.03 232 3.89 1.03
Accounting 284 3.43 1.04 236 3.86 1.01
Strategic planning 279 3.80 1.12 234 3.84 1.04
Inventory
management 277 3.47 1.11 235 3.74 0.99
Human resources
management 282 3.61 1.04 235 3.71 0.99
Logistics 278 3.42 1.06 230 3.67 1.05
Information
management 277 3.43 1.11 234 3.52 1.12
Controlling 275 3.49 1.03 228 3.44 1.13
Organizational
development 276 3.14 1.03 228 3.09 1.21
Research &
development1 283 3.67 1.13 229 2.83 1.35
n (2009) = 228-236; n (2004) = 275-288; Scale: 1 - less significant, 5 - crucial