Title of manuscript: Comparative advantages in the global coffee trade Author: Áron Török (corresponding), Attila Jámbor, Tamás Mizik
University: Corvinus University of Budapest, Department of Agricultural Economics and Rural Development
Mailing address: H-1093 Budapest Fővám tér 8. HUNGARY
Contact: aron.torok@uni-corvinus.hu +36303089038
Problem statement
Coffee is an important agricultural raw material and part of international trade. Although global production is extremely concentrated, it is mainly sold to developed markets. The aim of the paper is to analyse the comparative advantages of the biggest producers. Results suggest that coffee trade has increased recently with important changes in the key players. Brazil, Vietnam and Colombia are currently the biggest exporters, giving the majority of global trade. However, Balassa indices were the highest for Uganda, Ethiopia and Honduras, suggesting unreasonable specialisation patterns.
Furthermore, stability and duration tests show significantly changing trends, implying fierce competition in these markets.
Objectives
Coffee is an excise good and subject of remarkable international trade. This product is signed in international produce exchanges and is one of the most important agricultural raw materials globally.
The supply side of the coffee market is highly affected by weather conditions and the various diseases of the coffee shrubs, while the demand side is determined by the continuous growth of coffee consumers, mainly in the developing countries (Condliffe et al., 2008).
According to the International Coffee Organization (ICO) (2014), international coffee trade statistics have existed for centuries - the first official price statistics is from 1894. The history of coffee trade can be divided into three important periods (ICO, 2014). Before 1962 and after 1989, the price of coffee was subject to the free market, while during the period of 1962-1989, coffee price was regulated by production quotas and was subject to several short-term International Coffee Agreements.
ICO was established in 1963 in order to control these agreements – it currently has 77 members worldwide, 42 exporting members with almost all the important producers included, and 35 importing members (including the European Union, Japan, Norway, Russian Federation, Switzerland and the United States).
In recent years, scientific research on global coffee trade were mainly dedicated to the topic of fair trade, a movement on sustainable coffee production and trade giving special attention to small scale coffee producers. However, competitiveness of coffee trade was only measured on a single country level. Some of the main producer countries were investigated in the recent years: Indonesia (Ibrahim and Zailani, 2010; Baroh et al., 2014), Ethiopia (Boansi and Crentsil, 2013) and Cameroon (Molua, 2008), but these studies have mainly focused on competitiveness in terms of developing their own market.
Despite these studies and apparent importance of the topic, a relatively small number of research was dealing with a broad analysis of competitiveness among the most important coffee producers. The aim of the paper, therefore, is to expand the scant literature of the field by providing a comprehensive analysis of the competitiveness of global coffee trade. In order to reach this aim, the paper is structured as follows. First, the main characteristics of the coffee production and trade is highlighted. Second, a demonstration of methods and data used is given followed by the analysis of comparative advantages and their duration. The final part concludes.
Introduction
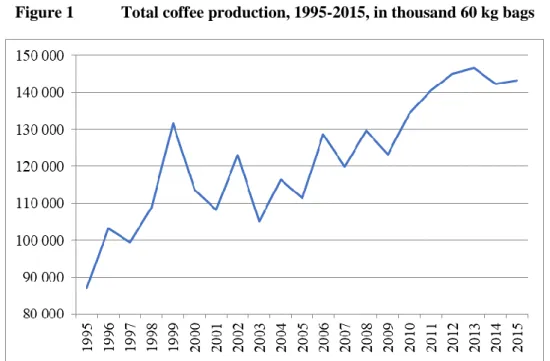
In 1995-2015, global coffee production showed an increasing trend with remarkable fluctuations during the years. From 1995 to 2015, total coffee production has increased by almost 65% globally from 87 million 60 kg bags to 143 million bags (Figure 1).
Figure 1 Total coffee production, 1995-2015, in thousand 60 kg bags
Source: Own composition based on International Coffee Organization (2016)
Two reasons were responsible for this remarkable increase. On the one hand, almost all of the most important coffee producers (Brazil, Colombia, Indonesia, Ethiopia, etc.) have increased their production. On the other hand, by the end of the 20th century, Vietnam as a new world power has appeared in the global map of coffee production. Its coffee production has increased by almost 600%
in the period analysed and nowadays, Vietnam is the second most important coffee producer of the world with 27.5 million bags in 2015.
In the period analysed, there was only a small change among the top coffee producers (Table 1). In line with the rise of Vietnam, the disappearance of Mexico, Côte d'Ivoire, Costa Rica and El Salvador is remarkable. The overall leading position of Brazil is unquestionable and also Vietnam, Colombia and Indonesia have produced more than 10 million bags per year recently.
Table 1 TOP10 coffee producers in the world, 1995, 2005, 2015
TOP10 Producer in 1995 Share TOP10 Producer in 2005 Share TOP10 Producer in 2015 Share
Brazil 29% Brazil 30% Brazil 30%
Colombia 15% Vietnam 12% Vietnam 19%
Mexico 5% Colombia 11% Colombia 9%
Indonesia 8% Indonesia 8% Indonesia 9%
Guatemala 4% Ethiopia 4% Ethiopia 5%
Côte d'Ivoire 3% India 4% India 4%
Ethiopia 3% Mexico 4% Honduras 4%
India 3% Guatemala 3% Uganda 3%
Costa Rica 3% Honduras 3% Guatemala 2%
El Salvador 3% Peru 2% Peru 2%
Total 76% 82% 88%
Source: Own composition based on International Coffee Organization (2016)
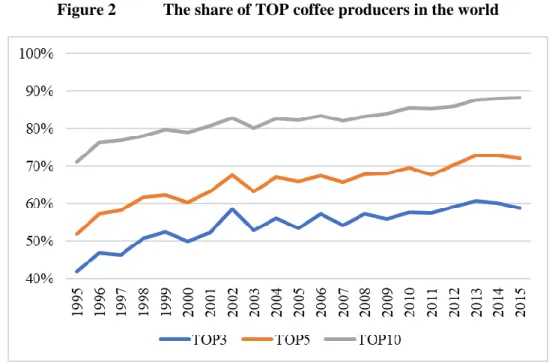
In line with the general growth of global coffee production, the concentration of the most important producers has also increased significantly. As Figure 2 shows, the share of TOP3 producers (from 2000 it is Brazil, Vietnam and Colombia) was around 60%, while the share of the TOP10 producers was around 88% from 2013 to 2015. Therefore global coffee production is considered to be highly concentrated with the three most important producers dominating global production.
Figure 2 The share of TOP coffee producers in the world
Source: Own composition based on International Coffee Organization (2016)
In line with global coffee production, coffee trade has also increased significantly from 1995 to 2015 (from $12.5 billion to $30 billion). However, after 2011, global coffee trade has somewhat decreased but is still twice as much in value than it was twenty years ago. This growth, however, is less than the increase of total exports, which tripled at the same time (Figure 3).
Figure 3 The world’s trade of coffee (R) and all goods (L), in billion USD
Source: Own composition based on WITS (2016)
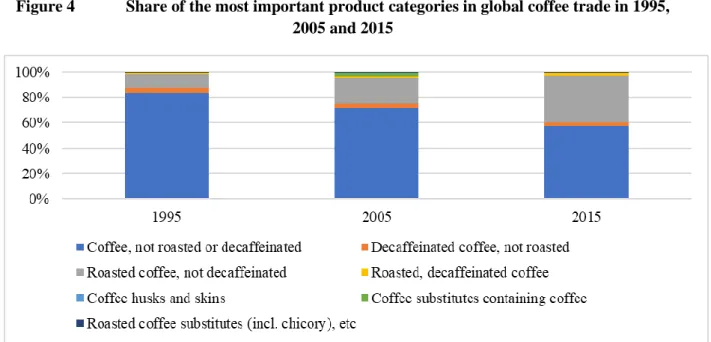
When talking about coffee trade, note that different product categories can be distinguished, mainly based on the level of processing. As Figure 4 shows, there are seven different categories connected to global coffee trade, out of which “Coffee, not roasted or decaffeinated” and “Roasted coffee, not decaffeinated” are the most important ones. In these terms, global coffee processing has moved towards products with higher value added as the share of roasted coffee has increased significantly (from 10% to 37%), together with the decrease of unprocessed coffee (from 84% to 57%). However, (roasted) decaffeinated coffee – as a product with even more value added – has started to become an important category recently.
Figure 4 Share of the most important product categories in global coffee trade in 1995, 2005 and 2015
Source: Own composition based on WITS (2016)
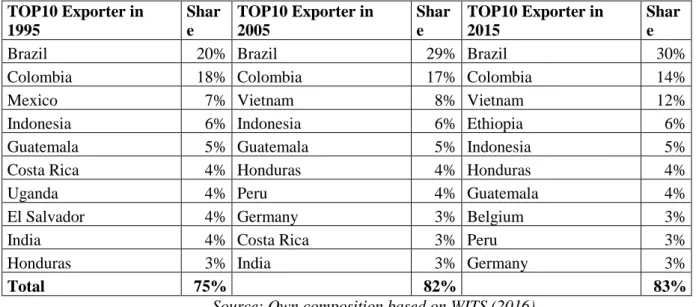
Regarding the most important exporters of not roasted coffee, the biggest coffee producer countries are observable. However, note that some European countries (e.g. Germany and Belgium) are also among the TOP green coffee exporters, suggesting that these countries not only import green coffee but also re-export them in remarkable quantity and value (the re-export of green coffee in European countries was investigated by several studies, like ICO, 2012 and ICO, 2013). The concentration of green coffee export – in line with that of coffee production – is very high and shows an increasing trend. The share of Brazil, Colombia and Vietnam is almost 60% here, while the concentration of the TOP10 exporters was 85% in 2015.
Table 2 TOP10 green coffee exporters in 1995, 2005 and 2015 TOP10 Exporter in
1995
Shar e
TOP10 Exporter in 2005
Shar e
TOP10 Exporter in 2015
Shar e
Brazil 20% Brazil 29% Brazil 30%
Colombia 18% Colombia 17% Colombia 14%
Mexico 7% Vietnam 8% Vietnam 12%
Indonesia 6% Indonesia 6% Ethiopia 6%
Guatemala 5% Guatemala 5% Indonesia 5%
Costa Rica 4% Honduras 4% Honduras 4%
Uganda 4% Peru 4% Guatemala 4%
El Salvador 4% Germany 3% Belgium 3%
India 4% Costa Rica 3% Peru 3%
Honduras 3% India 3% Germany 3%
Total 75% 82% 83%
Source: Own composition based on WITS (2016)
Contrary to green coffee exporters, none of the most important coffee producers can be found on the list of roasted coffee exporters (Table 3). Roasted coffee exports are dominated by mainly European countries as well as the USA and Canada, implying that roasting occurs outside the production area, indicating inequalities in the process of value addition through the coffee value chain. This phenomenon also highlights the importance of fair trade in the case of coffee as many other studies have highlighted (ICO, 2014). The concentration of the most important coffee exporters are still high but has somewhat decreased recently.
Table 3 TOP10 roasted coffee exporters in 1995, 2005 and 2015
TOP10 Exporter in 1995 Share TOP10 Exporter in 2005 Share TOP10 Exporter in 2015 Share
Germany 24% Italy 21% Switzerland 19%
Italy 17% Germany 18% Italy 14%
Belgium 17% Belgium 11% Germany 13%
United States 10% United States 9% United States 7%
Sweden 5% Austria 5% France 6%
Netherlands 4% Switzerland 5% Poland 5%
Austria 3% Sweden 4% Netherlands 5%
Finland 2% Canada 4% Belgium 5%
Denmark 2% Netherlands 4% Czech Republic 5%
France 2% France 3% Canada 4%
Total 86% 83% 83%
Source: Own composition based on WITS (2016)
Methodology
The paper is based on the seminal work of Balassa (1965) in terms of scientific methods. Balassa’s measurement of comparative trade advantage is calculated by different index numbers based on the concept of Ricardian trade theory. The original index of revealed comparative advantage defined as follows (Balassa 1965):
Bij=RCAij
nt nj it
ij
X X X
X
(1)where X means export, i indicates a given country, j is a given product, t is a group of products and n is a group of countries. It follows that a revealed comparative advantage (or disadvantage) index of exports can be calculated by comparing a given country’s export share of its total exports with the export share in total exports of a reference group of countries. If the value of B index higher than 1, a given country has a comparative advantage compared to the reference countries or, in contrast, a revealed comparative disadvantage if B less than 1.
The Balassa-index is criticised because it usually neglects the different effects of agricultural policies and exhibits asymmetric values. Trade structure is distorted by different state interventions and trade limitations while the asymmetric value of the B index reveals that it extends from one to infinity if a country enjoys a comparative advantage, but in the case of comparative disadvantage, it varies between zero and one, which overestimates a sector’s relative weight. However, there are many other specifications of the RCA index available – see Jámbor and Babu (2016) for more details.
The paper also checks the stability and duration of the RCA index in two steps. First, Markov transition probability matrices are calculated and then summarized by using the mobility index, evaluating the mobility across countries and time. Second, following Bojnec and Fertő (2008), a survival function S(t) can be estimated for by the using the non-parametric Kaplan–Meier product limit estimator, which pertains to the product level distribution analysis of the RSCA index. Following Bojnec and Fertő (2008), a sample contains n independent observations denoted (ti; ci), where i = 1, 2 , . . . , n, and ti is the survival time, while ci is the censoring indicator variable C (taking on a value of 1 if a failure occurred, and 0 otherwise) of observation i. Moreover, it is assumed that there are m < n recorded times of failure. Then, we denote the rank-ordered survival times as t(1) < t(2) < … < t(m).
Let nj indicate the number of subjects at risk of failing at t(j) and let dj denote the number of observed failures. The Kaplan–Meier estimator of the survival function is then (with the convention that ˆS(t) = 1 if t < t(1)):
j j j t i
t
n
d t n
S
())
ˆ (
(2)The paper employs global coffee trade data of World Bank (2016) World Integrated Trade Solution database at HS-6 level between 1995 and 2015 with the following product codes included: 90111, 90112, 90121, 90122, 90130, 90140 and 210130. The paper concentrates on the export side of the revealed comparative advantage index (B or RCA index) to exclude imports, which is more likely to be influenced by agricultural policy interventions.
Results
With calculation of Balassa indices, the specialisation of global coffee trade becomes apparent (Table 4). First, it is clear that Uganda, Ethiopia and Honduras had the highest comparative advantages in all periods analysed among the most important coffee exporters in the world, suggesting high potentials for competitiveness. Guatemala, Colombia, Vietnam and Brazil also had relatively high comparative advantages in global coffee exports, while similar numbers for other countries analysed have varied significantly. Note that Brazil and Colombia, despite being the biggest global coffee exporters, have generally decreasing and low comparative advantages. On the contrary, Vietnam has increased its comparative advantages to a great extent, in line with its production and trade growth indicated above.
Table 4 Balassa indices for the most important coffee exporters, by country, 1995-2015 Country 1995-2001 2002-2008 2009-2015
Brazil 2.10 2.26 2.24
Colombia 6.62 8.52 4.66
Ethiopia 27.28 36.27 18.77 Guatemala 11.37 11.81 7.32
Honduras 74.12 16.89 11.56
Indonesia 1.35 1.49 0.55
India 2.37 1.03 1.14
Mexico 1.23 0.70 0.86
Uganda 94.12 100.78 75.38
Vietnam 0.98 3.15 2.44
Source: Own composition based on World Bank WITS (2016) data
When analysing comparative advantages by product, further specialisation patterns become available (Table 5). It is apparent that not roasted or decaffeinated coffee as well as coffee substitutes have the highest comparative advantages among all product groups in all time periods. Consequently, countries exporting these products (Uganda, Ethiopia, Honduras) had the highest comparative advantages, while concentrating on the export of other coffee types has not proved to be beneficial.
Table 5 Balassa indices for the most important coffee exporters, by product, 1995-2015
Product 1995-
2001
2002- 2008
2009- 2015 Coffee; not roasted or decaffeinated 45.83 53.01 38.58 Coffee; decaffeinated, not roasted 28.88 6.45 2.53 Coffee; roasted, not decaffeinated 1.46 0.26 0.28 Coffee; roasted, decaffeinated 12.91 1.43 1.86 Coffee husks and skins 10.46 0.00 0.00 Coffee substitutes 65.33 224.29 33.78 Roasted coffee substitutes 0.18 0.67 1.21 Source: Own composition based on World Bank WITS (2016) data
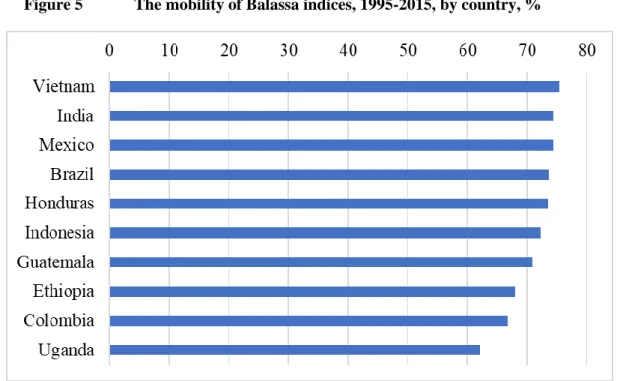
As results above show high fluctuations in time, the degree of mobility in Balassa indices was estimated by using the mobility index based on the Markov transition probability matrices (Figure 5).
Results show a relatively low mobility of the Balassa index in global coffee trade for Vietnam, India and Mexico, suggesting stable patterns of comparative (dis)advantages. Besides these countries, more than 70% of product groups with a comparative advantage remained persistent for Brazil, Honduras, Indonesia and Guatemala, while lowest mobility measures pertained to Ethiopia, Colombia and Uganda, implying highly changing competitive potentials (in line with results observable in Table 2).
Figure 5 The mobility of Balassa indices, 1995-2015, by country, %
Source: Own composition based on World Bank WITS (2016)
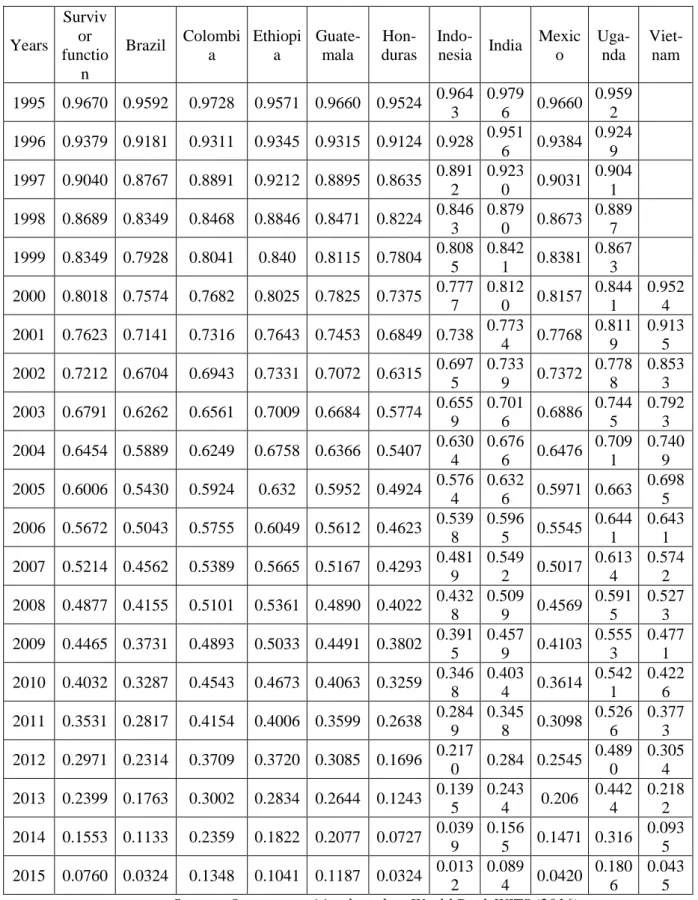
Regarding the duration of revealed comparative advantages in global coffee exports, the non- parametric Kaplan–Meier product limit estimator was estimated. As described in the methodology section, equation 2 was run on our panel dataset and results confirm that in general the survival times are not persistent over the period analysed (Table 6). Survival chances of 96-98% at the beginning of the period fell to 1-18% by the end of the period, suggesting that fierce competition exists in global coffee trade.
Results vary by country, suggesting that the highest survival times exist for Uganda, while the lowest for Indonesia. However, there is no clear pattern observable between the change in survival times and the rank in global coffee exports. The equality of the survival functions across the top 10 countries can be checked using two non-parametric tests (Wilcoxon and log-rank tests). Results of the tests show that the hypothesis of equality across survivor functions can be rejected at the 1% level of significance, meaning that similarities in the duration of comparative advantage across most important global coffee exporters are absent (Table 6).
Table 6 Kaplan-Meier survival rates for Balassa indices and tests for equality of survival functions in global coffee trade, by the most important exporters, 1991–2015
Years
Surviv or functio
n
Brazil Colombi a
Ethiopi a
Guate- mala
Hon- duras
Indo-
nesia India Mexic o
Uga- nda
Viet- nam 1995 0.9670 0.9592 0.9728 0.9571 0.9660 0.9524 0.964
3
0.979
6 0.9660 0.959
2
1996 0.9379 0.9181 0.9311 0.9345 0.9315 0.9124 0.928 0.951
6 0.9384 0.924
9
1997 0.9040 0.8767 0.8891 0.9212 0.8895 0.8635 0.891 2
0.923
0 0.9031 0.904
1
1998 0.8689 0.8349 0.8468 0.8846 0.8471 0.8224 0.846 3
0.879
0 0.8673 0.889
7
1999 0.8349 0.7928 0.8041 0.840 0.8115 0.7804 0.808 5
0.842
1 0.8381 0.867
3
2000 0.8018 0.7574 0.7682 0.8025 0.7825 0.7375 0.777 7
0.812
0 0.8157 0.844 1
0.952 4 2001 0.7623 0.7141 0.7316 0.7643 0.7453 0.6849 0.738 0.773
4 0.7768 0.811 9
0.913 5 2002 0.7212 0.6704 0.6943 0.7331 0.7072 0.6315 0.697
5
0.733
9 0.7372 0.778 8
0.853 3 2003 0.6791 0.6262 0.6561 0.7009 0.6684 0.5774 0.655
9
0.701
6 0.6886 0.744 5
0.792 3 2004 0.6454 0.5889 0.6249 0.6758 0.6366 0.5407 0.630
4
0.676
6 0.6476 0.709 1
0.740 9 2005 0.6006 0.5430 0.5924 0.632 0.5952 0.4924 0.576
4
0.632
6 0.5971 0.663 0.698 5 2006 0.5672 0.5043 0.5755 0.6049 0.5612 0.4623 0.539
8
0.596
5 0.5545 0.644 1
0.643 1 2007 0.5214 0.4562 0.5389 0.5665 0.5167 0.4293 0.481
9
0.549
2 0.5017 0.613 4
0.574 2 2008 0.4877 0.4155 0.5101 0.5361 0.4890 0.4022 0.432
8
0.509
9 0.4569 0.591 5
0.527 3 2009 0.4465 0.3731 0.4893 0.5033 0.4491 0.3802 0.391
5
0.457
9 0.4103 0.555 3
0.477 1 2010 0.4032 0.3287 0.4543 0.4673 0.4063 0.3259 0.346
8
0.403
4 0.3614 0.542 1
0.422 6 2011 0.3531 0.2817 0.4154 0.4006 0.3599 0.2638 0.284
9
0.345
8 0.3098 0.526 6
0.377 3 2012 0.2971 0.2314 0.3709 0.3720 0.3085 0.1696 0.217
0 0.284 0.2545 0.489 0
0.305 4 2013 0.2399 0.1763 0.3002 0.2834 0.2644 0.1243 0.139
5
0.243
4 0.206 0.442 4
0.218 2 2014 0.1553 0.1133 0.2359 0.1822 0.2077 0.0727 0.039
9
0.156
5 0.1471 0.316 0.093 5 2015 0.0760 0.0324 0.1348 0.1041 0.1187 0.0324 0.013
2
0.089
4 0.0420 0.180 6
0.043 5 Source: Own composition based on World Bank WITS (2016)
Conclusions
The paper analysed the competitiveness of global coffee trade and has reached a number of conclusions. First, global coffee production and trade were found to be highly increasing and concentrated by country and product, suggesting a small number of countries responsible for the vast majority of products traded. Brazil, Vietnam and Colombia were the biggest coffee producers (and green coffee exporters) in the previous years, while Switzerland, Italy and Germany exported the most roasted coffee at the same time.
As to competitiveness, it is clear that Uganda, Ethiopia and Honduras had the highest comparative advantages in all periods analysed among the most important coffee exporters in the world, suggesting high potentials for competitiveness. It was also apparent that not roasted or decaffeinated coffee as well as coffee substitutes had the highest comparative advantages among all product groups in all time periods. As to the stability and duration of these advantages, result suggest that in general the survival times are not persistent over the period analysed, implying highly changing competitive patterns.
Research in the future might want to search for the determinants of different competitive positions as well as a policy oriented discussion on the development consequences of the trends presented.
References
Balassa, B. (1965): Trade Liberalization and Revealed Comparative Advantage. The Manchester School, 33: 99-123.
Baroh, I., Hanani, N., Setiawan, B., Koestiono, D. (2014). Indonesian Coffee Competitiveness in the International Market: Review from the Demand Side. International Journal of Agriculture Innovations and Research. Vol. 3. pp. 605-609.
Boansi, D., Crentsil, C. (2013). Competitiveness and determinants of coffee exports, producer price and production for Ethiopia. In: Munich Personal RePEc Archive.
Bojnec, Š., I. Fertő (2008). European Enlargement and Agro-Food Trade. Canadian Journal of Agricultural Economics 56, no. 4: 563-579.
Condliffe, K., Kebuchi, W., Love, C., Ruparell, R. (2008). Kenya Coffee: A Cluster Analysis.
Harvard Business School.
Ibrahim, H. W., Zailani, S. (2010). A Review on the Competitiveness of Global Supply Chain in a Coffee Industry in Indonesia. International Business Management. Vol. 4. pp. 105-115.
International Coffee Organization (2012). Re-exports of coffee. International Coffee Council 109th Session.
International Coffee Organization (2013). Re-exports of coffee by Germany. International Coffee Council 110th Session.
International Coffee Organization (2014). International Coffee Organization 1963 to 2013: 50 years serving the world coffee community. Available at: http://www.ico.org/documents/cy2012-13/history- ico-50-years-e.pdf (Downloaded: 23th January 2017)
International Coffee Organization (2016). Trade Statistics Tables. Available at:
http://www.ico.org/trade_statistics.asp (Downloaded: 26th September 2016)
Jambor, A. and Babu, S. (2016). Competitiveness of Global Agriculture: Policy Lessons for Food Security. Springer, 199p.
Molua, E. (2008). Assessment of Trade Facilitation and Competitiveness of Cameroon’s Coffee Sector: Implications for Trade Liberalisation. Trade Policy Review. Vol. 1. pp. 92-109.
World Bank (2016). World Integrated Trade Solution database. Available at:
http://wits.worldbank.org/ (Downloaded: 2nd November 2016)