Introduction
In a globalised world, the transmission of international prices to local markets is of key importance in the deter- mination of equilibrium prices. Trade agreements have especially significant effects on the vertical integration of internationally traded crops and, by extension, on their local prices. Smallholders’ well-being therefore depends on the transmission of international prices (Wohlgenant, 2001; and Krivonos, 2004). In this paper, we explain the behaviour of coffee price pass-through from the international market to the Mexican market. In addition, we provide evidence of a break in this pass-through.
Previous research has analysed the transmission of prices between the international and the Mexican coffee markets, comparing the periods before and after the liberalisation of the coffee market in Mexico (Krivonos, 2004; Jaramillo and Benítez, 2016). However, none of these studies have previ- ously documented the break in the long-term relationship between both price series that is suggested by our results.
This break has significant implications for the individuals who participate in the production chain, in particular the smallholders.
Indeed, Mexican coffee growing is considered a funda- mental agricultural activity because it allows the integration of production chains, the generation of foreign exchange and jobs, and the well-being improvement of thousands of small- holders, most of them of indigenous origin. However, the population dedicated to the production of this crop receives a small proportion of the final exportation price. This phenom- enon differs in each country and depends on specific condi- tions such as policies that affect production, exports, or the market structure (Krivonos, 2004).
The understanding of the processes related to price changes is crucial. Price transmission factors throughout the supply chain play an important role in determining the size and distribution price shock effects or trade policy reforms
on the well-being of the population that intervenes in these markets (Vavra and Goodwin, 2005).
In this paper, we use a single equation conditional Error Correction Model (ECM) to determine the dynam- ics and duration of the adjustment between the coffee price in Mexico and the international coffee price for the period 2004-2019. Furthermore, in applying this model we discern a possible break in the relationship of both variables, which suggests that the transmission of coffee prices between the international and Mexican markets has come to an end, with important consequences for Mexican smallholders.
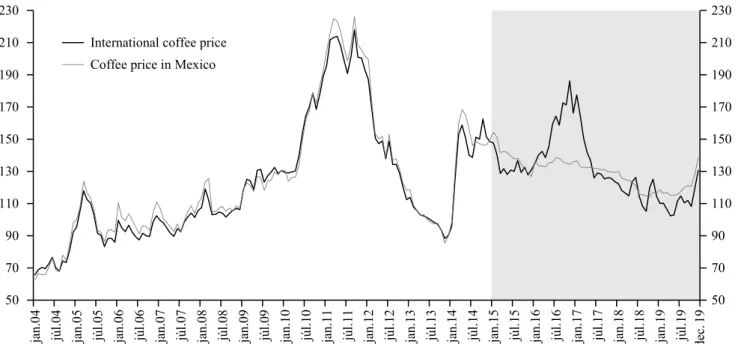
As the microeconomic theory suggests, coffee produc- ers’ revenue depends directly on the yields obtained in each production cycle and on the local market price. Nonetheless, the local market price depends indirectly on the international price. In fact, we have noticed from the data that in Mexico’s case both prices follow a close relationship, at least until the year 2013. But this marked pass-through has faded away since the year 2014 (see Figure 1). This could be due, in part, to the decline in Mexican production because of the coffee rust plague (also known as roya). Indeed, according to the data reported by the Agricultural and Livestock Infor- mation Service (SIAP), the lowest production of coffee was registered in the 2015-2016 agriculture cycle, with just 824 thousand tons (about 59 percent of average production in the period 2004-2015).1
On the international market, the prices of the Arabica and Robusta varieties of green coffee are carried out through the agricultural Commodity Exchange of New York and London. To determine the prices received by producers in Mexico, the National Coordination of Coffee Organiza- tions, C.A. (NCCO) takes as a reference the price of Arabica coffee that is quoted on the Commodity Exchange of New York (because most of the national production belongs to this coffee variety). According to Elms and Otero (2020),
1 Although this latter is just a guess, and it is not part of our research question, we wanted to call the attention of the reader to this potential research topic.
Is there a pass-through from the international coffee price to the Mexican coffee market?
We estimate the transmission of coffee prices from the international market to the Mexican market for the period 2004-2019.
Our estimates are obtained from a single equation conditional Error Correction Model (ECM). We estimate our proposed model for two overlapping periods: before a hypothesised break (2004-2013), and full sample (2004-2019). The results of the first estimation suggest that given a 1% increase in the international price of coffee, the Mexican price increases by 0.9%, which is larger than previous estimates in the literature, but a finding which is consistent with the idea of more market integra- tion due to free trade agreements. Furthermore, we find that Mexican coffee production has no effect in the determination of local coffee prices. Our model also implies a previously undocumented break in the long-run relationship between international and national prices, which started in 2015 but was statistically significant until 2017. This latter finding suggests that the inter- national coffee price pass-through to the Mexican economy has come to an end.
Keywords: agricultural market, agricultural supply chain, agricultural exports JEL classifications: Q11, Q13, Q17
* Department of Economics, University of Houston, 3623 Cullen Boulevard, McElhinney Hall, Houston TX 77204, USA. Corresponding author:
ogalvezs@cougarnet.uh.edu.
** Department of Economics, Universidad Autonoma Chapingo, Carretera Mexico-Texcoco Km 38.5, Texcoco 56230, MX.
Received: 10 April 2021, Revised: 31 May 2021, Accepted: 4 June 2021.
around 85 percent of the coffee produced in Mexico is of Arabica variety and 15 percent is Robusta. The International Coffee Organization (ICO) classifies four categories of cof- fee according to the type of bean: Colombian Milds, Other Milds, Brazilian Naturals and Robust. The production of Mexico is considered within the group Other Milds.
Until 1989, the international coffee trade was regulated through a series of International Coffee Agreements of the ICO, maintaining stable prices and controlling the supply of coffee beans. After the breaking of these agreements, at the beginning of the 90s the Mexican market transitioned to a scheme of free supply and demand. This period was charac- terised by a behaviour of constant increases and decreases of prices in the world market, which have continued until recent years. According to data released by SIAP, the Mexi- can coffee price was between 3,834 and 13,879 constant pesos per ton, between 2004 and 2019.2 On the other hand, the average international coffee price (Other Milds group), was quoted between 25,719 and 95,454 constant pesos per ton for the same period.
Despite the historically strong relationship between the Mexican and the international coffee price, in this document we show that, in recent years, the price received by Mexican coffee producers has not maintained a close relationship with the world market price, suggesting a break in price transmis- sion that affects more than 500 thousand Mexican smallhold- ers. According to SAGARPA (2017), the coffee crop repre- sents 0.66 percent of the national agricultural GDP and 1.34 percent of the production of agro-industrial goods. Despite its small contribution to agricultural GDP, the importance of coffee lies in the size of the population dedicated to this economic activity and in the conservation of the biodiver- sity involved in the production of this crop. Indeed, Mexican
2 Using the Mexican Consumer Price Index (CPI) as deflator.
coffee farming involves around three million people through- out the value chain, of whom almost half live in areas classi- fied as highly marginalised (de la Vega et al., 2012).
Most producers in Mexico work on small plots, use tra- ditional technology for coffee production and, in general, rely only on family labour. According to information from the United States Department of Agriculture, in recent years, production costs have increased due to the lack of workers in the field, whose labour represents more than 80 percent of total production costs (Elms, 2019). Therefore, the income of many families dedicated to coffee production, who rank among the poorest producers of Mexico, depends on exog- enous factors such as international prices, the exchange rate, climatic conditions, migration, etc.
The rest of this research work is organised as follows. The first section presents a review of the literature on the price transmission of agricultural goods that chiefly focuses on the coffee market. The next section (methodology) describes the data and variables included in the econometric model.
We then present the main results. Finally, we summarise and discuss our findings.
Literature Review
The first studies on the transmission of prices of agricul- tural goods were motivated by an interest in knowing the impact of trade reforms on the agricultural sector markets among different countries. For example, Baffes and Gardner (2003) evaluated the degree to which international prices have been transmitted to local commodity markets, following the implementation of agricultural reforms during the 1980s and early 1990s, in eight developing countries. These authors found that only the price and trade policies implemented in
50 70 90 110 130 150 170 190 210 230
50 70 90 110 130 150 170 190 210 230
jan.04 júl.04 jan.05 júl.05 jan.06 júl.06 jan.07 júl.07 jan.08 júl.08 jan.09 júl.09 jan.10 júl.10 jan.11 júl.11 jan.12 júl.12 jan.13 júl.13 jan.14 júl.14 jan.15 júl.15 jan.16 júl.16 jan.17 júl.17 jan.18 júl.18 jan.19 júl.19
International coffee price Coffee price in Mexico
dec.19
Figure 1: Mexican and international coffee prices (Jan-04 / Dec-19).
Note: Standardised prices are plotted, converted from a constant Mexican pesos series to a base year 2013=100. The light grey area represents the period where the price relation- ship break begins.
Source: Own elaboration with data from International Coffee Organization (ICO), Banco de México (Banxico), Agricultural and Livestock Information Service (SIAP) and Mexican Institute of Statistics (INEGI)
Mexico, Chile and Argentina allowed a significant pass- through of world price movements to domestic prices.
Likewise, Krivonos (2004) assessed whether the reforms implemented in the late 1980s and early 1990s in 13 producer and exporter countries, affected the relationship between prices quoted in the international market and the prices paid to producers in the respective local markets. Following the approach of Baffes and Gardner (2003), Krivonos (2004) used a Vector Error Correction (VEC) model with which he estimates the transmission of short-term prices, the speed of adjustment and the equilibrium price of coffee produc- ers. His results indicate that the participation of producer prices in the international price has increased substantially in all the countries analysed, except Tanzania. The author also concluded that there was a close cointegration between the national and world markets, after the reforms, and that the international price transmission signals improved in most cases.
The transmission of coffee prices, after the presence of reforms, has been also analysed for some specific countries.
Worako, van Schalkwyk, Alemu and Ayele (2008) studied the case of Ethiopia. Worako et al. (2008) concluded that, after the reforms, there is greater integration between Ethio- pia’s coffee markets and the world market, and between some auction markets and the world market. On the other hand, Jaramillo and Benítez (2016) studied the case of the Mexican market. The hypothesis of these authors is that the 1989 reforms on coffee export quotas and the process of trade liberalisation led to greater commercial integration between Mexico and the international coffee market. The results of Jaramillo and Benítez (2016) show that, in the period of state intervention, Mexican prices required between 11 and 32 periods to complete their adjustment, but it was reduced to only five periods in the liberalisation period. Furthermore, the authors found that the price transmission elasticities were 0.35 before liberalisation and 0.61 after liberalisation of the coffee market.
Price transmission has been also analysed between the international market and the coffee consumer market.
Alonso and Estrada (2016) used a VEC model to compare the series of consumer prices of ground coffee in five cit- ies in Colombia with the international price of coffee. These authors found that coffee prices to retailers respond differ- ently to unexpected shocks in the international price; in Bar- ranquilla, Bogotá, Cali and Medellín the effects disappear after 36 months or more, while for Cartagena they disap- pear in a shorter period. Additionally, the authors found that local prices tend to adjust upward if they are below long- term equilibrium. This adjustment is around three years for all cities, except for Cali, which has a much slower adjustment speed.
The movement of prices of basic goods between markets can be related in different ways, especially for products found in different sectors, as shown by Jena (2016). This author examined the nature and extent of the impact of international prices on domestic prices in India from 2001 to 2012. To do so, he developed price indices for different products, classi- fied into three groups. Jena (2016) used a VEC model with which he showed that domestic prices of raw materials (met- als and energy) move together with world prices. But the
integration of markets for agricultural products, between the Indian domestic market and the international market, is far from complete.
In general, the results found by Krivonos (2004), Worako et al. (2008), Jaramillo and Benítez (2016), and Alonso and Estrada (2016) point out that there is a relationship between what happens in the international market and the national coffee markets. In other words, there is an integration of the coffee supply chain, mainly reflected in the period after the liberalisation of the coffee market in each country analysed.
This paper is related to the previous literature that made use of VEC models but differs in terms of the context in which such a model is applied. In other words, the previ- ously cited research has used VEC models to analyse the effects of agricultural policies on the coffee price relation- ship, whereas the focus of this paper is the transmission of coffee prices from the international market to the Mexican market. Furthermore, in this paper we use an ECM model to determine if the price relationship has been broken in the most recent years.
Methodology
Data
In this document, we model the price of coffee in the Mexican market (dependent variable) in relation to the Mexican production of coffee and the international price of coffee (independent variables). Our time series tracks the variables of interest over a period of 16 years, with meas- urements being made monthly (192 observations in total).
The data altogether covers the period from January 2004 (Jan-2004) to December 2019 (Dec-2019).
International prices have a monthly frequency and cor- respond to the category Other Milds. We obtain this interna- tional price variable from ICO. These prices are published in US cents per pound. To make the international price com- parable to the local price in Mexico we express the former in pesos per ton using the monthly FIX exchange rate pub- lished by Banco de Mexico. Finally, we express this variable in real terms using the Mexican National Consumer Price Index (CPI).
We construct the Mexican coffee price using the annual figures reported by SIAP. Then, we express these annual data into monthly figures imputing the coffee producer price index (PPI) growth rate to the annual frequency variable. We implicitly assume that the baseline coffee price in 2004 cor- responds to the mean rural price reported by SIAP and that its monthly growth rate is the same as the one observed in the coffee PPI from 2004 to 2019.
Mexican coffee production is obtained from SIAP, with monthly frequency. Given that the production data is reported as accumulated production throughout the coffee agricultural year (October-May), we use the following formula, proposed by Gálvez-Soriano (2018), to “disaggregate” the data:
, (1)
where, qt is the disaggregated monthly production, while ct is the accumulated production in period t. That is, the produc- tion of the previous month is subtracted from the production of the current month.
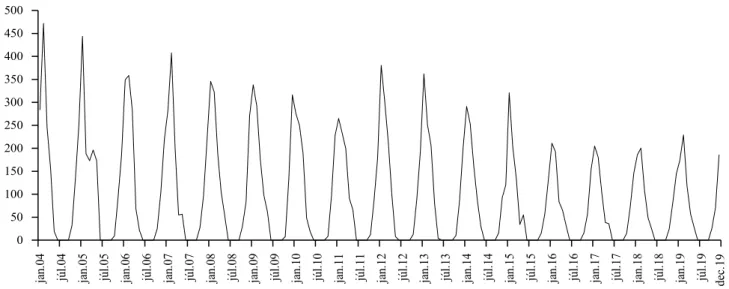
The production of coffee in Mexico has a strong seasonal aspect. The highest level of production is consistently pre- sent in January, while the lowest production is obtained in the period June-September of each year. This is important to notice because we need to remove the seasonal factor from all three variables to be included in the model. Otherwise, the remaining seasonality will be captured by the error term, violating our assumptions of white noise and normality.
Indeed, we give three treatments (transformations) to the variables in our dataset: standardisation, Box-Cox transfor- mation, and seasonal adjustment. First, we standardise all variables to express them in terms of a common base year 2013=100. Second, we use a Box-Cox (1964) transforma- tion by means of a natural logarithm (i.e., λ = 0) to reduce the variance of the series. Finally, we seasonally adjust all variables in our database using the X-13ARIMA-SEATS program as in Gálvez-Soriano (2020).3
Econometric Model
We use a single equation conditional Error Correction Model (ECM) to analyse the relationship between both Mex- ican and international coffee markets. The model we propose considers Mexican coffee prices as the dependent variable, , while the explanatory variables are international coffee prices and Mexican coffee production . Our inten- tion by including production as a control variable in the model is to capture the effect of the supply side forces in the determination of the equilibrium local price.
In our model specification we follow Engle and Granger (1987), but instead of performing a two-step estimation,
3 Seasonal adjustment models we developed were based on the document “Proce- dure for obtaining seasonal adjustment models with the X12-ARIMA program” by the Specialized Group on Seasonal Adjustment (GED) at the Specialized Committee of Macroeconomic Statistics and National Accounts of Mexico.
we propose a single VEC equation, which is known in the literature as ECM and it is preferred for having a higher power than traditional VEC models (Kremers, Ericsson, and Dolado, 1992; Banerjee et al., 1993; and Zivot, 2000).
Hence, our proposed ECM can be expressed as follows:
, (2)
where is the difference operator and all variables are expressed in natural logarithms. Finally, is the error term, which is assumed to be white noise with normal distribution.
The first three terms of the ECM correspond to the cointe- gration vector, which defines the long-term relationship among the model variables. The second part of the equation (sums of differenced terms) defines the short-term relationship.
We are interested in the coefficient associated to the inter- national price of coffee, in the cointegration vector, α2. This coefficient will tell us about the long run relationship between Mexican and international price, in terms of elasticities. Simi- larly, the coefficient associated to the Mexican production of coffee, α3, will express the long-term relationship between Mexican price and quantity (in terms of elasticities).
Finally, α1 can be interpreted as the speed of adjustment, which should be negative and smaller than one in absolute value (–1 < α1 < 0). We consider three cases to explain the interpretation of this coefficient.
• If α1 ≈ –1, deviations from the long-run equilibrium will take approximately one period to adjust (in our case, one month).
• If α1 ≈ –0.5, deviations from the long-run equilibrium will take approximately two periods to adjust (in our case, two months).
• If α1 ≈ 0, deviations from the long-run equilibrium will take several periods to adjust.
Additionally, we follow the two-step estimation pro- posed by Engle and Granger (1987) to obtain the speed of adjustment parameter from an unconditional VEC model.
0 50 100 150 200 250 300 350 400 450 500
jan.04 júl.04 jan.05 júl.05 jan.06 júl.06 jan.07 júl.07 jan.08 júl.08 jan.09 júl.09 jan.10 júl.10 jan.11 júl.11 jan.12 júl.12 jan.13 júl.13 jan.14 júl.14 jan.15 júl.15 jan.16 júl.16 jan.17 júl.17 jan.18 júl.18 jan.19 júl.19 dec.19
Figure 2: Coffee production in Mexico.
Note: Standardised quantities to base 2013=100.
Source: Own elaboration with data from Agricultural and Livestock Information Service (SIAP) and INEGI
is rejected against the alternative of one or two cointegration vectors, with a significance level of 5%. In other words, these tests suggest that there is a long-term relationship between the price series and the Mexican production of coffee (see Table 2).
The cointegration of the variables implies that Mexican and international coffee prices have a close long-term rela- tionship. This can be observed in the cointegration vector of ECM we propose. Indeed, the results of the model estima- tion suggest that, in the long term, when the international price of coffee increases 1%, the Mexican price increases 0.9% (see column (1) of Table 3). Notice, however, that this effect corresponds to the period 2004-2013, which does not include the hypothesised break in the international coffee price passthrough and which, furthermore, covers a period post NAFTA. Thus, this estimation is larger than previous findings in the literature, which is consistent with the idea that trade agreements and globalisation contribute to the integration of the markets.
We also find that there is no long run relationship between Mexican price and production (see column (1) of Table 3).
This result is strikingly interesting because it suggests that the determination of the local coffee equilibrium price does not depend on the demand and supply forces in the Mexican market. Furthermore, the local equilibrium price is deter- mined based on the international price alone. On the other hand, if we follow the ECM estimation using the full sample, we no longer find a long run relationship between these three variables (see column (2) of Table 3).
Our ECM is robust to changes in the estimation period within the sample analysed. We show this performing a coefficients stability analysis using a CUSUM test. Figure 3 shows the accumulated sums of recursive residuals behav- iour (CUSUM) and the accumulated sum of squared recur- We decided to do this to permit greater comparability with
previous research.
Thus, our plan is to estimate the proposed ECM in the period 2004-2013, which corresponds to the hypothesised break in the international price passthrough. Then we will offer a sensibility analysis of our estimation using a “rolling window” with 10 years of data. Additionally, we perform the estimation of the ECM with the complete sample to avoid any concern of ad-hoc analysis in our results. And, finally, we provide an estimation of the speed of adjustment param- eter using a traditional unconditional VEC model.
Results and discussion
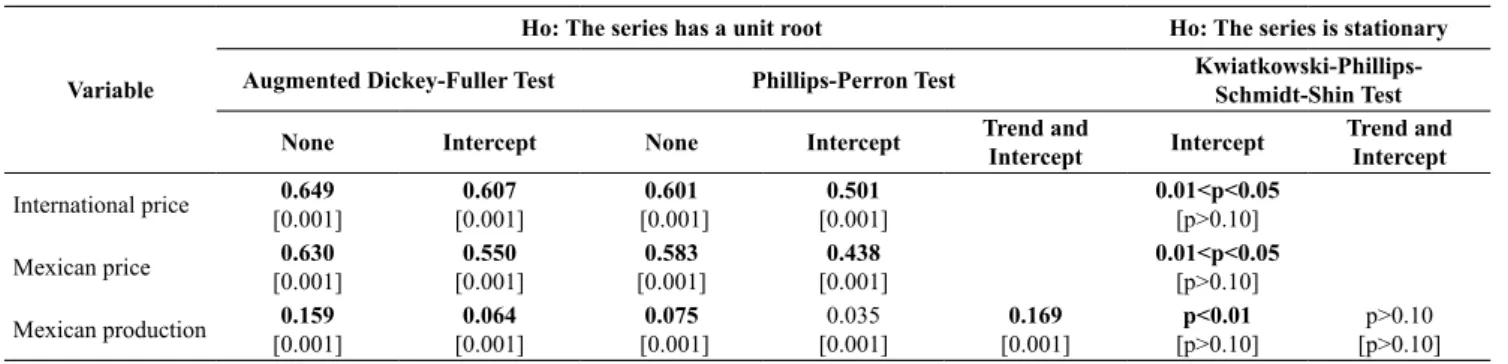
We first verify that our variables of interest have the same integration order. To do that, we evaluate the existence of a unit root using the following tests: Augmented Dickey- Fuller (ADF), Phillips-Perron (PP) and Kwiatkowski- Phillips-Schmidt-Shin (KPSS). Our analysis suggests that all series are non-stationary. Furthermore, we find that all three variables are integrated of order one, I(1). The latter was confirmed by unit root tests to the series in first differences.
Indeed, these tests suggest that the stationarity of the series is induced with the first difference (see Table 1).
On the other hand, even if all series of interest are inte- grated of the same order, we would like to know if there could be an equation that expresses the long run equilibrium relationship of these variables. This can be tested by per- forming a Johansen cointegration test. To do it, we specify an autoregressive vector of order three, considering that the series have intercept but not trend (as suggested by the unit root tests). In both, the trace test and the maximum eigen- value test, the null hypothesis of zero cointegration vectors Table 1: Unit root test.
Variable
Ho: The series has a unit root Ho: The series is stationary
Augmented Dickey-Fuller Test Phillips-Perron Test Kwiatkowski-Phillips-
Schmidt-Shin Test
None Intercept None Intercept Trend and
Intercept Intercept Trend and Intercept International price 0.649
[0.001] 0.607
[0.001] 0.601
[0.001] 0.501
[0.001] 0.01<p<0.05
[p>0.10]
Mexican price 0.630
[0.001] 0.550
[0.001] 0.583
[0.001] 0.438
[0.001] 0.01<p<0.05
[p>0.10]
Mexican production 0.159
[0.001] 0.064
[0.001] 0.075
[0.001] 0.035
[0.001] 0.169
[0.001] p<0.01
[p>0.10] p>0.10 [p>0.10]
Note: Unit Root Test performed for the monthly period 2004m01-2013m12. We show the p-values to reject the Ho. Numbers in bold suggest that the series has a unit root, with 95% confidence. In brackets, we show the p-value for the test with the differenced series.
Source: Own calculations
Table 2: Results of Cointegration Johansen test.
Ho: number of cointegrating vectors
Intercept without Trend
Maximum Eigenvalue Test Trace Test
Statistics Critical values Statistics Critical values
r = 0 48.375* 21.132 56.217* 29.797
r <= 1 6.128 14.265 7.842 15.495
r <= 2 1.714 3.841 1.714 3.841
Note: Cointegration Johansen test performed for the monthly period 2004m01-2013m12. A star (*) denotes that Ho is rejected at 5% of statistical significance.
Source: Own calculations
sive residuals (CUSUM squared). In both tests, the CUSUM values are situated between the 95 percent confident inter- val. This suggests that the fitted ECM is parsimonious and stable.
Following Engle and Granger (1987), we also estimate the speed of adjustment of the Mexican price to exogenous changes in the variables of interest, which affect the cointe- gration relation. We find that the coefficient of adjustment obtained from a traditional VEC model estimated before the break is -0.41. This suggests that deviations from the long- run relation will be adjusted in 41% next period. Further- more, the full sample estimation suggests a much smaller speed of adjustment (-0.13). These results are comparable with previous finding in the literature. On the other hand, the speed of adjustment derived from our ECM is close to one (-0.91) in the period before the break. This implies an almost instant adjustment of Mexican prices to deviations from the equilibrium. Similarly, ECM estimations in the full sample period suggest a speed of adjustment close to zero (-0.09),
which implies an unstable equilibrium. This latter finding supports the idea that there is a break in the long run relation- ship between international and Mexican coffee prices, after the year 2013. Indeed, the additional observations included in the full sample model change dramatically the estimated coefficients in the cointegration vector because, in recent years, both variables are no longer in long term equilibrium.
Taken altogether, the results of our ECM suggest a strong transmission of the international coffee price into the Mexi- can market before the hypothesised break (in 2014). Further- more, we show that Mexican coffee production does not play any role in the determination of the local price. However, if we include the period of the break in our analysis, we find that the long-term relationship between international and Mexican coffee price disappears. However, at this point we have yet to prove whether there was effectively a break in the passthrough of the international price of coffee.
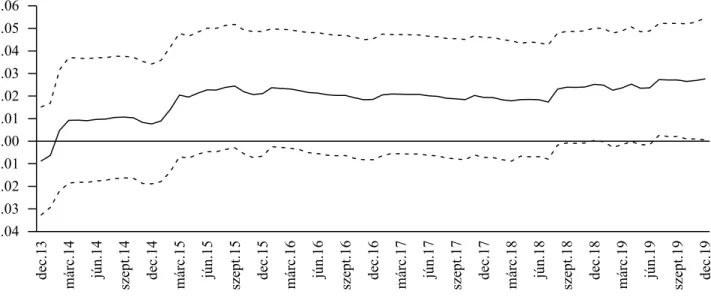
To determine whether the long-term relationship between the price series was broken, we analyse the regressions of the ECM by adding observations at the end of the series, under the rolling window approach as suggested by Gálvez- Soriano (2020). In Figure 4 we summarise the rolling win- dow analysis to estimate the coefficient associated with the international price (in the cointegration vector). The dashed grey lines are the confidence intervals at the 95% level and the continuous grey line corresponds to the coefficient asso- ciated to the international price in the vector of cointegration (estimated with different rolling windows of time, starting with 2004-2013 and finishing with 2008-2018).
Note that the estimate of the coefficient associated with the international price is stable and consistent until the year 2014. Afterwards, the estimation of the coefficient decreases constantly. This reduction in the coefficient suggests that the long-term relationship between the national and inter- national prices began losing strength from 2015 onwards.
However, the period with the clearest reduction in the mag- nitude of the estimated coefficient is observed until 2017. In fact, although it is clear graphically that both prices behaved differently since 2014 (see Figure 1), we can argue that the Table 3: ECM estimation.
Dependent Variable: DLOG(mx_price) Method: Least Squares
Sample: 2004-2013 2004-2019
Variable (1) (2)
LOG(mx_price(-1)) -0.91***
(0.185) -0.09*
(0.050)
LOG(int_price(-1)) 0.93***
(0.188) 0.04
(0.46)
LOG(mx_prod(-1)) -0.01
(0.012) 0.00
(0.009)
Adjustment coefficient -0.41 -0.13
R-squared 0.453 0.501
Sum of squared residuals 0.183 0.249
Durbin-Watson statistic 2.091 1.819
Note: This table shows only the vector of cointegration of our ECM. Column (1) shows the results of the model estimated with the sample before the break. Column (2) shows the results of the estimation using the full sample. Both models were esti- mated using EViews 9. Standard errors in parenthesis. ***p<0.01, **p<0.05, *p<0.10.
Source: Own calculations
(b) CUSUM of squares -30
-20 -10 0 10 20 30
2007 2008 2009 2010 2011 2012 2013
-0.2 0.0 0.2 0.4 0.6 0.8 1.0 1.2
2007 2008 2009 2010 2011 2012 2013
(a) CUSUM Figure 3: CUSUM test results.
Note: This Figure shows the CUSUM tests for our VEC model using the sample before the break. This suggests that the ECM coefficients are stable to changes in time data.
Source: Own calculations
passthrough of the international price of coffee disappears since the year 2017 in terms of the loss in the statistical sig- nificance (see Figure 4). On the other hand, interestingly the loss in the relationship between international and Mexican coffee prices was accompanied with an improvement in the long-run relationship between Mexican coffee price and Mexican coffee production (see Figure 5).
The breakdown in the price relationship could be related to the presence of the coffee rust plague that affects Mexican production. This mechanism is plausible if domestic coffee supply shocks affect the relationship between international and domestic coffee prices. We find suggestive evidence of this latter claim when we perform the rolling window analy- sis, where we observe that the weaker the prices relationship, the stronger the production-price relationship. Indeed, coffee
production registered for the 2015-2016 agricultural cycle was the lowest during the last thirty years. Consequently, Mexican coffee exports decreased and reached its minimum in this same period (see online appendix). Following this logic, domestic supply shocks affect the relationship between international and domestic prices through a reduction in the participation of international coffee trade and, hence, a diminishing importance of international prices.
On the other hand, this break could also be associated with structural changes in the economy (such as changes in agricultural productivity that cause changes in the local price regardless of the international price) and/or policy changes (such as government programmes, guaranteed prices, etc.).
These possible explanations, although interesting to our find- ings, are left as open questions to future research.
-0.04 -0.03 -0.02 -0.01 0.00 0.01 0.02 0.03 0.04 0.05 0.06
dec.13 márc.14 jún.14 szept.14 dec.14 márc.15 jún.15 szept.15 dec.15 márc.16 jún.16 szept.16 dec.16 márc.17 jún.17 szept.17 dec.17 márc.18 jún.18 szept.18 dec.18 márc.19 jún.19 szept.19 dec.19
Figure 4: Price and quantity long-term relationship.
Note: Continuous grey line represents the estimate of the coefficient associated with the international price, for different windows of time (all finished at the date indicated). Dotted grey line indicate the 95% confidence interval.
Source: Own calculations.
-0.2 0.0 0.2 0.4 0.6 0.8 1.0 1.2 1.4 1.6
dec.13 márc.14 jún.14 szept.14 dec.14 márc.15 jún.15 szept.15 dec.15 márc.16 jún.16 szept.16 dec.16 márc.17 jún.17 szept.17 dec.17 márc.18 jún.18 szept.18 dec.18 márc.19 jún.19 szept.19 dec.19
Figure 5: Long-term prices relationship breakdown.
Note: Continuous grey line represents the estimate of the coefficient associated with the Mexican quantity of coffee produced, for different windows of time (all estimated periods finish at the date shown). Dotted grey line indicate the 95% confidence interval.
Source: Own calculations
Conclusions
Our motivation for writing this paper was to discuss a graphically evident break in the transmission of international coffee prices to the Mexican coffee market. This hypoth- esised break starts in 2014, but later we showed that the statistical relationship between local and international price weakens over time. To evaluate our hypothesis, we proposed to measure the long-run relationship of both variables (plus Mexican coffee production as control) using a single equa- tion conditional ECM. With this model, we were able to estimate the influence of the variables that affect the price received by Mexican producers as well as to evaluate the sensitivity of the long-run relationship to exogenous changes (in our case, to the hypothesised break).
We began our estimations using the period prior to the hypothesised break (2004-2013). Our results suggest that an increase of 1% in the international price of coffee increases in 0.9% the Mexican price. This estimation is larger than previous findings in the literature, which is consistent with the idea that trade agreements and globalisation contribute to the integration of the markets (Baffes and Gardner, 2003;
Krivonos, 2004 and Jaramillo and Benítez, 2016). Neverthe- less, we want to highlight here that this strong relationship corresponds to a period that does not include the hypoth- esised break in the international coffee price passthrough and which, furthermore, only examines the situation post- NAFTA.
Interestingly, we found no effect of Mexican production on its local price. This result has not been noticed previously in the literature and it is a striking finding because it suggests that the determination of the local coffee equilibrium price does not depend on the demand and supply forces in the Mexican market. On the other hand, we estimated the speed of adjustment of the Mexican price to exogenous changes in the variables of interest, which affect the cointegration relation. We found that deviations from the long-run relation will be adjusted by 40% in the next period (in the pre-break sample, 2004-2013). This estimation is 8 percentage points larger than the estimations of Jaramillo and Benítez (2016) in relation to a similar sample period (2000-2010).
We have offered evidence of a breakdown in the rela- tionship of Mexican and international prices. Indeed, we applied our ECM to the full-sample period (2004-2019), and we found that the international price no longer has any statistically significant effect on the Mexican price. Further- more, we gave further support to that finding by perform- ing a rolling window analysis. Our results suggest that the breakdown started in 2015 but caused a loss in the statistical significance of the long-run relationship between prices until 2017. This event is relevant to further research on the effect of crop prices on the smallholders’ well-being in developing economies.
Finally, we claim that the findings in this paper are rel- evant for policy decisions. Indeed, the break in the coffee transmission prices suggests that coffee smallholders are now less integrated with the supply chain. Hence, they are becoming more exposed to an increasing number of inter- mediaries, which reduces the price paid to producers and increases the final price paid by consumers. Given this
market imperfection, the government may intervene to reduce the inefficiencies either by buying the product directly from coffee smallholders or by improving the com- muting roads, so that the industrial companies can reach the small producers more easily instead of buying from inter- mediaries. Moreover, the government could provide financ- ing options for producers to purchase the capital equipment needed (hulling and roasting machinery) to transform cof- fee beans into commercial coffee because this process will reduce the number of intermediaries. We consider these two latter points as other potential avenues for further research.
Acknowledgements
We are grateful for the valuable comments of José Jara- millo, Eusebio Torres and two anonymous reviewers from Studies in Agricultural Economics. This research was sup- ported by the Mexican National Council for Science and Technology (Conacyt) and the University of Houston.
References
Alonso, J.C. and Estrada, D. (2016): El precio mundial del café y su efecto en el precio minorista para las cinco principales ciudades de Colombia. Revista Finanzas y Política Económica, 8 (2), 379–399. https://doi.org/10.14718/rf&pe.v8i2.1163
de la Vega, S., Téllez, Y. and López, J. (2012): Índice de margin- ación por localidad 2010. Consejo Nacional de Población, México. Retrieved from: conapo.gob.mx (Accessed in March 2021)
Banerjee, A., J. Dolado, J.W. Galbraith and D.F. Hendry (1993):
Co-Integration, Error Correction, and the Econometric Analy- sis of Non-Stationary Data. New York: Oxford University Press. https://doi.org/10.1093/0198288107.001.0001
Baffes, J. and Gardner, B. (2003): The Transmission of World Com- modity Prices to Domestic Markets Under Policy Reforms in Developing Countries. The Journal of Policy Reform, 6 (3), 159-180. https://doi.org/10.1080/0951274032000175770 Box, G.E. and Cox, D. (1964): An analysis of transformations. Jour-
nal of the Royal Statistical Society: Series B (Methodological), 26 (2), 211–243. https://doi.org/10.1111/J.2517-6161.1964.
TB00553.X
Elms, R. (2019): Mexican Coffee Production Continues to Rebound from Coffee Rust Disease. GAIN Report Number MX9020.
United States Department of Agriculture. Retrieved from: apps.
fas.usda.gov (Accessed in February 2021)
Elms, R. and Otero, A. (2020): Coffee Annual Mexico. GAIN Report Number MX2020-0026. United States Department of Agriculture.
Engle, R.F. and Granger, C.W. (1987): Co-integration and error correction: representation, estimation, and testing. Economet- rica: Journal of the Econometric Society, 55 (2), 251–276.
https://doi.org/10.2307/1913236
Gálvez-Soriano, O. (2018): Forecasting the Agricultural Sector of Mexico. IN Pérez, F.S., Figueroa, E.H., Godínez, L.M., Tevera, M.E.C. and Perez, R.A.F. (eds.). Economía, Finanzas y Desar- rollo Social en México, 1, 42–58. ASMIIA.
Gálvez-Soriano, O. (2020): Nowcasting Mexico’s Quarterly GDP using Factor Models and Bridge Equations, Estudios Económi- cos, 35 (2), 213–265. https://doi.org/10.24201/ee.v35i2.402
Jaramillo, J. and Benítez, E. (2016): Transmisión de precios en el mercado mexicano e internacional de café (Coffea arabica L.):
Un análisis de cointegración. Agrociencia, 50 (7), 931–944.
Jena, P.K. (2016): Commodity market integration and price trans- mission: Empirical evidence from India. Theoretical and Applied Economics, 23 (3), 283–306.
https://doi.org/10.5958/0976-4666.2017.00051.1
Kremers, J.J.M., Ericsson, N.R. and Dolado, J. (1992): The power of cointegration tests. Oxford Bulletin of Economics and Sta- tistics, 54, 325–348. https://doi.org/10.1111/j.1468-0084.1992.
tb00005.x
Krivonos, E. (2004): The impact of coffee market reforms on pro- ducer prices and price transmission. The World Bank Policy Research Working Paper, 3358.
SAGARPA (2017): Planeación Agrícola Nacional 2017-2030: Café mexicano. Secretaría de Agricultura, Ganadería, Desarrollo
Rural, Pesca y Alimentación. Retrieved from: gob.mx (Accessed in March 2021)
Vavra, P. and Goodwin, B.K. (2005): Analysis of Price Transmis- sion Along the Food Chain. OECD Food, Agriculture and Fisheries Working Papers. No. 3. OECD Publishing.
Wohlgenant, M.K. (2001): Marketing margins: Empirical analysis.
Handbook of agricultural economics, 1, 933–970.
Worako, T.K., van Schalkwyk, H.D., Alemu, Z.G. and Ayele, G.
(2008): Producer price and price transmission in a deregu- lated Ethiopian coffee market. Agrekon, 47 (7), 492–508.
https://doi.org/10.1080/03031853.2008.9523812
Zivot, E. (2000): The power of single equation tests for cointegra- tion when the cointegrating vector is prespecified. Econometric Theory, 16 (3), 407–439.
Annex
In this annex we make two points regarding the main results of our paperr. First, exports reflect the drastic reduc- tion in Mexican production but also support our conclusion about the international coffee price fading pass-though.
Second, quantity of coffee produced in Mexico is gradu- ally recovering importance in the determination of the local price.
A1. Coffee exports
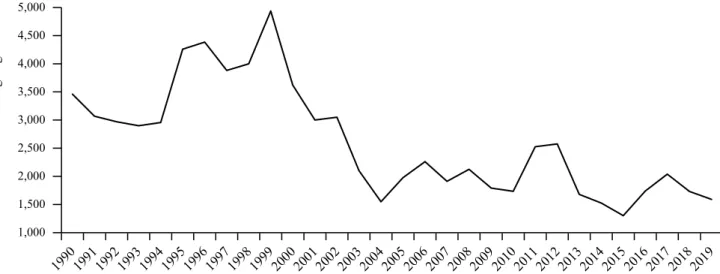
In this paper, we suggest that the breakdown in the price relationship could be related to the presence of the coffee rust plague that affects Mexican production. We also point out that coffee production reached a minimum in the 2015-2016 agricultural cycle, among the last thirty years. At the same time, Mexican coffee exports have decreased since 2000 and have reached its minimum in 2015 (see Figure A1). There- fore, a lower coffee production undermines the relationship with the international trade (in terms of exports) and, hence, with the international prices.
Additionally, it is worth to notice that exports have main- tained a low level since 2003. In particular, Mexican coffee exports have remained at a historically low level since the breakdown in the price relationship.
A2. Long run relationship between price and quantity (Mexican market)
In this paper, we document a break in the price relation- ship (between 2014 and 2015, which became statistically significant until 2017). Thus, we suggest that because of the break the Mexican coffee price does no longer follow the changes of the international coffee price. Furthermore, we find that, before 2014, Mexican coffee production did not play any role in the Mexican price determination. However, we also find that more recently Mexican coffee production is gaining importance in the determination of Mexican price (see Figure 4). This latter result suggests that, in the medium run, coffee production will be a relevant factor in the deter- mination of the coffee price (in the Mexican market). All these results have important policy implications, which are discussed in our paper.
1,000 1,500 2,000 2,500 3,000 3,500 4,000 4,500 5,000
Thousands of 60 kg bags
Figure A1: Green coffee bean Mexican exports.
Note: Green coffee exports show a declining behaviour even before our hypothesised break, but also show its minimum level in 2015.
Source: United States Department of Agriculture, Foreign Agricultural Service