Introduction
Agriculture accounts for 33.3% of total GDP, 78% of total exports and more than 70% of total employment to the Ethiopian economy (NBE, 2019; USDA, 2019). Develop- ment of smallholder crops and pastoral agriculture will be further enhanced and hence will remain the main source of growth and rural transformation during the GTP II period (NPC, 2016). However, development of the agricultural sector has been hampered by a range of constraints which include land degradation, low technological inputs, weak institutions, and lack of appropriate and effective agricul- tural policies and strategies (Aklilu, 2015).
Ethiopia is known to be the birthplace for coffee. Cof- fee is the major export commodity cultivated in Ethiopia.
Coffee grown in Ethiopia is known all over the world for its excellent quality and flavour. Today, Ethiopia stands as the biggest coffee producer and exporter in Africa and also ranks amongst the leading producers and exporters in the world.
According to NBE (2019) report, export earnings from cof- fee grew by 13.5 percent over last year same quarter due to 36.0 percent increase in export volume despite a 16.5 per- cent decline in the international price; coffee’s contribution to total export earnings remained close to 32 percent.
There are structural changes taking place in the coffee export sector in Ethiopia. Cooperatives and commercial farms are on the increase, with lower concentration ratios in the export sector. On the other hand, the share of the incum- bents in the local coffee market is large. While the Ethiopian Commodity Exchange, which was established in 2008, intro- duced regulatory, institutional, and organisational innova- tions in the coffee market, informal norms and conventions remain the primary institutions governing transactions in the local markets (Fekadu et al., 2016). An efficient, integrated, and accurately responsive market mechanism is of critical
importance for optimal allocation of resources in agriculture and for stimulating farmers to increase output.
A total area of 6,606.55 ha was allocated for coffee production (in 2016/17 meher season) in Arsi Zone (CSA, 2017) and Gololcha district is found on the 14th from top 18 coffee producing districts in Oromia (Warner et al., 2015).
A total area of 13,466 Ha of land was allocated for produc- tion and 35,750 quintals of coffee clean bean was obtained in 2018 (GDOoANR, 2018). However, the study conducted by Degaga et al. (2017) showed farmers in the study area sold dried cherries to local traders at a low price which could not cover their cost of production.
Various studies on coffee producers’ market outlet choices (Diro et al., 2017; Engida, 2017; Negeri, 2017; and Asefa et al., 2016) were conducted in different parts of the coun- try. However, past studies conducted on different regions of Ethiopia, did not address the market outlet choice deci- sion of coffee producers in the study area. Therefore, given the potential of Gololcha District for coffee production, the results of this study are of real importance as they shed light on factors affecting the choice of appropriate market outlets.
Hence, this study has aimed to identify the determinants of market outlet choice decision of coffee producers in the study area.
Literature Review on Determinants of Market Outlet Choices
Negeri (2017) employed a multinomial logistic model to examine the major determinants of market outlet choice of coffee producing farmers in Lalo Assabi District of West Wollega zone, Ethiopia. The model showed that the choice of end consumer outlet is positively and significantly Jima DEGAGA* and Kumilachew ALAMERIE**
Determinants of Coffee Producer Market Outlet Choice in Gololcha District of Oromia Region, Ethiopia: A Multivariate Probit Regression Analysis
The study was conducted in Gololcha District of Arsi Zone with the objective of identifying determinants of coffee producer market outlet choice. The primary data were collected through personal interviews from a total of 154 producers, using struc- tured and semi-structured questionnaires. The multivariate probit model result indicated that the sex of the household head, level of education, means of transport ownership and access to information had positively influenced choice of wholesaler and negatively influenced choice of agent middle-men. Level of education was significantly and negatively related with agent middle-men, and significantly and positively influenced cooperatives’ and wholesalers’ channel choice. Enhancing institu- tional and infrastructural (transportation and extension) facilities is necessary to enable coffee producers to select efficient channels. In addition, the study recommends that steps be taken to establish and support multi-purpose coffee farmers’
cooperatives – grow their membership, as this should increase farmers’ income through marketing activities and supply of important inputs.
Keywords: coffee, market outlet, choice, Ethiopia JEL classification: Q13
* Department of Agricultural Economics, Ambo University, P. O. Box 19, Ambo, Ethiopia. Corresponding author: jimadegaga2@gmail.com
** School of Agricultural Economics and Agribusiness, Haramaya University, P.O. Box 138, Dire Dawa, Ethiopia.
Received: 8 May 2020, Revised: 12 June 2020, Accepted: 19 June 2020.
affected by access to transportation facilities, access to price information and access to credit compared to private trader outlet, whereas the quantity of coffee sold and access to extension services negatively affected the main choice of end consumer outlet. Similarly, the choice of cooperative outlet is positively and significantly affected by distance to the market, access to transportation facilities, access to price information and access to training as compared to a private trader outlet.
Similarly, Hailu and Fana (2017) used a multinomial logit model to analyse the determinants of market outlet choice for major vegetables crops in Ambo and Toke-Kutaye Dis- tricts, West Shewa, Ethiopia. The result indicated that fam- ily size and access to market negatively affected choice of retailer channel. In the same manner, dummy model farmer, education level, and access to credit decrease the likelihood of a retailer channel being chosen while having the oppo- site effect on the wholesaler channel. Livestock in TLU and access to market meanwhile decrease the likelihoodof a wholesaler channel being selected.
Similarly, Diro et al. (2017) studied the share of coffee market outlets among smallholder farmers in western Ethio- pia by employing a multinomial logistic regression model.
Consumers, brokers, cooperatives, urban, and rural traders were found to be the main coffee market outlets in the area.
They further noticed that sex was a positive and significant factor, which implies that male farmers prefer cooperatives to sell their coffee as compared to female farmers. According to the study, the logic behind this could be male farmers have more resources for transportation and time to sell their coffee product to markets even when the markets are far away from their residence.
Negeri (2017) in his study of the determinants of market outlet choice by coffee producing farmers in West Wollege zone, Ethiopia, used a multinomial logistic regression model and the results of the model showed that the choice of end consumer outlet is positively and significantly affected by access to transportation facilities, access to price information
and access to credit as compared to a private trader outlet, whereas the quantity of coffee sold and access to extension services negatively affected the main choice of end consumer outlet. Similarly, the choice of cooperative outlet is posi- tively and significantly affected by distance to the market, access to transportation facilities, access to price information and access to training as compared to a private trader outlet.
On the other hand, Sori (2017) identified factors affecting market outlet choices of groundnut producers in Digga Dis- trict of Oromia State, Ethiopia by using a multivariate pro- bit model. The result of the model identified that variables like educational level, distance to the nearest market, access to extension service, size of land allocated for groundnut, quantity of groundnut produced, transport facilities, buyers’
trust and access to off/nonfarm income affected the choice of appropriate market outlets of producers.
Efa and Tura (2018) also employed multivariate probit model to analyse the determinants of tomato smallholder farmers’ market outlet choices in West Shewa, Ethiopia. The result of the study revealed that distance to nearest markets, access to credit, family size, age of household head, educa- tion status, farming experience and volume of tomato pro- duced significantly influence choices of tomato market chan- nels. Retailer market outlet choices were negatively affected by age of household head, education status and distance to the nearest market whereas access to credit had a positive affectto varying levels of significance. However, wholesaler market outlet choices were negatively affected by access to credit, family size and amount of tomato produced to vary- ing levels of probability.
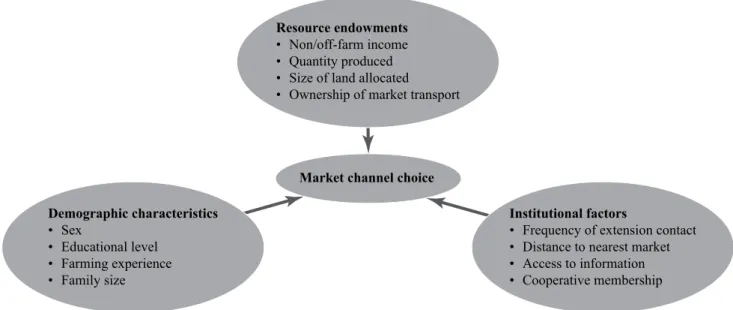
Resource endowment (economic factors) such as own- ership of market transportation, size of land allocated to coffee production, quantity of coffee produced and non- farm income have an influence on producers’ market outlet choices. Figure 1 illustrates the key variables used in the study and shows how they influence the market outlet choice of coffee producers in the area studied.
Resource endowments
• Non/off-farm income
• Quantity produced
• Size of land allocated
• Ownership of market transport
Demographic characteristics
• Sex
• Educational level
• Farming experience
• Family size
Institutional factors
• Frequency of extension contact
• Distance to nearest market
• Access to information
• Cooperative membership Market channel choice
Figure 1: Conceptual framework of the study.
Source: own compilation from literature review
Methodology
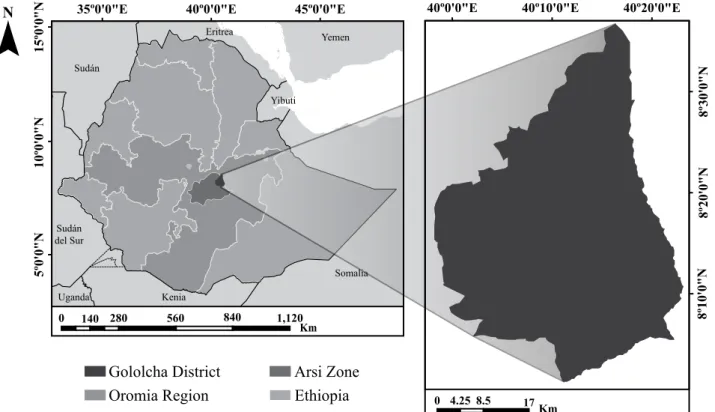
Description of the Study Area
The study was conducted in the Gololcha district. It is one of the districts in Arsi zone with potential of coffee produc- tion. Gololcha is located at about 281 km from Addis Ababa, the capital city of Ethiopia and 206 km from Asella, which is the capital town of Arsi zone. It is bordered by Aseko dis- trict in the north, Amigna district in the south, Shenan Kolu district in the east and Chole district in the west. The district has 23 rural kebeles and from this 20 kebeles are coffee pro- ducers. The altitude of the district ranges from 1400 to 2500 metres. Generally, the district has a total area of 178,102 hec- tares and is classified into two agro-ecologies, the midland (25%) and the lowland (75%). The average temperature of the district is 35 °C and the average rainfall is 900 mm/year.
Total population of the district is estimated to be 201,247, out of which 102,502 are males and 98,745 are females. The main rainy season of the district is in April, May, June, July, August and September. The soil type of the district is silt soil and sandy soil. Major crops produced in the district are cof- fee, maize, sorghum, teff and groundnut (GDOoANR, 2018).
Methods of Data Collection and Sampling
The study has utilised both primary and secondary data sources. Primary data was collected from sample respondents using a structured interview schedule. Before data collection, the questionnaire was tested on some farmers to evaluate the appropriateness of the design, clarity and interpretation of
the questions, plus the relevance of the questions, to make sure important issues had not been left out and to estimate the time required for an interview. Training was given to enumerators regarding the objectives of the study and, in particular, on the detailed contents of the questionnaire.
Secondary data on the population size of the study areas and the agro-climatic condition of the study area were taken from unpublished documents of the district agricultural and natural resource office, and the coffee and tea development and marketing authority.
A two-stage random sampling technique was used to select coffee producing kebeles and sample farm house- holds. In the first stage, 4 coffee producing kebeles were purposively selected from 20 coffee producing kebeles. In the second stage, from the total number of coffee producers, 154 household heads were selected randomly based on prob- ability proportional to population size.
Knapp and Campell (1989) suggested a rule of thumb which states that for most multivariate analysis, the number of observations should be at least 10 times the number of variables and exceed the number of variables by at least 30.
This means, n ≥ 10 v + 30 (1) where, n = is number of observations,
v = is number of variables
The number of variables hypothesized in this study were 12 and therefore, the minimum size of total sample would be, n ≥ 10 (12) + 30 → n ≥ 50. Table 1 summarises how the number of sample households is related to the total number of coffee producers.
5º0'0"N10º0'0"N15º0'0"N 40º0'0"E 40º10'0"E 40º20'0"E
8º10'0"N8º20'0"N8º30'0"N 35º0'0"E 40º0'0"E 45º0'0"E
N
0 140 280 560 840 1,120
Km
0 4.25 8.5 17 Km
Gololcha District Arsi Zone
Oromia Region Ethiopia
Figure 2: Geographical map of the study area.
Source: own sketch From Ethio-GIS
Hypothesis and Definitions of Variables
Dependent Variable
Market Outlets (MRKTUOT): This is a binary dependent variable measured by the probability of producers sell coffee to either of the alternatives market outlets. It was represented in the model as Y1 for those households who choose to sell coffee to cooperatives, Y2 for producers who choose whole- salers, and Y3 for producers who choose commission men to sell their coffee.
Independent Variables
The explanatory variables hypothesised to influence mar- ket outlet choice of coffee producers were the following.
Sex of the household head (SEXHH): It is a dummy vari- able taking a value of 1 if the household head is male and 0 otherwise. Male farmers have more resource for transporta- tion and time to sell their coffee product to markets even when the markets are far away from their residence (Diro et al., 2017). Therefore, the sex of the household head (being male) was expected to affect the likelihood of choosing cooperatives and wholesalers positively, and choice of com- mission men negatively.
Education status of the Household Head (EDHH): It is a continuous variable that refers to the number of years of formal schooling the household head attended. Educated household heads are expected to have better skill, better access to information and to make better use of their avail- able resources. The more educated the farmers are, the more likely they are to participate in retail channels, possibly as higher levels of education may help farmers to adjust to new market requirements and making them more likely to adopt innovative production practices (Efa and Tura, 2018).
Medeksa (2014) also reported that education level provides positive predictive power, whether or not the household chooses a cooperative as its market outlet. Therefore, it was expected to affect the likelihood of choosing cooperatives and wholesalers positively, and of commission men nega- tively.
Family size in terms of adult equivalent (FAMSZ): It is a continuous variable measured in terms of adult equivalent.
The availability of an active labour force in a household is assumed to affect the household’s decision in choosing a given market outlet within the coffee market chain. Honja et al. (2017) reported that family size is positively correlated with the choice of wholesaler outlet and demonstrated that households with a larger family size have plenty of labour force to deliver mangoes to their final market. Hence, it was hypothesised that family size influences the likelihood of choosing cooperatives and wholesalers positively and of commission men negatively.
Size of land allocated to coffee production (AREACOFE):
This is a continuous variable measured in terms hectare of land allocated for coffee production by the household. The likelihood of choosing private traders and cooperative mar- ket outlet was positively and significantly affected by size Method of Data Analysis
Both descriptive statistics and econometric analysis were used to analyse collected data from households. Descriptive statistics such as mean, maximum, minimum, standard devi- ation, frequencies, percentages and graphs were used. The multinomial logit model is the most frequently used nominal regression model (Long and Freese, 2014). In a multinomial logit model, there is a single decision among two or more alternatives. Odds ratios in the multinomial logit are inde- pendent of the other alternatives. This property is convenient as regards estimation, but it is not a particularly appealing restriction to place on consumer behaviour. The independ- ence assumption follows from the initial assumption that the disturbances are independent and homoscedastic (Greene, 2003).
In the study area, cooperative, wholesalers and agent middle-men were coffee producers’ outlets and the decision to sell to existing outlets reflected this. According to Belder- bos et al. (2004), the multivariate probit model takes such correlations into account. If a correlation exists, the estimates of separate (probit) equations for the cooperation decisions are inefficient. Therefore, multivariate probit model was used to for the determinants of marker outlet choice. Fol- lowing Greene (2012), the multivariate probit model can be specified as;
1if otherwise,
, ,
, ,
, ,
, ,
, , , , ,
, ,
, , ,
,
Y X ,Y Y 0, 0
m m
E X X
Var X X
Cov X X
Y Y Y X X X
i n
L q X q X R
q
R q q 1
0 1
1
2 1
' *
* m
* m '
m m m m
*
m m
m m
j m m jm
i i im i i im
i m i i im im im
im yim
jm ij im jm
1
1
1
1 2 1 2
1 1 1
f f
f f
f f
f
f
2
;
;
;
;
= b +f =
f f
f f t
z b b
t
=
=
=
=
=
=
= -
=
^ h
6 6
6 6
@
@
@
@
(2)
In a multivariate model, where the choice of several mar- ket outlets is possible, the error terms jointly follow a mul- tivariate normal distribution (MVN) with zero conditional mean and variance normalized to unity;
1if otherwise,
, ,
, ,
, ,
, ,
, , , , ,
, ,
, , ,
,
Y X ,Y Y 0, 0
m m
E X X
Var X X
Cov X X
Y Y Y X X X
i n
L q X q X R
q 1
0 1
1
2 1
' *
m
* m '
m m m m
*
m m
m m
j m m jm
i i im i i im
i m i i im im im
im yim
1
1
1
1 2 1 2
1 1 1
f f
f f
f f
f
f
2
;
;
;
;
= b +f =
f f
f f t
z b b
=
=
=
=
=
=
= -
^ h
6 6
6 6
@
@
@
@
, (3)
1if otherwise,
, ,
, ,
, ,
, ,
, , , , ,
, ,
, , ,
,
Y X ,Y Y 0, 0
m m
E X X
Var X X
Cov X X
Y Y Y X X X
i n
L q X q X R
q 1
0 1
1
2 1
' *
* m
* m '
m m m m
*
m m
m m
j m m jm
i i im i i im
i m i i im im im
im yim
1
1
1
1 2 1 2
1 1 1
f f
f f
f f
f
f
2
;
;
;
;
= b +f =
f f
f f t
z b b
=
=
=
=
=
=
= -
^ h
6 6
6 6
@
@
@
@
, (4)
1if otherwise,
, ,
, ,
, ,
, ,
, , , , ,
, ,
, , ,
,
Y X ,Y Y 0, 0
m m
E X X
Var X X
Cov X X
Y Y Y X X X
i n
L q X q X R
q
R q q 1
0 1
1
2 1
' *
* m
* m '
m m m m
*
m m
m m
j m m jm
i i im i i im
i m i i im im im
im yim
jm ij im jm
1
1
1
1 2 1 2
1 1 1
f f
f f
f f
f
f
2
;
;
;
;
= b +f =
f f
f f t
z b b
t
=
=
=
=
=
=
= -
=
^ h
6 6
6 6
@
@
@
@
, (5) The joint probabilities of the observed events;
1if otherwise,
, ,
, ,
, ,
, ,
, , , , ,
, ,
, , ,
,
Y X ,Y Y 0, 0
m m
E X X
Var X X
Cov X X
Y Y Y X X X
i n
L q X q X R
q
R q q 1
0 1
1
2 1
' *
* m
* m '
m m m m*
m m
m m
j m m jm
i i im i i im
i m i i im im im
im yim
jm ij im jm
1
1
1
1 2 1 2
1 1 1
f f
f f
f f
f
f
2
;
;
;
;
= b +f =
f f
f f t
z b b
t
=
=
=
=
=
=
= -
=
^ h
6 6
6 6
@
@
@
@
1if otherwise,
, ,
, ,
, ,
, ,
, , , , ,
, ,
, , ,
,
Y X ,Y Y 0, 0
m m
E X X
Var X X
Cov X X
Y Y Y X X X
i n
L q X q X R
q
R q q 1
0 1
1
2 1
' *
* m
* m '
m m m m*
m m
m m
j m m jm
i i im i i im
i m i i im im im
im yim
jm ij im jm
1
1
1
1 2 1 2
1 1 1
f f
f f
f f
f
f
2
;
;
;
;
= b +f =
f f
f f t
z b b
t
=
=
=
=
=
=
= -
=
^ h
6 6
6 6
@
@
@
@ that form the basis for the log-likelihood function are the m-variate normal probabilities,
1if otherwise,
, ,
, ,
, ,
, ,
, , , , ,
, ,
, , ,
,
Y X ,Y Y 0, 0
m m
E X X
Var X X
Cov X X
Y Y Y X X X
i n
L q X q X R
q
R q q 1
0 1
1
2 1
' *
* m
* m '
m m m m*
m m
m m
j m m jm
i i im i i im
i m i i im im im
im yim
jm ij im jm
1
1
1
1 2 1 2
1 1 1
f f
f f
f f
f
f
2
;
;
;
;
= b +f =
f f
f f t
z b b
t
=
=
=
=
=
=
= -
=
^ h
6 6
6 6
@
@
@
@
, (6) Where,
1if otherwise,
, ,
, ,
, ,
, ,
, , , , ,
, ,
, , ,
,
Y X ,Y Y 0, 0
m m
E X X
Var X X
Cov X X
Y Y Y X X X
i n
L q X q X R
q 1
0 1
1
2 1
' *
m
* m '
m m m m*
m m
m m
j m m jm
i i im i i im
i m i i im im im
im yim
1
1
1
1 2 1 2
1 1 1
f f
f f
f f
f
f
2
;
;
;
;
= b +f =
f f
f f t
z b b
=
=
=
=
=
=
= -
^ h
6 6
6 6
@
@
@
@
1if otherwise,
, ,
, ,
, ,
, ,
, , , , ,
, ,
, , ,
,
Y X ,Y Y 0, 0
m m
E X X
Var X X
Cov X X
Y Y Y X X X
i n
L q X q X R
q
R q q 1
0 1
1
2 1
' *
* m
* m '
m m m m*
m m
m m
j m m jm
i i im i i im
i m i i im im im
im yim
jm ij im jm
1
1
1
1 2 1 2
1 1 1
f f
f f
f f
f
f
2
;
;
;
;
= b +f =
f f
f f t
z b b
t
=
=
=
=
=
=
= -
=
^ h
6 6
6 6
@
@
@
@
Table 1: Sample size selection proportional to population size.
No Kebeles Total number of
coffee producers Number of sample households
1 Mine Gora 782 47
2 Jinga Sokoru 305 18
3 Tibi Sebata 932 55
4 Ungule Hara 569 34
Total 2,588 154
Source: Gololcha District Office of Agricultural and Natural Resource, 2019.
of land allocated under coffee (Engida, 2017). According to Diro et al. (2017), the size of land allocated for coffee produc- tion has positive and significant impact on choice of farmers for consumers. The implication was that those farmers who have large total amounts of coffee land harvest more yield and supply products to fair and efficient markets. Medeksa (2014) also reported that the size of land allocated for coffee production has a positive and significant impact on choice of farmers for cooperatives. Similarly, Asefa et al. (2016) identified that the total coffee land of the household has a positive and significant effect on the preference of farmers for formal markets and brokers, and has a negative and sig- nificant effect on the preference farmers for cooperatives as compared to informal market. Hence, land allocated to cof- fee production was hypothesised to influence the likelihood of choosing cooperatives and wholesalers positively and of commission men negatively.
Quantity Produced (QUANP): An increase in the quan- tity of production has a significant effect on market supply and motivates farmers to increase the supply of a commodity to the market. According to Negeri (2017), if the quantity of coffee to be sold is low, farmers are not forced to search for price and market information. However, if the quantity to be sold is high, they search for a market outlet, which buys with the most effective price. Hence, it was hypothesised to influence likelihood of choosing cooperatives and wholesal- ers positively and of commission men negatively.
Farming Experience (FARMEX): This is a continuous variable, measured in terms of the number of years of expe- rience the households had in coffee farming at the time of interview. Farmers with longer production experience are expected to be more knowledgeable and have good weather forecasting ability, this improves the productivity and quan- tity of output sold. Efa and Tura (2018) reported that farm- ing experience has both positively and negatively affected tomato farmers’ choices of wholesaler and consumer mar- ket outlets, respectively. The study by Asefa et al. (2016) indicated that the farming experience of the household had a positive and significant effect on the preference of the farmer for formal markets and brokers as compared to informal mar- kets. Hence, it was hypothesised to influence the likelihood of choosing cooperatives and wholesalers positively and of commission men negatively.
Distance to the nearest market (DMRKT): This is a con- tinuous variable, measured in km from the nearest market the household used to sell their coffee produce. The farther away a household is from the market, the more difficult and costly it would be to get involved. Usman (2016) reported that distance from the closest market place positively and significantly affected accessing millers/processors market outlets as compared with accessing assembler market outlets of wheat. It also affected the wholesaler market outlet nega- tively and significantly. Hence, distance from the nearest market was hypothesised to affect the likelihood of choosing cooperatives and wholesalers negatively and of commission men positively.
Frequency of Extension contact (FEXCONT): It is a continuous variable, measured in terms of number of vis- its per year made by the extension service to the sampled households. Extension service helps in making information
available regarding technology, which improves production.
Negeri (2017) reported that access to extension services negatively and significantly affected the choice of end con- sumer outlet of coffee producers. According to Asefa et al.
(2016), the frequency of an extension contact has a negative and significant effect on formal markets and brokers and a positive and significant effect on cooperatives as compared to their informal counterparts. Hence, it was hypothesised to affect the amount of coffee sold positively, and thelikelihood of choosing cooperatives positively, wholesalers either posi- tively or negatively, and commission men negatively.
Ownership of market transport facilities (TROWR): This is a dummy variable and takes the value of 1 if the household owns transportation facilities and zero otherwise. Ownership of transport facilities plays a vital role in lowering trans- portation costs, as well as enabling farmers to go to distant markets,choose more than one market to sell their produce, and achieve a higher price. Abera (2017) found that number of equines owned was found to have a positive and signifi- cant influence on the probability of haricot bean producer farmers deciding to choose direct consumers and urban trad- ers outlets and a negative and significant influence as regards rural assemblers’ outlets. Hence, it was hypothesised to affect the likelihood of choosing wholesalers positively and of commission men negatively.
Cooperative Membership (COMSHIP): This is a dummy variable that takes a value of 1 if a household head is a mem- ber of agricultural cooperatives and 0 otherwise. Member- ship of a cooperative can also contribute towards reduced transaction costs and strengthen farmers’ bargaining power through networking and the provision of up-to-date informa- tion to members. Being a member of a cooperative increases the likelihood of a farmer choosing an urban trader’s out- let (Abera, 2017). Therefore, cooperative membership was hypothesised to affect the market likelihood of choosing cooperatives positively, and of wholesaler and commission men negatively.
Non/off-farm income (NONFRM): This is a continuous variable, measured in monetary value (ETB), and showing the amount of income obtained from non/off-farm activities undertaken by the household heads. The availability of off/
non-farm income has a negative and significant relationship with the likelihood of choosing a private trader outlet and positive and significant relation with the likelihood of choos- ing a consumer market outlet of coffee producers (Engida, 2017). Hence, it was hypothesised that non/off-farm income was expected to influence the likelihood of choosing coop- eratives and wholesalers positively and of commission men negatively.
Access to market information (INFO): This is a dummy variable that takes a value of 1 if a household head has access to market information and 0 otherwise. According to Abab- ulgu (2016) access to coffee market information affects the choice of collector outlet negatively and significantly. Hence, it was hypothesised that access to information influences the likelihood of choosing cooperatives and wholesalers posi- tively, and of commission men negatively.
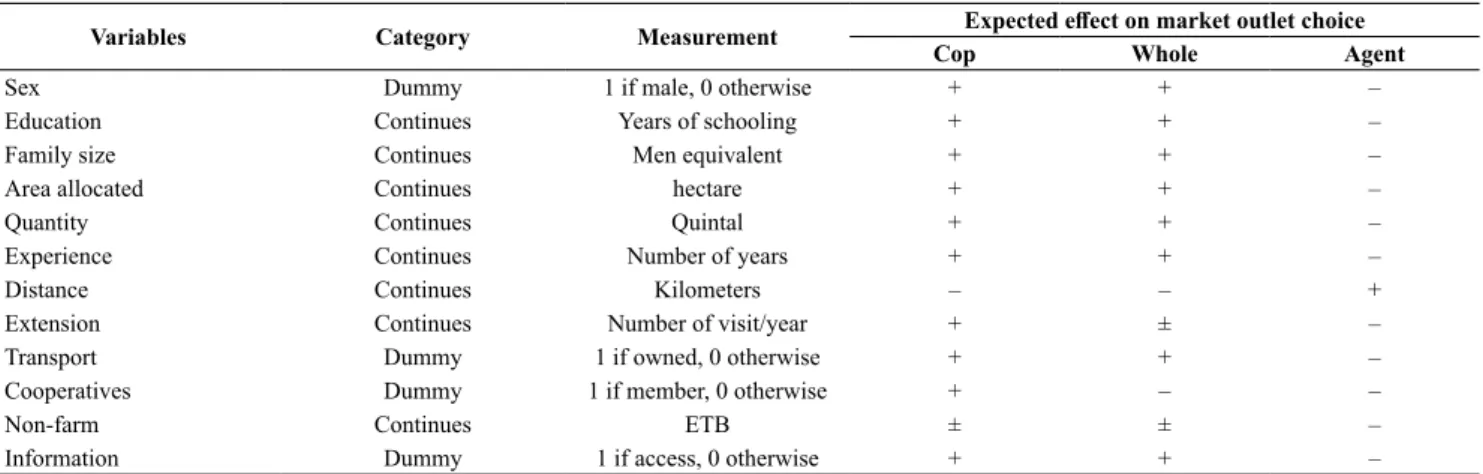
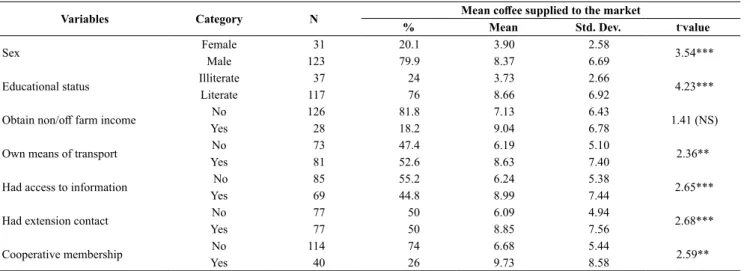
Table 2 summarises the most important characteristics of the variables used.
Results and Discussion
Socio-economic characteristics of sample respondent for categorical variables
From the total households interviewed, 20.1% were female-headed households and 79.9% were male-headed households. Education is instrumental to attaining develop- mental goals through the application of science, technology and innovations. Consequently, the educational status of coffee producers in the study area was assessed and it was found that the maximum years of education completed were 12 grades with the mean of 5.15 and standard deviation 3.72.
According to CSA (2017), nearly half of women (48%) and 28% of men aged 15 up to 49 in Ethiopia have no educa- tion. The illiteracy rate for male and female households in the study area was 15.45% and 58.06%, respectively. This implies that the illiteracy rate of coffee producers was below the national average for male households on the one hand, and was above the national average for female household heads on the other hand.
Table 3 indicates that 81.85% of the respondents had no access to off/non-farm income and only 18.2% had access to non/off-farm income. Their major sources of non/off-farm income were shopping, fattening, selling of food and oth- ers which accounted for 31.1%, 21.1%, 21.1% and 26.7%, respectively. The mean value of non/off-farm income received per year was 2802.60 birr with the high standard deviation of 8568.01 and ranges to 60,000 birr. The highest value of non/off-farm was obtained from fattening. Means of transport ownership is also critical in transporting coffee cherries and searching for better place and price. Accord- ingly, 52.6% of the farmers were transporting coffee to the nearby market using their own donkey. Means of transport- ing coffee for those who had no donkey were a hired donkey (67.12%), human labour, own or hired (24.66%) and hired vehicles (8.22%).
Another crucial factor made available by institutional services is market information. It is especially important for market-oriented crops, such as coffee. Table 3 indicates that around 44.8% of the respondents had access to market
information while the rest had no access to information. Their major sources of market information were friends (19.7%), traders (18.2%), own assessment (16.7%), radio (13.6%), own assessment and traders (12.1%), own assessment and friends (9.1%). Access to extension services also plays an important role in boosting coffee production and productivity. Half of the respondents had contact with an extension agent. Their contact organisations (body) were developmental agents (62.7%), developmental agents, the district agricultural and natural resource office (201.9%), and the district agricultural and natural resource office (16.7%). Their time of making contact was harvesting time, during land preparation, during seeding and the application of fertilisers, and during planting.
The mean frequency of contacting extension agents per year for coffee producers was 1.52 times with the maximum being 12 times and the standard deviation being 2.11.
Primary cooperatives enable farmers to pool coffee prod- ucts together and sell at a better price. However, Table 3 reveals that only 26% of coffee producers were members of multi-purpose cooperatives. The reasons for being a mem- ber were to obtain oil and sugar, the fact that a cooperative provided better price than traders and the perception that the weighting of coffee was fairer with a cooperative than with traders. The reasons for not joining a primary cooperative in the study area were corruption on the part of committee members in respect of benefit sharing, cooperatives being located far from their home and there being no perceived benefit.
Socio-economic characteristics of sample respondent for continuous variables
The other variables used to describe demographic char- acteristics of sampled farmers were age, family size and farming experience. Accordingly, the age of the respondents ranges from 16 to 75 with a mean of 38.96 and a standard deviation of 11.49. The mean family size was 3.7 persons with a standard deviation of 2.17 and results ranging from 1 to 12 persons. According to CSA (2017), the average house- hold size in Ethiopia was 4.6 members. This implies that the average family size of coffee producers in the study area was below the national average.
Table 2: Summary of variables definition, measurement and hypothesis for coffee market supply.
Variables Category Measurement Expected effect on market outlet choice
Cop Whole Agent
Sex Dummy 1 if male, 0 otherwise + + –
Education Continues Years of schooling + + –
Family size Continues Men equivalent + + –
Area allocated Continues hectare + + –
Quantity Continues Quintal + + –
Experience Continues Number of years + + –
Distance Continues Kilometers – – +
Extension Continues Number of visit/year + ± –
Transport Dummy 1 if owned, 0 otherwise + + –
Cooperatives Dummy 1 if member, 0 otherwise + – –
Non-farm Continues ETB ± ± –
Information Dummy 1 if access, 0 otherwise + + –
Note: “Cop”, “Whole” and “Agent” refers to Cooperatives, Wholesalers and commission men, respectively.
Source: own composition
Availability of land is one of the most important factors that influence crop production. The mean amount of land holding in the study area was 0.98 hectares. According to CSA (2014), the average land holding in Ethiopia was 1.14 hectares. Hence, the average land holding of coffee pro- ducers was below the national average. From the total land owned, around 59.18% was allocated to coffee production.
Distance to the nearest market was also estimated by the respondent in km and the result indicated that on average,
one household sold coffee by travelling 5.57 km with the minimum and maximum distances travelled being 0.5 km and 16 km, respectively.
Major outlet existed for coffee producers in the study area
Farmers are not permitted to sell coffee outside of the district. But, within the district, they can sell their coffee to Table 3: Socio-economic characteristics of sample respondents for categorical variables.
Variables Category N Mean coffee supplied to the market
% Mean Std. Dev. t-value
Sex FemaleMale 12331 20.179.9 3.908.37 2.586.69 3.54***
Educational status Illiterate 37 24 3.73 2.66
4.23***
Literate 117 76 8.66 6.92
Obtain non/off farm income No 126 81.8 7.13 6.43 1.41 (NS)
Yes 28 18.2 9.04 6.78
Own means of transport YesNo 7381 47.452.6 6.198.63 5.107.40 2.36**
Had access to information No 85 55.2 6.24 5.38
2.65***
Yes 69 44.8 8.99 7.44
Had extension contact No 77 50 6.09 4.94 2.68***
Yes 77 50 8.85 7.56
Cooperative membership YesNo 11440 7426 6.689.73 5.448.58 2.59**
Note: *** and ** indicate significance level at 1% and 5% respectively. NS stands for not-significant.
Source: own survey results
Table 4: Socio-economic characteristics of sample respondents for continuous variable.
Variables Observations Mean Std. Dev. Min Max
Age of the respondent 154 38.96 11.49 16 75
Family size 154 3.70 2.17 1 12
Farming experience of the respondent 154 16.58 9.71 2 45
Total land owned in hectare 154 0.98 0.49 0.13 2
Total land allocated to coffee (Coffea arabica) in hectare 154 0.58 0.27 0.13 1
Quantity of coffee produced (with husk) 154 9.03 6.85 1 41
Distance to the nearest market (km) 154 3.93 5.57 0.500 16
Source: own survey results
Brokers Cooperatives Wholesalers 279.65
22%
197.00
16% 784,15
62%
Figure 3: Number of channels available and their purchasing capacity per one production year.
Note: Amount of coffee sold in quintals (with dry husk).
Source: own survey results.minants of Market Outlet Choice
wholesalers, cooperatives and agent middle-men. The major receivers of coffee from farmers were wholesalers (784.15 quintals), agent middle-men (279.65 quintals) and coopera- tives (197 quintals).
Determinants of Market Outlet Choice
Coffee producers in the study had three major types of market outlets via which to sell their coffee beans. A multi- variate probit model was used to analyze producers’ chan- nel choice. The p-value of Wald χ2 (36) = 114.21, Prob>
χ2= 0.0000*** is significant at 1% significance level and indicated that the coefficients of regressors are jointly sig- nificant. The value of χ2 (3) = 72.11, Prob> χ2 = 0.0000***
implies that the null hypothesis which states the choice of available market channels are independent is rejected and therefore, coffee producers market outlet decisions are interdependent. The correlation matrix showed that the likelihood of choosing agent middle-men and cooperatives is negative and significant at a 5% significance level. Simi- larly, it revealed that the decision of choosing wholesalers and agent middlemen is negatively correlated at a 1% sig- nificance level. Table 5 further reveals that the probability of choosing cooperatives, wholesalers and agent middle- men of coffee producers were 24.6%, 60.6% and 41.5%, respectively. The joint probability of choosing all market outlets was 0.5% and whereas the probability of a failure to
jointly choose was 2.7%. As can be seen in Table 5, out of twelve explanatory variables, one commonly affected the entire outlet choice. The table also shows that three vari- ables significantly affected cooperatives, and that five vari- ables significantly affected wholesalers and agent middle- men.Sex of the household heads (SEXHH): Sex of the house- hold head had positively influenced the likelihood of choos- ing a wholesaler and negatively influenced the choice of agent middle-men at 1% and 5% levels of significance, respectively. Males have more time to sell and also hold large amount of coffee bean to sell, and consequently search for wholesalers even if the market place is far from their home. However, female households were more likely to opt for agent middle-men. Similarly, Diro et al. (2017) dem- onstrated that male farmers have more resources available for transportation and time to sell their coffee product to far away markets.
Educational level (EDHH): The educational level of the household head was significantly and positively related to the choice of cooperatives and wholesalers market chan- nels, and significantly and negatively related to the choice of agent middle-men at 5%, 10% and 5% levels of significance, respectively. This is due to the fact that most of the educated farmers in the study area were members of a cooperative and hence were more likely to sell through that cooperative than through other outlets. Moreover, education enhances the Table 5: Multivariate probit estimation for determinants of coffee producer market outlet choice.
Cooperatives Wholesalers Agent middle-men
Variables Coeff. Std. Er. Coeff. Std. Er. Coeff. Std. Er.
Sex of household heads -0.566 0.514 1.487*** 0.378 -0.706** 0.323
Educational level 0.140** 0.063 0.074* 0.042 -0.101** 0.040
Farming experience -0.026 0.019 -0.009 0.015 0.005 0.013
Land allocated -0.017 0.182 0.049 0.139 0.031 0.128
Access to non-farm 0.121 0.434 0.009 0.327 -0.288 0.304
Means of transport -0.255 0.364 0.628** 0.266 -0.484** 0.241
Frequency of extension 0.105* 0.062 0.104 0.065 -0.097* 0.057
Access to information -0.371 0.333 0.674*** 0.247 -0.506** 0.231
Cooperative membership 2.685*** 0.401 -0.418 0.300 -0.107 0.287
Distance to market 0.055 0.040 -0.069** 0.034 0.011 0.032
Output level -0.014 0.024 0.019 0.025 0.004 0.021
Family size 0.092 0.079 0.015 0.062 -0.003 0.059
Constant -2.026*** 0.772 -1.753*** 0.582 1.303** 0.520
Multivariate probit (MSL, # draws) 100
Number of observations 154
Log likelihood -155.320
Wald χ2 (36) 114.210
Prob> χ2 0.0000***
Predicted probability 0.246 0.606 0.415
Joint probability of success 0.005
Joint probability of failure 0.027
Correlation matrix ρ1(Y1) ρ2(Y2) ρ3(Y3)
ρ1(Y1) 1
ρ2(Y2) 0.025 1
ρ3(Y3) -0.224** -0.756*** 1
Likelihood ratio test of ρ2ρ 1= ρ3ρ1 = ρ3 ρ2 = 0 χ2(3) = 72.11 Prob > χ2 = 0.0000***
Note: ***, ** and * indicated significance level at 1%, 5% and 10%, respectively. Y1, Y2 and Y3 are Cooperatives, Wholesalers and Commission-men, respectively.
Source: own survey results
capability of farmers when making decisions with regard to the choice of market outlet based on the marketing margin and marketing cost. This finding is consistent with Medeksa (2014) who reported that educational level provides positive predictive power, whether or not the household chooses a cooperative as the market outlet for their coffee.
Means of transport ownership (TROWR): The result indi- cated that ownership of a donkey positively and significantly affected the choice of wholesaler channel and negatively influenced the choice of agent middle-men market channel at 5% level of significance. This is due to the fact that in the study area, the means of transporting coffee to the mar- ket was through donkey and those who owned it were more likely to sell it at the village and district market to wholesal- ers at a better price. The finding is in line with Addisu (2018) who reported that having equines positively correlates to the likelihood of choosing wholesalers outlet.
Access to market information (INFO): A positive relation- ship was found to exist between access to price information and choice of wholesalers’ market outlet at a 1% significance level, and a negative relationship was found to exist between access to price information and agent middle-men market outlet at a 5% significance level. The rationale behind this could be that access to market information might encourage farmers to sell to a better market and thereby increase their profit. The result of the study is in line with Ababulgu (2016) who demonstrated that access to coffee market information affected the choice of collector outlet negatively and signifi- cantly. Diro et al. (2017) meanwhile observed that farmers who had no information preferred brokers over urban trad- ers.Cooperatives membership (COMSHIP): This signifi- cantly and positively affected cooperatives’ channel choice at a 1% significant level. The reason is that members are required to supply their coffee as the norm of cooperatives.
Additionally, cooperatives provide input and training to their members and provide a share dividend at the end of each year. The finding is consistent with Engida (2017) who showed that cooperative membership has a significant and positive relationship with the likelihood of choosing a coop- erative to sell to.
Frequency of extension contact (FEXCONT): This affected choice of cooperatives positively and choice of mid- dlemen negatively at a 10% level of significance. This might imply that extension agents advise farmers to sell their coffee to cooperatives rather than brokers. The finding of the study is in line with Asefa et al. (2016) who found that frequency of extension contact had a negative and significant effect on choice of brokers and positive and significant effect on coop- eratives.
Distance to the nearest market (DMRKT): This result indicated that distance to the nearest market negatively and significantly affected the choice of a wholesaler channel at a 5% level of significance. The reason for this was that whole- salers were purchasing coffee at village and district markets and consequently, those farmers who were far from the mar- ket were less likely to sell to them. The finding is consistent with Usman (2016) who reported that distance from the clos-
est market negatively and significantly affected wholesaler market outlets.
Conclusions and Recommendations
Coffee producers in the study area have different levels of access and ranges of options to select from among the exist- ing market channels. Nevertheless, to choose the best suit- able channels, farmers should take account of the limitations and act wisely to sell coffee through appropriate and feasible channels. The study therefore aimed to identify the determi- nants of coffee producer market outlet choice in the study area. To address the objectives of the study, both quantita- tive and qualitative data were used. The data were generated from both primary and secondary sources. The primary data were collected in 2019 through personal interviews (face- to-face) from a total of 154 producers using structured and semi-structured questionnaires.
The study has been conducted in one district and impor- tant information was collected from sample households in the study area. However, there were spatial as well as tem- poral limitations to make the study more representative in terms of both a wider range of area coverage and time hori- zon. Furthermore, since Ethiopia has wide range of diverse agro-ecologies, institutional capacities, organisations and environmental conditions, the result of the study might limit possible generalisations applicable to the country as a whole.
A multivariate probit model was used to analyse produc- ers’ channel choice because coffee producers’ market outlet decisions were found to be interdependent. The results from the multi-variate probit model showed that the sex of the household head, their level of education, their means of trans- port ownership and access to information all positively influ- enced choice of wholesaler and negatively influenced choice of agent middle-men. Level of education was significantly and negatively related to the choice of agent middle-men, and significantly and positively influenced cooperatives’
and wholesalers’ choice of channel. Frequency of extension contact affected choice of cooperatives positively and choice of middlemen negatively, and distance to the nearest market negatively and significantly affected choice of a wholesaler channel.
To conclude, the study shows that enhancing institutional and infrastructural (transportation and extension) facilities is necessary to enable coffee producers to select efficient market channels. In addition, it is recommended that steps be taken to establish and support multi-purpose coffee farm- ers’ cooperatives and grow their membership,as this should increase farmers’ income through marketing activities and supply of important inputs.
Acknowledgements
We are grateful to Oromia Agricultural Research Institute (OARI) and Mechara Agricultural Research Center for their logistic support.