Heterogeneity in Stock Market Expectations and Portfolio Choice of American Households
MTA DOKTORI ÉRTEKEZÉS
Kézdi Gábor
February 13, 2013
Contents
1 Introduction 3
1.1 Motivation . . . 3
1.2 Structure of the dissertation . . . 10
1.3 Methods . . . 10
1.4 Preview of the results . . . 17
2 Heterogeneity in expectations about future stock returns, learning incen- tives and portfolio choice 21 2.1 Introduction . . . 22
2.2 Characterizing stock market beliefs . . . 24
2.3 Heterogeneity in beliefs and learning . . . 27
2.4 Data . . . 28
2.5 Descriptive analysis . . . 31
2.6 Structural analysis . . . 36
2.7 Conclusions . . . 44
3 Financial knowledge, personality and expectations about future stock re- turns 46 3.1 Introduction and theoretical motivation . . . 46
3.2 Data . . . 50
3.3 Methods . . . 61
3.4 Results on …nancial knowledge . . . 64
3.5 Results on Big Five personality traits . . . 71
3.6 Results on optimism . . . 76
3.7 Conclusions . . . 80
4 Stock market crash and expectations of American households 83 4.1 Introduction . . . 83
4.2 Data . . . 87
4.3 Descriptive analysis . . . 91
4.4 Structural estimation . . . 97
4.5 Results of the structural model . . . 100
4.6 Conclusions . . . 109
5 Concluding remarks 110
A Appendix to Chapter 2 112
A.1 Details of the theoretical model . . . 112
A.2 Data, descriptive statistics and detailed evidence on noise and information in the probability answers . . . 121
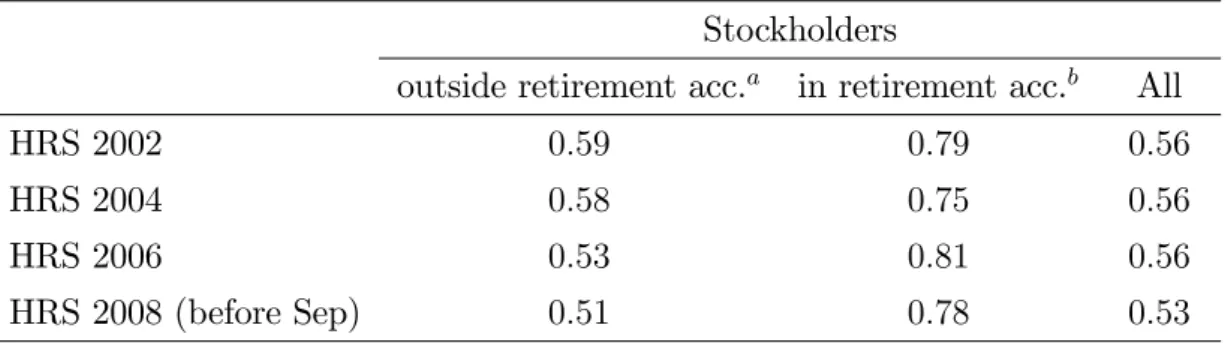
A.2.1 Sample and stockholding . . . 121
A.2.2 The proxy variable for lifetime earnings . . . 124
A.2.3 Noise in the probability answers . . . 129
A.2.4 Relevant heterogeneity in the probability answers . . . 136
A.3 Details of the structural econometric model . . . 141
A.3.1 The likelihood function . . . 141
A.3.2 Expected ~ and conditional on the probability answers . . . 143
A.3.3 Estimating the variance and correlation of survey noise . . . 144
A.4 Detailed estimation results from the structural econometric model . . . 149
A.4.1 Detailed estimates from the benchmark model . . . 149
A.4.2 Results for …nancial respondents . . . 151
A.4.3 Results with freely estimated 2-point distributions for ~ . . . 153
A.4.4 Results with including all the belief-speci…c right hand-side variables (z) in all models with the other covariates (x) . . . 155
B Appendix to Chapter 3 158 B.1 Descriptive statistics . . . 158
B.2 Detailed estimates of the structural models with 2 probability answers . . . . 163
B.3 Detailed estimates of the structural models using all three probability answers 168 C Appendix to Chapter 4 176 C.1 Detailed estimates from the models with interactions . . . 176
C.2 Estimates based on alternative functional form assumptions . . . 179
1 Introduction
1.1 Motivation
Decisions under uncertainty are shaped by the decision makers’preferences, the constraints they face, and their beliefs about the future. The conceptual separation of beliefs from preferences is perhaps one of the most important assumptions behind the economic theories of decision under uncertainty. The separation of beliefs from preferences is complete in expected utility theory with subjective probabilities. However, most nonexpected and non- Bayesian utility theories also separate the two, at least at a conceptual level (see, for example, Machina, 2002, for a review of nonexpected utility theory and Gilboa, 2010, for a critical review of decision theory).
Economic analyses typically focus on the e¤ects of constraints on decisions. Constraints are considered more likely to be a¤ected by policy decisions, while individual preferences are thought to be una¤ected by policy decisions. Whether and how beliefs can be a¤ected by policy decisions is typically not addressed in economics. An important exception is the role of in‡ation expectations in the Lucas critique of policies exploiting the Phillips curve (Lucas, 1976). One interpretation of the critique is that policies cannot fool people, and except for some descriptive research on in‡ation expectations and their relationship to central banks’
credibility, most economists continued to assume away the impact of policies on beliefs.
However, beliefs may be in‡uenced by policy decisions, either directly or indirectly, more so than preferences. In any case, assumptions about the stability of, or e¤ects of policies on, beliefs or preferences are empirical questions and are di¢ cult to assess without adequate measurement.
However, measuring preferences and beliefs at the same time is di¢ cult by observing actions only. Revealed preference theory (see, for example, Richter, 2008, for a review) is applicable to decisions under uncertainty only if one fully speci…es the individual beliefs about the future. For example, in rational expectations equilibrium, people are assumed to make decisions based on beliefs about the probability distribution of future states of the world that will prove to be correct in the sense that people’s subjective beliefs will in turn characterize the actual probability distribution of future states. Unfortunately, assumptions about people’s beliefs are di¢ cult to test by observing actions only, unless one is willing to assign fully speci…ed preferences to the decision makers.
Therefore, it appears obvious that these questions prescribe and agenda for empirical research. We should learn about people’s preferences and beliefs in many decision situations that are important for economic theory or policy.
There is a growing literature on uncovering preferences and on establishing relevant het-
erogeneity in these preferences Typically, this type of research examines people’s decisions in experimental situations. The most important general preferences regarding decisions under uncertainty are related to risk and time. (Experiments in non-expected utility frameworks often aim at measuring other preferences such as ambiguity aversion or loss aversion.) In typical experiments that measure risk preferences, decision makers are presented with lotter- ies with fully speci…ed probability distributions and are asked to choose from the available options. In e¤ect, in risk preference experiments, the experimenter induces variation in the probability distribution while keeping preferences constant (because the probabilities vary for the same people). Assuming that people fully understand and internalize those proba- bilities, their choices can then be used to recover their risk preferences. A similar variation can be induced in terms of the time horizon of outcomes to measure time preferences.
Many such experiments were criticized for analyzing speci…c populations (often under- graduate students) and studying small samples. However, it is of course possible to conduct similar experiments in large representative samples, although such experiments are rather costly. Dohmen, Falk, Hu¤man and Sunde (2010) is an excellent example: they investigate correlations between intelligence ("IQ") on the on hand and risk preference and time prefer- ence the other hand in a sample that is representative of the adult population in Germany.
This research …nds that there is substantial heterogeneity in risk aversion, and that, on average, risk aversion is moderate.
Typical experiments involve outcomes with real money at stake. Therefore, these exper- iments are "incentivized," which means that people’s decisions have consequences for them in terms of real money. For obvious reasons, however, the amount of money at stake in these experiments is usually small compared to the money at stake in the most important real-life decisions that concern economists.
An alternative method for eliciting preferences presents respondents with hypothetical gambles, again with fully speci…ed probability distributions - and then asks respondents to make hypothetical decisions. The seminal paper measures risk preferences: Barsky, Juster, Kimball and Shapiro (1997) ask people to choose between hypothetical jobs that would result in di¤erent risks in terms of lifetime earnings and then recover the parameter of risk tolerance assuming constant relative risk aversion utility. Importantly, these types of hypothetical gamble questions allow for recovering "cardinal" (numerical) measures of risk preferences with some additional assumptions, while the more widely used simpler survey questions (how would you rate your risk tolerance?) allow for ordinal measures (ranking) only. A series of follow-up papers examined the stability of measured preferences, the e¤ect of question wording and the role of measurement error (Sahm, 2007; Kimball, Sahm and Shapiro, 2008). They …nd substantial heterogeneity in risk aversion and that risk preferences
are stable over time. As an important methodological contribution, they also …nd that there is substantial error in the survey measures, and they develop a method to address that error appropriately. They also …nd that most people are likely signi…cantly more risk averse in these hypothetical situations than has been previously expected and observed in incentivized experiments, which is an important puzzle.
A widely aired criticism of the hypothetical gambles approach is that people may not make thoughtful decisions if they do not have the right incentives to do so. Consequently, the preference measures from this approach, and the heterogeneity therein, may have little to do with "real" preferences that are relevant in real-life situations. The evidence in this respect is mixed. On the more a¢ rmative side, Dohmen, Falk, Hu¤man and Sunde (2010)
…nd that an ordinal measure of risk preference from simple survey questions is strongly correlated with risk preference measures derived from decisions in an incentivized experiment.
At the same time, Anderson and Mellor (2009) …nd that risk preference measures derived from hypothetical gambles of this type are often very weakly, if at all, correlated with risk preference measures derived from decisions in incentivized experiments. The authors also …nd that the situation described in hypothetical gambles matters with regard to the hypothetical decisions people make, and the strength of the correlation of the risk measures derived from those answers to the experimental measures vary with the described situation.
Unfortunately, investigations of this type fall short of truly informative validations precisely because the large stakes involved in the most informative hypothetical gambles are impossible to implement in incentivized experiments.
Another concern with the hypothetical gamble approach is the cognitive di¢ culty of un- derstanding hypothetical situations. It usually takes many complicated sentences to describe these situations, with many important details. Respondents are also asked to make quick decisions in situations that they most likely have never experienced. If the respondents were to experience such situations, their decisions would most likely take a lot of time, and they may consult other people, none of which is available in a survey situation. Note, however, that the cognitive di¢ culty also appears to be a problem in incentivized experiments: Dave, Eckel, Johnson and Rojas (2010) show that di¤erent wording can lead to di¤erent decisions among people with lower numerical skills, even in an incentivized experiment.
Therefore, it appears that the approach to measure preferences has made substantial progress but still has its problems.
A complementary approach aims at measuring beliefs. Here the experimental approach is not feasible: while it is possible, at least in principle, to place decision makers in situations with fully speci…ed probabilities and then vary those probabilities to observe how decisions change, giving people preferences and varying those preferences is obviously impossible. This
problem leaves researchers with one possibility if they want to measure beliefs: to ask decision makers directly about their beliefs.
A direct measurement of beliefs has potential problems that are similar to the hypo- thetical gambles approach to elicit preferences. In a typical survey situation, there is little time to answer the questions, and, beyond a spirit of cooperation, there are no incentives to get the answers right. Furthermore, there is an additional issue: asking about beliefs requires questions that people understand but that provide answers that are also useful in characterizing people’s beliefs in a theoretically satisfactory way.
Manski (2004) argues that researchers should ask probabilities from decision makers if they are interested recovering decision makers’beliefs. If people have well-de…ned probabil- ities in their minds, asking for those probabilities is certainly the right approach. If people think about uncertainty in other ways, asking for probabilities may be more problematic.
However, answers to probability questions may be informative even in that latter case.
We know little about how people actually think about uncertainty when they make economically relevant decisions. Furthermore, even if we knew more about this phenomenon, whether people can represent that uncertainty in probabilities when asked about it would be a di¤erent question. It is possible that, if necessary, not fully conscious accounts of uncertainty can be translated into probabilities even if decision makers do not make that transformation explicit in their thought processes when making decisions. In fact, the possibility of this transformation is the assumption of subjective probability theory. Of course, it is also possible that uncertainty is represented in ways that are impossible to translate into well- de…ned probabilities.
We know that people often make statements about uncertainty that do not conform with the laws of probability. Moreover, people often or make choices that do not satisfy the assumptions of subjective probability theory (see, for example, Ellsberg, 1961 or Tversky and Kahneman, 1974). This …nding may imply that the expected utility theory and the subjective probability theory completely misrepresent the way people make decisions. Undoubtedly, failures in speci…c situations undermine the general nature of the theory. However, such failures do not necessarily undermine the theory’s usefulness in certain situations: those theories may be su¢ cient descriptions of the way decisions are made in some situations but not all situations. For example, the fundamental thought processes may be signi…cantly di¤erent from what expected utility theory would suggest in the sense that people do not calculate probabilities of future states of the world, attach utilities to each state, and/or multiply those probabilities with characteristics of states of the world and then add up those products. Instead, people may rely on heuristics and fast-and-frugal decision algorithms (see, for example, Gigerenzer, 2008). The expected utility theory with subjective probabilities may
still be a good approximation to those decision rules in situations but not necessarily in all situations.
Whether probabilities are the way people actually think about uncertainty and the extent to which people’s decision-making process can be appropriately approximated by expected utility theory, are very relevant questions that need further investigation. Unless the answer to those questions is very negative, asking probabilities from people about appears to be a sensible approach to making them characterize the uncertainty they face. There is a small but growing literature that makes use of people’s answers to questions on probabilities of future events.
Research on expectations measured in probabilistic forms is made possible by the fact that some major surveys have begun to include questions on probabilities of future events.
A pioneer in this approach is the Health and Retirement Study (HRS). The HRS is a large biannual panel household survey, representative of the American population 51 years of age or older and their households (see Juster and Suzman, 1995 and NIA, 2007, for reviews).
The HRS has included several probability questions since its start in 1992. The inclusion of probability questions was initiated by the late Thomas Juster, the …rst principle investigator of the HRS - and a long-time advocate of eliciting beliefs by probability questions (see, for example, Juster, 1966).
The HRS includes questions on the probability of events such as living to certain age;
working past a certain age; losing a job (if working) or …nding a job (if unemployed); receiving an inheritance; and leaving an inheritance. Since 2002, the HRS has included one or more questions on the probability that the stock market would go up (or down) by some threshold values.
The example of the HRS itself led to similar surveys ("sister studies") around the world, including in Great Britain, Mexico and Japan. The Survey of Health, Ageing and Retirement in Europe (SHARE), a harmonized survey …elded in 19 European countries (and Israel), also closely follows the example of the HRS.1 The success of the HRS and the spread of HRS- type surveys are in part due to the fact that population aging is one of the most important structural challenges of the developed world, and studying aging requires panel data with information in many domains. Another component of the HRS success is its organizational structure, which was closely followed by its sister studies. The HRS is governed by re- searchers as opposed to professional data collection agencies. Consequently, the content of the questionnaire is closely related to important research questions. Similarly to the HRS, its sister surveys also include questions on expectations, typically in the form of probabil- ity questions (although stock market expectations are typically not included in those other
1Hungary joined SHARE in 2011 in its 4thwave.
surveys).
Hurd (2009) provides an overview of the …rst years of empirical research on expectations as measured by survey questions on probabilities. The conclusions of his overview are cautiously optimistic. It appears that there is substantial heterogeneity in people’s expectations. It also appears that probabilistic measures of expectations …elded on surveys can capture a substantial part of that heterogeneity. Moreover, it appears that people’s answers to these probability questions, on average, can be rationalized relatively easily in many important domains.2
However, these measures have their own problems. Quite naturally, the lack of incentives may be problematic because respondents may not put in the required e¤ort and thus may not give well-grounded answers to these types of survey questions, a problem similar to questions on hypothetical gambles. Note that whether and how one could incentivize the elicitation of beliefs is a very di¢ cult question that has not been addressed in the literature.
People’s ability to think in terms of probabilities may make these questions even more di¢ cult to understand. One concern is the overall validity of expectation measures from such questions; another concern is the potential relationship between answer quality and respondents’cognitive capacity. This second concern is especially severe because an apparent correlation of expectation measures with real-life decisions may simply stem from, on the one hand, a correlation of those decisions with cognitive capacity, and on the other hand, the correlation of cognitive capacities with the quality of the probability answers, instead of from a genuine correlation between decisions and expectations.
Expectations, or beliefs about the future, are the subject of this dissertation.3 I inves- tigate ordinary individuals’ expectations about returns attainable on the stock market. I focus on American Households because of data availability. The research I report on in this dissertation takes the measurement issues seriously. In fact, some of my research is in the forefront at addressing those concerns.
Stock market expectations are important for many reasons. These expectations should be relevant for the prices of stocks and other assets, the volume of transactions and other aggregate measures of asset markets. Di¤erences between people regarding their stock market
2Important exceptions are massive overstatement of probabilities of rare negatve events such as natural disasters or terrorist attacks (Christelis and Georgarakos, 2010), or teen-agers almost absurd overestimation of the risks of major accidents or a premature death (Fischo¤, 2008). Whether and how stock market expectations can be rationalized is a more complex question and a subject of this dissertation.
3I use "expectations" in a broad sense to denote beliefs about the future (as opposed to a more nar- row use for "expected value"). Throughout the dissertation, I use the words "beliefs" and "expectations"
interchangably.
expectations may be relevant for di¤erences in portfolio choice behavior and, in turn, wealth accumulation. Furthermore, the existence of di¤erences in stock market expectations is an important question in itself, from a theoretical perspective. Stock market expectations are expectations about market prices, with little room for private information. It is not obvious that individuals should exhibit substantial di¤erences in stock market expectations; if they do exhibit substantial di¤erences, we should understand the origins of such di¤erences.
The primary focus of my dissertation is on the last question: why do people have di¤erent expectations about future stock market returns? I also address the important follow-up question: if people di¤er in their expectations, does that lead to di¤erences in their portfolio decisions? The answers to these questions are also important for understanding asset prices and wealth di¤erences.
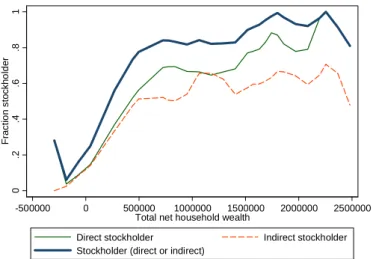
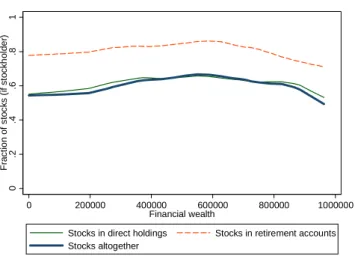
Households’ portfolio decisions determine the structure of assets that households chose to hold for their savings. In the United States, as in many other countries, fewer households hold stocks than standard theory would imply, at least if risk preferences are "sensible" (i.e., if the risk aversion is not extremely high) and beliefs are close to what historical evidence would suggest. This observation is the so-called "stockholding puzzle" (Mankiw and Zeldes, 1991; Haliassos and Bertaut, 1995; Campbell, 2006; Poterba, Rauh, Venti, and Wise, 2006).
The stockholding puzzle is related to the equity premium puzzle, which states that returns on stocks observed in the past 100 years are di¢ cult to reconcile with their historical risks (Mehra and Prescott, 1985; Kocherlakota, 1996; it appears that the recent …nancial crisis did not undo the equity premium puzzle, Damodaran, 2012).
There are three potential theoretical resolutions of the puzzle as well as an empirical resolution. The empirical resolution aims at showing that, for most people, stocks are sig- ni…cantly more risky than what the aggregate exercise by Mehra and Prescott suggests (the paper by Malloy, Moskowitz and Vissing-Jorgensen, 2008, is perhaps the most convincing of those attempts). The three theoretical directions are the following: many people may face very strong constraints that prevent them from investing in stock-market based assets; many people may be much more risk averse than what has formerly been judged as "sensible"; and many people may have beliefs about future stock returns that are characterized by substan- tially lower expected value and/or substantially higher perceived risks than what historical evidence would suggest.
There is an empirical literature on stock market participation that has focused on reduced- form e¤ects of demography, education and wealth (Ameriks and Zeldes, 2000; Guiso, Halias- sos, and Jappelli, 2002), cognitive capacity (Christelis, Jappelli and Padula, 2006), health (Rosen and Wu, 2003), or social interactions (Guiso, Sapienza and Zingales, 2004; Hong, Kubik and Stein, 2004). From a theoretical perspective, it is not always clear whether those
factors should be understood as constraints or as determinants of preferences or beliefs. I think that it is obviously impossible to evaluate the three potential theoretical explanations without sensible measures for preferences and expectations. This dissertation reports on research that shows that a large part of the reduced-form relationships documented by the literature likely operates through expectations.
1.2 Structure of the dissertation
The dissertation consists of three chapters in addition to this introductory chapter and the chapter with concluding remarks. Chapter 2 characterizes the heterogeneity of stock market expectations among American households and aims at explaining that heterogeneity. The results of Chapter 2 suggest that an important part of the heterogeneity is the result of di¤erences in learning histories, which are in turn caused by di¤erences in returns to and costs of learning (as well as in initial conditions).4 Chapter 3 provides additional empirical analysis to support the explanation put forward in Chapter 2, and it looks for other potential sources of heterogeneity in people’s personality traits.5 Chapter 4 examines the e¤ect of the stock market crash of September 2008 on households’expectations.6 The main text is kept relatively short to make it more accessible. Each chapter is complemented with its own appendix, with technical details and additional empirical results.
1.3 Methods
The three chapters ask di¤erent questions and use di¤erent samples of the Health and Re- tirement Study (HRS); however, the chapters are based on the same (or very similar) survey questions and use a common methodology. The measurement problem in each chapter is
4The title of Chapter 2 is "Heterogeneity in expectations about future stock returns, learning incentives and portfolio choice". It is an updated version of a previous paper coauthored with Robert J. Willis.
The title of that previous paper was "Household Stock Market Beliefs and Learning," and the paper was published as NBER Working Paper 17614.http://www.nber.org/papers/w17614.pdf. The paper was featured in VOX, the policy and popular economic-research portal of the Centre for Economic Policy Research at http://www.voxeu.org/article/beliefs-and-stock-market.
5The title of Chapter 3 is "Financial knowledge, personality and expectations about future stock returns".
It is new. Preliminary results from that chapter were presented at the "Formation and revision of subjective expectations" conference, held on November 8-9, 2012 in Québec city, Canada.
6The title of Chapter 4 is "Stock market crash and expectations of American house- holds". It is an edited version of a paper coauthored with Péter Hudomiet and Robert J. Willis. The paper was published in The Journal of Applied Econometrics, 26: 393–415 (2011).http://onlinelibrary.wiley.com/doi/10.1002/jae.1226/abstract
to characterize expectations about stock market returns based on answers to probability questions.
All three chapters assume that people believe that yearly log returns are i.i.d. and normally distributed. The mean of log returns is denoted as and the standard deviation as . For example, = 0:1means that the mean return is approximately ten per cent. At a yearly frequency, the i.i.d. normal assumption for log returns is in line with historical data.
In the period of 1945 to 2012, for example, yearly log nominal returns of the Dow Jones index were characterized by a mean of = 0:06 and a standard deviation of = 0:16. Di¤erent windows can give lower and higher values of , and the value of is remarkably stable.
Under the i.i.d. lognormality assumption, the beliefs of individual i about the stock market returns are fully characterized by her beliefs about the mean and the standard deviation, and we denote those subjective beliefs by ~i and ~i. (Indexirefers to potential heterogeneity in the parameters, and the tilde refers to the subjective nature of the parameters.) We de…ne~i and ~i as the parameters that would characterize individual beliefs in investment situations.
The goal in each paper is to characterize heterogeneity in ~i and ~i , understand the sources of that heterogeneity, and, in Chapter 2, establish its relationship to the heterogeneity in household portfolios.
~i and ~i are unobserved in the data. Instead, the HRS data includes answers to proba- bility questions. In all three chapters we make use of the answers to two question. The …rst question is the same in each dataset: it asks what the respondent thinks is the probability that the market will go up. Answers to this question are denoted as p0: In Chapter 2, the second question (p10) asks about the probability that the market will go up by at least 10 percent. In Chapter 3, the second question(p20) asks about the probability that the market will go up by at least 20 percent. In Chapter 4, the second question (pc) asks about the probability that the market will go up by at leastcper cent or go down by at leastcpercent (c2 f10;20;30;40g):
If answers to two probability questions are available, identifying the mean and standard deviation of log returns from the two probabilities is relatively straightforward under the normality assumption, by making use of the inverse normal c.d.f. Intuitively, higher ~i cor- responds to higher probabilities, while higher ~i pushes the argument of the c.d.f. toward zero thus pushing both probabilities towards 0:5.
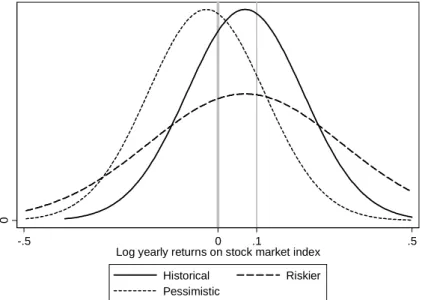
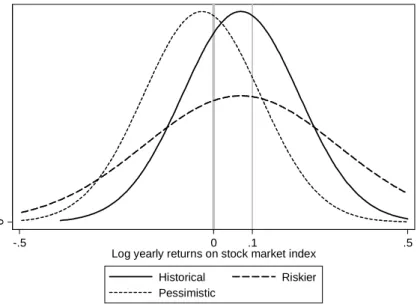
To see the correspondence between the structural parameters (~i and ~i) and the prob- abilities more intuitively, Figure 1.1 shows three probability distribution functions together with vertical lines at the cuto¤ points of 0 and 0.1 log returns that correspond to thep0 and p10 questions. The continuous line shows a p.d.f. with historical moments between 1945 and 2002 ( = 0:07and = 0:15) that is the relevant time period for the analysis in Chapter 2.
The dashed line corresponds to a mean-preserving spread (higher perceived risk), and the dotted line corresponds to a lower mean (more pessimistic beliefs).
0
-.5 0 .1 .5
Log yearly returns on stock market index
Historical Riskier
Pessimistic
Figure 1.1. Examples for probability densities of normally distributed log returns, with the cuto¤ points forp0 and p10
If the probability answers were precise integrals of the relevant density, they would be equal to the area to the right of the corresponding bars at 0 and 0:1 log returns. We can denote those ideal probabilities with starts, such as p0. The series of post-war returns up to 2002 (the year of the data used in Chapter 2) corresponds to p0 = 0:68, p10 = 0:42 and p0 p10 = 0:26. Holding risk constant, more pessimistic beliefs result in smaller values of p0 and p10. Therefore, we can think of the p variables as proxy variables for the perceived level of returns. A mean-preserving spread leads to a smaller area between the two vertical bars, which equals the di¤erencep0 p10. The di¤erence between the two answers may thus serve as a proxy for the inverse of the perceived risks. Analogous transformations could be used for other positive cuto¤ values instead of 10 per cent. These proxies are far from being perfect, though, partly because of the measurement issues (see below) and partly because, for example, a mean-preserving spread can also changep0 (see more details on that in Section 2.2).
The measurement problem means that, instead of the theoretical probabilities that we denoted by p , we are likely to observe something else in the data. There are strong the- oretical reasons to believe that people’s answers to the probability questions are not equal to the p transformations of these parameters. There is little time to answer the questions, and, beyond a spirit of cooperation, there are no incentives to get the answers right. It is
therefore better to consider actual answers as "guesses" for what thep values may be, given recollections of ~i and ~i.
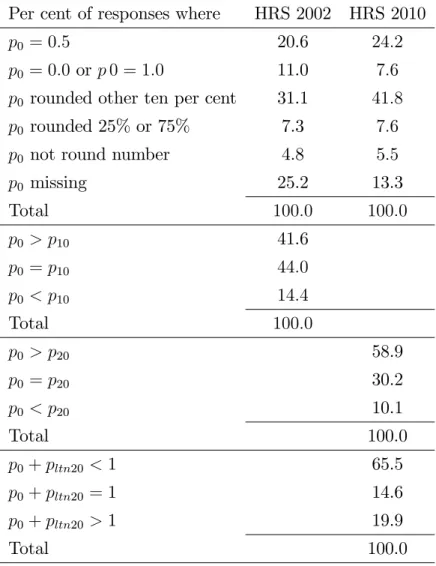
The data shown in Chapters 2 and 3 (and the corresponding appendices) reveal answer patterns that strongly support this view. Almost all answers are rounded to the nearest 10, or to 25 or 75 percent. Focal values at 50 per cent account for an especially large part of all answers. Many respondents give the same answer to p0 and pc (for positive values of c), which, taken at face value, would imply in…nitely large standard deviations of log returns.
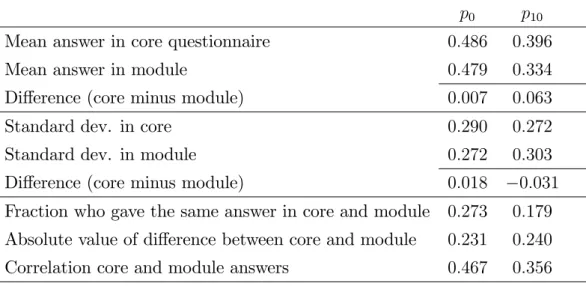
Rounding would allow for …nite (but large) standard deviations to give that pattern. Some respondents give p0 < pc (again, for positive values of c), which does not conform with the laws of probability. It may be that these respondents do not understand probabilities at all. It is also possible that these answers re‡ect inattention to one or both questions. The empirical evidence is in line with the latter interpretation. Fortunately, the data in the 2002 wave of the HRS allows for a direct assessment of survey noise because a small subset of the respondents answered the same probability questions a second time, in an experimental module. When these respondents were asked to answer the same probability questions a second time during the same interview approximately half an hour later, most gave di¤erent answers. Perhaps surprisingly, all three noise features (rounding, apparent violations of the laws of probability and test-retest noise) appear largely random. Some of these answer patterns make computing the p values impossible. All answer patterns indicate that actual answers are noisy transformations of relevant beliefs.
To address those problems, we developed a structural measurement model to estimate the heterogeneity in the relevant belief variables and to handle survey noise. The model relates the latent belief variables(~i;~i)to the observed answers to the probability questions(p0i; pci) for any positive cuto¤ value c (negative cuto¤ values are straightforward to include in the analysis, and section C.2 in Appendix C. shows the details). The model accommodates all of the observed answer patterns and our intuition about how people answer di¢ cult survey questions.
Our estimation strategy is structural in that it focuses on the theoretically relevant para- meters and the relevant heterogeneity in those parameters (net survey noise). In particular, we estimate the moments of the distribution of ~i and ~i in the population and in various subpopulations (analogously to Table 1 above), and we investigate the role of the hetero- geneity of ~i and ~i in the heterogeneity of stockholding. We model the di¤erences between
"theoretical" probabilities (thep variables above) and actual probability answers (thepvari- ables) in two steps. The …rst step introduces survey noise, and the second step introduces rounding.
Noise is modeled as mean-zero additive components to the index ~=~ that enters the
probabilities p0 and pc. The noise components, denoted by v0 and vc, are assumed to be jointly normal and potentially correlated. Letpbr0i andpbrci denote hypothetical "before round- ing" answers so that the observed answersp0iand pci may be rounded versions of the former.
Conditional on the draw of the noise variables, these hypothetical survey answers are then the following:
pbr0i = ~i
~i +v0i (1)
pbrci = ~i c=100
~i +vci (2)
"
v0i vci
#
N 0; 2v
"
1 v
v 1
#!
(3) The noise components are assumed to be independent of any relevant heterogeneity, which is consistent with the randomness of the test-retest error and the near-randomness of the other noise features. The bivariate nature of the noise accommodates answers of p0i < pci if that phenomenon is due to inattention to the survey (which, as noted earlier, is supported by the near-randomness of its prevalence). The correlation coe¢ cient between v0 and vc is related to average inattention. v = 1 would mean that all respondents answer questions p0
andpc with the same noise, which would not allow for answers such asp0i < pci. At the other extreme, v = 0 would mean that all respondents forget their previous answers completely.
The true value of v is likely to be in-between. Luckily we can use the test-retest evidence in HRS 2002 to us identify moments of the noise process( 2v; v):We assume that the noise components in the core and module answers are independent, which is consistent with the evidence that we have.
Answers to the probability questions may di¤er from the hypothetical "before-rounding"
probabilitiespbr due to rounding. We accommodate rounding by an interval response model.
An answer within a pre-speci…ed interval can correspond to any probability pbr within that interval. Round numbers are in the middle of those intervals, which are de…ned in an exogenous fashion and are assumed to be the same for all respondents.
Formally, the vector of survey answers(p0i; pci)is in the quadrantQkl if the vector of the hypothetical probabilitiespbrij is in that quadrant:
p0i pci
!
2 Qkl , 0
@
~i
~i +v0i
~i c=100
~i +vci 1
A2Qkl (4)
Qkl = [qk; qk+1) [ql; ql+1)
!
(5)
In the implemented model, the intervals are de…ned, in percentage terms, as [0;5); [5;15); [15;25) ; :::; [95;100]: These intervals allow for rounding to the nearest ten. The interval response model is the simplest way of accommodating rounding that is compatible with the guesswork of calculating probabilities.
With additional assumptions on the cross-sectional distribution of in ~i and ~i, this model allows for estimating moments of the relevant heterogeneity in ~i and ~i. We assume that ~i is normally distributed and ~i follows a two-point distribution. We estimate the conditional mean of the normal distribution, the conditional standard deviation of the normal distribution, and the probability of the low point conditional on the right-hand-side variables.
The expected value of ~i across respondents is speci…ed as a linear combination of right hand-side variables, with parameter vector . Unobserved heterogeneity in ~i is assumed to follow a normal distribution with zero mean and standard deviation that is allowed to be related, in a linear fashion, to the right hand-side variables, with parameter vector u: This heteroskedasticity speci…cation in ~i allows for estimating di¤erences in disagreement by groups de…ned by the observable characteristics. Heterogeneity in ~i is speci…ed as a two-point distribution with the lower point …xed to the historical standard deviation, the upper point estimated as the same scalar for everyone, and the probability of the upper point speci…ed as a probit model with parameter on the observable characteristics.
~i = + 0xi+ui (6)
u i N(0;exp ( 0uxi)) (7)
~i 2 f~low;~highg (8)
Pr (~i = ~low) = ( 0 xi) (9)
The model can be estimated by Maximum Likelihood. The details of the likelihood function are provided in section A3 in Appendix A.7
7The speci…cation of~i is di¤erent between the three chapters, with a minor technical di¤erence between Chapters 2 and 3 and a more substantive di¤erence in Chapter 4. In The description above is correct for Chapter 2. In Chapter 3, heterogeneity in ~i is modeled as a two-point distribution, very similarly, only it is not the probability of the low point but the probability of the high point that is speci…ed. Of course, that is a minor technical di¤erence that a¤ects the interpretation of the coe¢ cients but not the identi…cation or estimation. However, in Chapter 4, heterogeneity in ~i is speci…ed as a log-linear function of right-hand-side variables, see equation (36). The parameters of that latter speci…cation are more di¢ cult to identify than parameters of the two-point speci…cation. Consequently, the two-point distribution is the preferred speci…cation. Despite its apparent restrictions, the two-point distribution is rather ‡exible (see, for example Heckman and Singer, 1984). Despite their di¤erences, the two approaches yield qualitatively very similar estimates, as the parameters on the demographic right-hand-side variables demonstrate (compare,
With the exception of ;the parameter estimates from the structural econometric model are not easy to interpret. At the same time, we can use the estimates to compute predicted values of ^i and ^i for each respondent. The predictions use the estimates of the structural econometric model and the observable right hand-side variables as well as the observed probability answers. In formulae,
^i = Eb[~ijxi;(p0i; pci)2Qkl] (10)
^i = Eb[~ijxi;(p0i; pci)2Qkl] (11) The conditional expectations are relatively straightforward to compute by Bayes’ rule with the results of the structural model that speci…es the full distributions for ~i and ~i. The predicted ^i and ^i are then the sample analogues to those conditional expectations.
The details of the derivation are provided in section A3. in Appendix A. This prediction method is analogous to the prediction of risk tolerance based on survey answers to hypothet- ical gambles by Kimball, Sahm and Shapiro (2008). The predicted values are di¤erent from the true values, creating measurement error in the variables. The measurement error is one of prediction error. The measurement error has zero mean and thus leads to an unbiased estimate of the population mean; however, the measurement error leads to an underestima- tion of the population standard deviation (because the predicted values are less dispersed than the true values). Using ^i and ^i on the right-hand side of a regression leads to con- sistent estimates as long as all the covariates used in the predictions are also entered in the respective regression. The standard errors in this regression are inconsistent, though; thus, bootstrap standard errors are advised. If one uses the ^i and ^i in regressions that have di¤erent covariates from the ones used in the prediction equations, OLS is inconsistent and a more sophisticated GMM procedure is appropriate (see Kimball, Sahm and Shapiro, 2008, for more details).
In all three chapters, the results from using the structural estimation method are quali- tatively similar to, but stronger than, results using reduced-form linear regressions with the probability questions. The structural results withp20 as the second variable (in Chapter 3) are very similar to the results withp10 as the second variable (in Chapter 2) , except that the former show substantially larger variation in ~i. Altogether, these results provide validity to the structural model. However, if the second probability variable is based on a negative threshold (as in the data description part of Chapter 4 and the robustness checks reported in Appendix C), the survey noise appears to have very di¤erent patterns (note that v, the noise
for example, the coe¢ cient on the female variable in the equations for~ in Tables 3.12, 4.4 and the female variables combined with marital status in Table A4.1).
correlation parameter, is estimated in such cases instead of using the calibrated value from HRS 2002). This fact highlights the importance of appropriate evidence regarding survey noise, which we do not have in relation to the negative-threshold stock market probability answers.
1.4 Preview of the results
The substantive aims of Chapter 2 are to characterize the heterogeneity of the stock market beliefs of American households, to understand the sources of that heterogeneity and to establish its relation to household portfolios. We hypothesize that heterogeneity is the result of di¤erences in learning histories, which are in turn caused by di¤erences in returns to and costs of learning (as well as in initial conditions). People learn about …nance in general and the stochastic process of stock market returns in particular. The value of learning is proportional to savings, however, the costs are …xed. Consequently, people with higher earnings prospects should learn more than people with lower income prospects, especially if social security or de…ned bene…t pension plans provide enough retirement income for the latter. Di¤erences in the costs of learning and di¤erences in general attitudes may also be heterogenous, creating additional heterogeneity in learning outcomes. Initial conditions matter as well. People with very low expectations will be less likely to learn and will see their beliefs unchanged. Ultimately, those who learn will revise their initial beliefs to be more precise, closer to what historical series would imply, and learning makes beliefs less heterogenous. This explanation is a human capital argument applied to …nancial knowledge (as in Delavande, Rohwedder and Willis, 2008). This explanation can be also viewed as an application of the information choice theory of Veldkamp (2011).
In line with the methods section above, beliefs are characterized by the subjective mean and subjective standard deviation of the one year ahead log return on the stock market index (~i and ~i, respectively). The subjective mean and the subjective standard deviation are unobserved variables that we relate to the observed answers to two survey questions: one question about the probability that the stock market return would be positive (p0)and the other question about the probability that the returns would be 10 per cent or more (p10).
The chapter describes the noise features in the probability answers in detail and argues for why the evidence is consistent with random survey noise.
We verify the implications of the learning theory by empirical evidence on stock market beliefs using a sample of 55 to 64 years old respondents of the Health and Retirement Study.
Our sample consists of people who are at the peak of their asset accumulation process, and their beliefs and household portfolios are the result of their learning and investment his-
tory. We …rst show correlations and OLS regressions using observable answers to probability questions. Then we estimate the structural econometric model and estimate the theoret- ically interesting belief parameters conditional on the survey answers (analogously to the prediction of individual risk tolerance by Kimball, Sahm and Shapiro, 2009).
Our estimates show that respondents, on average, have low expectations and perceive risk to be high, however, there is substantial heterogeneity in expectations. Results from both the simple and the more structural analysis support the learning explanation. People who had stronger incentives to learn in the past indeed possess beliefs that are consistent with more learning. In particular, people with higher lifetime earnings, higher education, higher cognitive abilities, de…ned contribution as opposed to de…ned bene…t pension plans, and those who are more optimistic and less uncertain about things in general have stock market beliefs that are less heterogeneous, somewhat less uncertain and considerably closer to levels that historical time series would imply. Our results also show that people who did not have strong incentives to learn in the past are very pessimistic about stock market returns.
Expectations are shown to be strongly related to the portfolio choice of American house- holds. This result validates the survey’s expectation measures as measures of "real" ex- pectations as opposed to some arti…cial …gures. This result also underlines the potential importance of expectations in resolving the "stockholding puzzle" and maybe also the re- lated equity premium puzzle.8
Chapter 3 uses new data from the Health and Retirement Study to shed more light on heterogeneity in stock market expectations. In particular, this chapter considers two questions: (1) Are measures of …nancial knowledge, especially knowledge about past stock market returns, related to expectations about future stock market returns? (2) Are aspects of personality that are recognized to be important in psychology related to expectations about future stock market returns?
The …rst question is closely related to Chapter 2. The empirical analysis in that chapter shows that measures of incentives and personal characteristics are indeed related to expecta- tions about future returns. However, a lack of explicit information on the knowledge of the
8In his review paper, Micheal Hurd (2009) cites a parapgraph from a previous version of Chapter 2 (Kezdi and Willis, 2008): "We estimated relevant heterogeneity [in stock market expectations] and related it to household investment behavior, with the help of a simple portfolio choice model. Our results con…rm the validity of survey measures of expectations in predicting real behavior after measurement error is properly accounted for. A causal interpretation of the results suggest that heterogeneity in expectations leads to heterogeneity in stockholding, and low average expectations, high uncertainty, and large heterogeneity in expectations explain much of the stockholder puzzle." In order to make that statement more groudned, we need to estimate risk preferences together with expectations and analyze them jointly in portfolio choices.
history of stock market returns in the data used in that chapter prevents explicitly linking knowledge to future expectations. The results in this chapter …ll that gap.
The results provide strong support to the argument that knowledge of the history of stock market returns is a major determinant of expectations about future stock returns.
Those people who know that stocks have outperformed bonds and saving accounts in the past have beliefs about the distribution of future returns that are signi…cantly closer to the characteristics of the historical return distribution. Their expectations are, on average, positive (whereas expectations of other people are, on average, negative). Their belief about risks are also closer to historical risks than the beliefs of other people, although their beliefs are also substantially higher than historical risks. The results on disagreement (heterogeneity in expectations) provide additional support to the learning argument. Expectations of those people who know that stocks have outperformed bonds and saving accounts in the past are less heterogeneous than the expectations of the rest of the sample.
Other aspects of …nancial knowledge are also shown to be strongly related to stock mar- ket expectations, even conditional on our measure of knowledge about the history of stock returns. It is possible that the measure of other …nancial knowledge is just another proxy for the knowledge of the history because the measure for the latter is very imperfect. If this assumption is true, the results provide no additional insight into the substantive question but instead it shows how imperfect the …nancial knowledge measures are. Another possibility is that this result shows that stock market expectations are in‡uenced by other aspects of
…nancial knowledge even conditional on knowledge about the history of stock returns. Thus, people with a perfect knowledge of the history of stock returns may form di¤erent expec- tations about future returns if they have di¤erent levels of …nancial knowledge. Without further evidence, it is impossible to separate the two explanations.
Question two asks what other factors may be behind the heterogeneity in expectations.
This question focuses on standard aspects of personality. The psychology literature on personality aims at uncovering stable traits that a¤ect thinking, feeling, and acting. The literature has come to a consensus that postulates that …ve major dimensions describe per- sonality on a broad level: Agreeableness, Conscientiousness, Extraversion, Neuroticism, and Openness/Intellect. The collection of these dimensions is often called the "Big Five person- ality traits." According to this consensus view, an individual’s scores in these 5 dimensions characterize stable patterns of thoughts and feelings, and those scores are widely used to predict individual behavior.
Another personality trait that is likely to be related to stock market expectations is optimism. General optimism, as a stable personality trait, is de…ned as "a generalized ex- pectancy that good, as opposed to bad, outcomes will generally occur when confronted with
problems across important life domains" (Scheier and Carver, 1985). The assumption that general optimism should be related to stock market expectations is motivated also by with earlier work of mine with Robert J. Willis on optimism (Kézdi and Willis, 2003). That analysis showed that a combined measure of optimism about various events is positively related to many positive life outcomes, even conditional on many other personal charac- teristics (including education or cognitive scores). A remarkable …nding of that analysis is the association of sunshine optimism with many life outcomes. That measure was de…ned by comparing people’s subjective probability assessment of the day following the interview being sunny to actual sunshine data for the day in question. Chapter 2 in this dissertation shows similar results: sunshine optimism is positively correlated with stock market expectations even conditional on many personal characteristics, including education, cognitive capacity and lifetime earnings.
The results with respect to personality are largely negative, except for optimism. Four of the Big Five personality traits (Agreeableness, Conscientiousness, Extroversion and Neu- roticism) appear not to be related to stock market expectations. The …fth trait, Openness is associated with the level of expectations; however, that association becomes insigni…cant conditional on gender and education. In contrast, general optimism is signi…cantly associated with the level of stock market expectations (but not perceived risk or disagreement). This last result is in line with intuition and our previous results on sunshine optimism. However, the relationship appears to be signi…cantly stronger among people who do not own stock market-based assets. This …nding suggests that the role of optimism is rather complex in shaping expectations and needs further investigation.
Altogether, the results of Chapter 3 imply that …nancial knowledge in general, and knowl- edge about the history of stock returns in particular, are an important determinants of ex- pectations about future stock returns. There is substantial heterogeneity in expectations conditional on …nancial knowledge; however, understanding that variation proves to be dif-
…cult and requires further research.
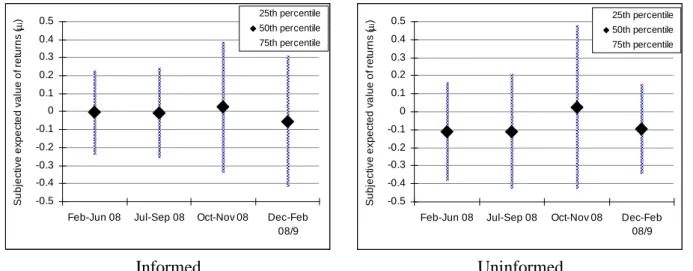
Chapter 4 asks whether and how people’s stock market expectations were a¤ected by the stock market crash in September 2008 in the United States. The analysis uses data from the 2008 wave of the Health and Retirement Study to study the impact of the stock market crash on people’s expectations. We estimate the e¤ect of the crash on the population average of expected returns, the population average of the uncertainty about returns (subjective standard deviation), and the cross-sectional heterogeneity in expected returns (an indicator of disagreement). We show estimates from simple reduced-form regressions on probability answers as well as from a more structural model that focuses on the parameters of interest and separates survey noise from relevant heterogeneity. The measurement strategy makes
use of the fact that the respondents of HRS 2008 answered the survey during 12 months from February 2008 to February 2009, a time period that includes the time of the stock market crash in early autumn. We show that the date of interview is largely independent of the respondents’ past expectations about the stock market, so even if the date of interview is non-random it is unlikely to bias our results.
Our results imply a temporary increase in the population average of expectations right after the crash. At the same time, average uncertainty increased, perhaps as the result of increased stock market volatility. Our most robust …nding is that cross-sectional heterogene- ity in expected returns, an indicator of the amount of disagreement, increased substantially with the stock market crash. The e¤ects are found to be largest among stockholders, those who follow the stock market, and those with higher than average cognitive capacity. The result on average expectations thus masks a wide distribution of e¤ects of opposing signs. We also document the co-movement of stock market expectations with ex post returns, implied volatility and volume of trade.
Our …nding suggests that there is heterogeneity in the cognitive processes (or mental models) people use to convert public news into personal probability beliefs, in accordance with some of the disagreement literature we mentioned above. The results on changes in heterogeneity complement recent empirical investigations that show substantial heterogene- ity in stock market expectations of individual investors (Vissing-Jorgensen, 2003) as well as households (Calvet et al., 2007, 2009a,b; Dominitz and Manski, 2007; Kezdi and Willis, 2008; Hurd et al., 2011; Gouret and Hollard, 2011). The …ndings of this chapter add new results to this empirical literature by showing that the stock market crash and the …nancial crisis had signi…cant e¤ects on average expectations, average uncertainty, and, perhaps most importantly, the heterogeneity of expectations.
2 Heterogeneity in expectations about future stock re- turns, learning incentives and portfolio choice
Acknowledgement 1 This section is an updated version of a previous paper coauthored with Robert J. Willis. The title of that previous paper was "Household Stock Market Beliefs and Learning" and it was published as NBER Working Paper 17614.9 The paper was featured in VOX, the policy and popular-research economics portal of the Centre for Economic Policy Research10.
9http://www.nber.org/papers/w17614.pdf
10http://www.voxeu.org/article/beliefs-and-stock-market
Support from the National Institute of Aging (PO1 AG026571 and RO3 AG29469) is ac- knowledged. The authors thank Andras Fulop, Krisztina Molnar, Matthew Shapiro, Adam Szeidl, and seminar participants at Central European University, CERGE-EI Prague, NBER, the University of Michigan, the University of Munich, the EEA/ESEM 2008 meetings, and the First Jackson Hole Conference on Subjective Probabilities for their comments. Péter Hudomiet provided excellent research assistantship and many valuable comments.
2.1 Introduction
Beliefs about stock market returns are important determinants of households’ investment behavior. Recent research has established the strong relationship between beliefs and stock- holding, and it also documented substantial heterogeneity in those beliefs (Vissing-Jorgensen, 2004; Dominitz and Manski, 2005 and 2007; Amromin and Sharpe, 2006). This heterogeneity is puzzling since stock returns are publicly observable, and all of its history as well as many analyses are public information. Understanding the source of heterogeneity is important to understand heterogeneity in household …nances, which is substantial (Campbell, 2006).
The goal of this paper is to characterize heterogeneity of the stock market beliefs of American households, understand the sources of that heterogeneity, and establish its rela- tion to household portfolios. Our substantive contribution is to provide a more systematic account of the heterogeneity than the previous literature and relate it to a relatively simple explanation. Our methodological contribution is to estimate structural belief parameters from noisy survey answers to probability questions of the type advocated by Manski (2004).
We hypothesize that heterogeneity is the result of di¤erences in learning histories, which are in turn caused by di¤erences in returns to and costs of learning (as well as in initial conditions). People learn about …nance in general and the stochastic process of stock market returns in particular. The value of learning is proportional to savings, but the costs are …xed.
As a result, people with higher earnings prospects should learn more than people with lower income prospects, especially if social security provides enough retirement income for the latter. Di¤erences in the costs of learning and di¤erences in general attitudes may also be heterogenous, creating additional heterogeneity in learning outcomes. Initial conditions matter, too. Those with very low expectations will be less likely to learn and will see their beliefs unchanged. In the end, those who learn will revise their initial beliefs to be more precise, closer to what historical series would imply, and learning makes beliefs less heterogenous. This is a human capital explanation applied to …nancial knowledge (as in Delavande, Rohwedder and Willis, 2008). It is also an application of the information choice theory of Veldkamp (2011).
We characterize beliefs by the subjective mean and subjective standard deviation of the
one year ahead log return on the stock market index. These are unobserved variables that we relate to observed answers to two survey questions: one about the probability that the stock market return would be positive and the other one about the probability that the returns would be 10 per cent or more. Our structural estimation model accounts for survey response error due to rounding, potential inattention, and the unwillingness or inability to make the necessary e¤ort to give precise answers. A subset of the respondents in our sample answered the same pair of questions twice in the survey, about half an hour apart, which allows us to calibrate the moments of survey noise in a direct way.
We verify the implications of the learning theory by empirical evidence on stock market beliefs using a sample of 55 to 64 years old respondents of the Health and Retirement Study.
Our sample consists of people who are at the peak of their asset accumulation process, and their beliefs and household portfolios are the result of their learning and investment his- tory. We …rst show correlations and OLS regressions using observable answers to probability questions. Then we estimate the structural econometric model and estimate the theoret- ically interesting belief parameters conditional on the survey answers (analogously to the prediction of individual risk tolerance by Kimball, Sahm and Shapiro, 2008). Our structural model separates survey noise from relevant heterogeneity.
Our estimates show that respondents have low expectations and high perceived risk on average and substantial heterogeneity in expectations. Results from both the simple and the more structural analysis support the learning explanation. People who had stronger incentives to learn in the past indeed possess beliefs that are consistent with more learning. In particular, people with higher lifetime earnings, higher education, higher cognitive abilities, de…ned contribution as opposed to de…ned bene…t pension plans, and those who are more optimistic and less uncertain about things in general have stock market beliefs that are less heterogeneous, somewhat less uncertain and considerably closer in levels to what historical time series would imply. Our results also show that the people who did not have incentives to learn are very pessimistic about stock market returns.
On top of the small literature on beliefs, many papers have looked at reduced-form asso- ciations of stock market participation with demography, education and wealth (Ameriks and Zeldes, 2004; Guiso, Haliassos, and Jappelli, 2002), cognitive capacity (Christelis, Jappelli and Padula, 2010), health (Rosen and Wu, 2003), or social interactions (Guiso, Sapienza and Zingales, 2004; Hong, Kubik and Stein, 2004). The results of our theoretical explana- tion and our empirical investigation are all in line with the results of that literature. They also suggest that part of those reduced form associations may operate through di¤erential incentives for learning about attainable stock returns.
The rest of this chapter is structured the following way. Section 2.2 contains a brief
characterization of stock market beliefs. Section 2.3 summarizes the setup and the most important implications of a simple theoretical model of household portfolio choices with learning. We then describe our data as brie‡y as possible in Section 2.4, and move on to descriptive evidence on the probability answers themselves in Section 2.5. Section 2.6 covers the estimation of the structural parameters of beliefs and their association with stockholding and the right hand-side variables. Section 2.7 concludes. Appendix A presents the details of our investigation, divided into four sections. Appendix section A.1 contains the formal structure of our theoretical model and its results. Appendix section A.2 shows more details of our data, descriptive statistics and results from linear regressions on observables. Appendix section A.3 contains the details of the structural estimation model, and Appendix section A.4 contains detailed estimation results and robustness checks.
2.2 Characterizing stock market beliefs
We assume that people believe that yearly log returns are i.i.d. and normally distributed.
Throughout the paper we denote the mean of log returns as and the standard deviation as . For example, = 0:1 means that the mean return is approximately ten per cent. At yearly frequency, the i.i.d. normal assumption for log returns lines up well with historical data available respondents to the 2002 wave of the survey we analyze. In the period of 1945 to 2002, yearly log nominal returns of the Dow Jones index were characterized by a mean of
= 0:07and a standard deviation of = 0:15. Di¤erent windows can give lower and higher values of , and the value of is remarkably stable.
Under the i.i.d. lognormality assumption, the beliefs of individualiabout the stock mar- ket returns are fully characterized by her beliefs about the mean and the standard deviation, and we denote those subjective beliefs by ~i and ~i. We de…ne ~i and ~i as the parameters that would characterize individual beliefs in investment situations. The goal of this paper is to characterize heterogeneity in ~i and ~i , understand the sources of that heterogeneity, and establish its relationship to heterogeneity in household portfolios.
~i and ~i are unobserved in our data (the Health and Retirement Study). Instead, we observe answers to probability questions. In the larger part of the sample that we use to show descriptive statistics, one question was asked. This question(p0) asked what the respondent thought the probability is that the market will go up. In the sample that we use for the structural analysis, we have answers to another probability question as well(p10), about the probability that the market will go up by at least 10 per cent. The questions themselves were phrased the following way.
p0 question: By next year at this time, what is the percent chance that mutual fund shares