DETERMINANTS OF DEPRIVATION IN TURKEY, A LOGISTIC REGRESSION ANALYSIS
Emese Bruder1, Csilla Obadovics2, Hakan Unal3
1assistant professor, 2full professor, 3PhD candidate,
1Faculty of Economics and Social Sciences, Szent Istvan University, 2Alexandre Lamfalussy Faculty of Economics, University of Sopron, 3PhD Candidate, Doctoral School of
Management and Business Administration, Szent Istvan University
E-mail: 1bruder.emese@gtk.szie.hu, 2obadovics.csilla@uni-sopron.hu, 3unal.hakan@phd.uni- szie.hu
Abstract
The main goal of this paper is to analyse factors which increase the probability of becoming poor, as well as to estimate which characteristics raises the risk of becoming poor. We use a logit model, which is a flexible way to seek determinants of a phenomena. None of the poverty literature denies the role of education and employment status in becoming poor. However, we test the contribution of other explanatory variables to look at poverty from different approaches.
Deprivation index will be used as measure of poverty. We use 2016 wave of SILC data provided by Turkish Statistical Institution.
Keywords: Poverty, Deprivation, Logit model, Determinants of poverty, Turkey JEL classification: I32, J11, C31
LCC: HM706
Introduction
The most simple definition of poverty determines the term as those individuals, who can not meet their basic needs as human beings. The newest debate on poverty addresses the question whether it is a household level or an individual level concept, as well as linked areas of life, like social, economic also environmental aspects should be taken into consideration when measuring poverty. Researchers have been approaching poverty issue in different aspects as well as the world largest organizations such as World Bank.
In light of previous studies, we define poverty with a complex concept that includes different dimensions of deprivation, such as the lack of material resources to finance an average life, as well as insufficiency of goods. The definition of poverty in Turkey is determined by Turkish Statistical Institute. As we have mentioned earlier, the concept of poverty is a rather multidimensional phenomenon. That is to say, an individual considered as poor by evaluating his or her personal condition in relation with other social or economic situations in which he/she lives currently. Poverty stands out as a critical problem that is still threatening the whole world.
Both developed and developing countries were concerned with this issue.
The importance of this study is, that there is a lack of empirical studies in Turkey which indicates the situations of the households or individuals in terms of poverty. We think that this paper will contribute significantly to have a deeper understanding about the complex poverty concept. We point out the poverty status of households by determining the factors that may affect the standard of living and reveal the probability of household level poverty in Turkey.
For these purposes, we use a logit model to explain the major causes of deprivation in Turkey.
We use Statistics on Income and Living Conditions (SILC) survey 2016 wave provided by Turkish Statistical Institute.
Literature review
The most common question in poverty studies is to know “What are the causes of poverty?” or
“What is the source of poverty?”. To answer these questions, we should first look at the availability of data. Most of the studies carried out in Turkey used the Household Budget Survey (HBS) to answer these questions. So that, part of the studies look at the causes in expenditure point of view. Although, European studies most commonly use the Statistics on Income and Living Conditions (SILC) survey. Some studies have been done on this data designing a logistic regression model to find out what are the causes of poverty. Variables that explain the effect of the given factors on poverty were gender, educational level and age. Almost all studies use gender as a possible factor of poverty. In poverty studies, it is well known, that educational level has a significant impact on poverty. For example, Janjua and Kamal (2011) examined the parameters of the educational level of household head. If it increases, household poverty gets less likely. Other studies in Turkey have been carried out using the Household Budget Survey collected by the Turkish Statistical Institute (TUIK). Kızılgöl and Demir (2010) used this data determining parameters of poverty based on consumption and expenditure of the households between 2002 and 2006. The study used a logit model with time series data. This research showed that poverty risk decreases as age and education of the household head rises.
Poverty is a rather wide concept; some studies have focused on different aspects. Acar (2014) used the Income and Living Condition survey provided by TUIK. He studied the dynamics of multidimensional poverty over years between 2007 and 2010. The used multidimensional poverty measure contains various variables (labour market participation, housing, health and living standards) on the dimensions of individuals to determine who is poor in Turkey. The study also examines the dynamics of multidimensional poverty in order to identify the dimensions of poverty. His paper also put focus on how the new measure differs from other existing poverty measures, when using the random effect probit model. The findings show that the new measure is partly consistent with other measures and that multidimensional poverty has decreased during the 2007-2010 period. Higher schooling time, owning a home, or ownership or leasing of an asset reduced the likelihood of being poor, while large households were found to reduce the likelihood of being enrolled to agricultural employment or social welfare.
Some other studies have put their focus on employment status. Çağlayan and Dayıoğlu (2011) examined a sample to look at the determination of the poverty status and household living standards in Turkey as well as the chances of becoming poor using data of TUIK Household Budget Survey for 2008. They applied the logit model in their study to find the most crucial indicators for parametric and semi parametric variables. He concludes that most of the indicators triggered the poverty increase were: working status, occupation of the household head, income as well as the rate of employed members in the household.
To bring poverty in wider concept, we would like to mention some other European studies, for example, Bruder (2014) has examined the poverty with the deprivation index. She has modified the deprivation index for European counties using Statistics on Income and Living Conditions survey. She has modified some determinants of deprivation such as owning a phone. She argues that it is not a sign of deprivation anymore in Europe, since very low percentage of adults do not own a phone. She has replaced some indicators according to her purposes and created Deprivation2010 index.
However, some other researchers think that poverty is not only associated with income, but sociological factors are also influential. McCullough and Baulch (2000) have studied generalized linear model (GLM) to measure relative poverty threshold in Pakistan. They studied different factors affecting the poverty and income poverty, and they found that household size, educational level and location of the region were determinants of poverty. In Canada, Finnie and Sweetman (2003) employed constant effects and logit model estimations on relative poverty threshold, and concluded that, as of data of 1995 and 1996 both men and women being married is a decreasing factor on poverty in Canada. Fourage and Layte (2003) made a study for European countries and found that education and number of household members have significant effect on poverty. The study of Dimitry (2003) showed, that in Russia, being head of family in young age and the backwardness of educational level showed to increase the possibility of being poor in addition to health problems and unemployment status, which also affected the chance of poverty in a negative way. Smith (2003) estimated subjective poverty through a logit model - by analysing the welfare levels of five Soviet regions and between the Soviet Union, the U.S., and West Germany. He determined that the effects of increasing happiness were health, high income and being married. Aranz and Canto (2011) have found in Spain that the key for escaping from poverty is to increase the number of employed in the household, and households with two children have less chance to move away from poverty.
Oshio and Kobayashi (2011) have used subjective poverty and applied the logit model on Japanese data. They have found that being not poor and living happily is associated with income level, as well as employment and region of living of the inhabitants are important. Coromaldi and Zoli (2011) have also used logit model, and found that women are less like to be poor in Italy and among young citizens who are unemployed, divorced are at higher risk of poverty.
In Turkish studies we can see that research mostly focuses on relative poverty measurement.
For example, the analysis of the relative poverty by Dansuk and Ercan (1997) investigated factors like the level of education, gender, the sector where the household head is employed, and employment status. Kızılgöl and Demir (2010) also analysed relative poverty with a logit model on times series data for the years between 2002 and 2006. Their study showed, that household size, age and employment sector of household head, as well as educational level were the factors affecting poverty. Dumanlı and Recep (2002) used an absolute poverty measure, considering the purchasing power of the households. Unal and Bruder (2017) have used a similar deprivation approach with adjustments. They investigated causes of the deprivation in rural and urban areas and compared them across European countries.
Data and method
In our view, the most precise way to measure poverty is by looking at the deprivation index, where poverty could be taken into consideration in many perspectives. This index allows us to look at material deprivation from nine different aspects, these nine items will let us determine whether the individual is living in a poor household or no. The use of income, as a measure of poverty has been proven to serve as a fig leaf, it hides poverty (Bruder, 2013, Bruder et al.
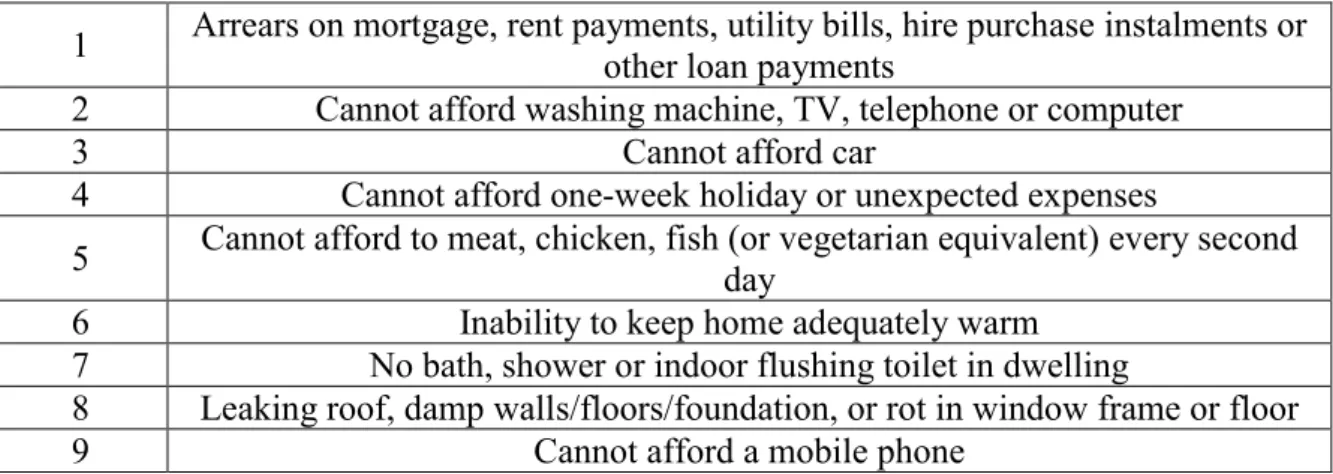
2011). Therefore, in our article, we use the method introduced by Eurostat, which is the official methodology applied by Eurostat (Eurostat, 2012). On the other hand, some of the scientist such as Bruder (2014) suggests, that some of the deprivation items are out of date and not applicable to measure deprivation anymore. For instance, the item “cannot afford a cell phone” is not an indicator of actual poverty. Although in this study, we used the official definition of deprivation accepted by the European Commission. We define a household being deprived if three or more conditions apply to it among the listed below.
Table 1: Deprivation items
1 Arrears on mortgage, rent payments, utility bills, hire purchase instalments or other loan payments
2 Cannot afford washing machine, TV, telephone or computer
3 Cannot afford car
4 Cannot afford one-week holiday or unexpected expenses
5 Cannot afford to meat, chicken, fish (or vegetarian equivalent) every second day
6 Inability to keep home adequately warm
7 No bath, shower or indoor flushing toilet in dwelling
8 Leaking roof, damp walls/floors/foundation, or rot in window frame or floor
9 Cannot afford a mobile phone
Source: own construction based on Eurostat, 2012.
The used data is the Turkish Statistics on Income and Living Conditions survey from 2016 year, which is freshest data at the moment provided by Turkish Statistical Institute (TUIK). This data is harmonised with the Eurostat data, same survey have been asked to the households and individuals. This database contains all necessary variables for identifying deprived households.
We are investigating the chances of being deprived in terms of few selected key variables. The independent variables of the logistic regression model are chosen based on two main criteria.
First, data availability in the SILC database was a key issue. Secondly, investigating the literature, and based on our own experience, we wanted to build a simple, but meaningful model. Before finalising the regression model we run several bivariate analysis in order to see which categories of our independent variables yield the least deprived population. With the help of crosstabulation, we were able to determine the reference categories for the logit model, i.e.
those categories were selected for reference, where the lowest rate of deprived appeared. During the model specification process, we faced many pitfalls, like missing data, low goodness-of-fit in sub-groups and low explained variance. The final model, what we presented in this paper meets all the requirements and assumptions of logistic regression.
The logistic regression analysis is conducted on the individual level dataset. The dependent variable of the model is deprivation, i.e. whether the individual is a member of a deprived household. The factors included to analyse the individual effect of each are mainly household and individual characteristics connected to general demographic indicators. Literature suggested that gender is not a significant determinant of being poor, but we decided to include sex of the individual to the analysis, to be able to control for the gender differences of employment and educational level. Work intensity of the individual is defined as people living in households with very low work intensity i.e. people of all ages (0–59 years) living in households where the members of working age worked less than 20% of their total potential time during 12 months prior to the survey. The analysis is made by applying the individual cross-sectional weights. Total sample size is 53077 individuals. Based on our result 47.2% of Turkish population is deprived, the same rate has been announced by Eurostat.
Results
In this section of the paper we will show the results of the bivariate analysis concerning deprivation and different demographic variables. It is important to look at the associations between these variables, to see the uncontrolled relationship between the variables. In the logit model, we determined the reference categories by choosing that category, which have the less
likelihood to cause deprivation. Using crosstabulation and Chi2 test, we can see sub-categories of the independent variables in relation with the deprivation indicator.
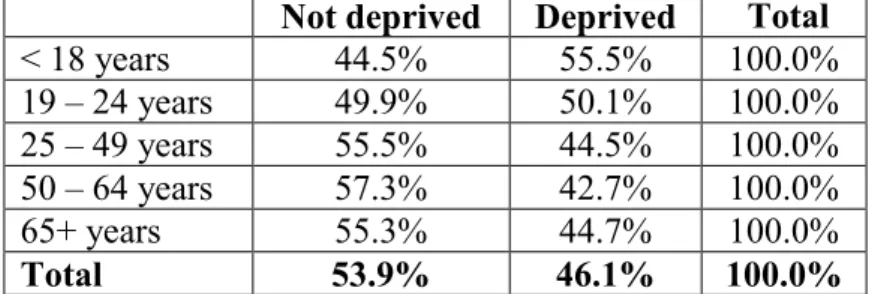
Table 2: Percentage of deprived population in different age categories in Turkey, 2016 Not deprived Deprived Total
< 18 years 44.5% 55.5% 100.0%
19 – 24 years 49.9% 50.1% 100.0%
25 – 49 years 55.5% 44.5% 100.0%
50 – 64 years 57.3% 42.7% 100.0%
65+ years 55.3% 44.7% 100.0%
Total 53.9% 46.1% 100.0%
Note: N=53077, Chi2=351.38, p<0.01 Source: own calculation based on SILC2016
In Table 2, we can observe, that those, who are aged between 50 and 64 are less likely to be deprived (42.7%, compared to the 46.1% observed in the total population), hence this will be our reference category. In the youngest generation, who are below 18 years old, most of them (55.5%) is deprived, which is significantly higher compared to the other age groups.
Interestingly, we assume that older people have a relatively favourable situation due to the retirement benefits and social protection benefits.
Table 3: Percentage of deprived population by gender in Turkey, 2016 Not deprived Deprived Total
Male 54.4% 45.6% 100.0%
Female 53.4% 46.6% 100.0%
Total 53.9% 46.1% 100.0%
Note: N=53077, Chi2=4.625, p<0.05 Source: own calculation based on SILC2016
In society, we all assume that female has less advantages in terms of income, employment, and political participation. As it is shown in Table 3, it is indicated that female seems to be more likely to be deprived. On this statement, we will set our reference category to male, since they are less likely to live in a deprived household. In other words, we will investigate how much more chance a female has to be deprived compared to a male.
There is no question about the relationship between employment status and poverty. Work intensity of the households is a major factor when we look at causes of poverty. The work intensity (WI) of a household is the ratio of the total number of months that all working-age household members have worked during the income reference year and the total number of months the same household members theoretically could have worked in the same period. A working-age person is a person aged 18-59 years, with the exclusion of students in the age group between 18 and 24 years. ‘At work’ comprises: a) In paid employment, whether full-time or part-time b) Including paid apprenticeship or training under special schemes related to employment c) In self-employment (with or without employees) d) Including unpaid work in family enterprise. The following classification is used for the work intensity levels of the household: High work intensity: 0.55 ≤ WI < 0.1; Medium work intensity: 0.45 ≤ WI < 0.55;
Low work intensity: 0.2 ≤ WI < 0.45; Very low work intensity: 0 < WI < 0.2; Jobless households: WI=0.
Table 4: Percentage of deprived population by work intensity (WI) of the household in Turkey, 2016
Not deprived Deprived Total
Jobless Household 49.1% 50.9% 100.0%
Very low work intensity 34.9% 65.1% 100.0%
Low work intensity 41.7% 58.3% 100.0%
Medium work intensity 54.8% 45.2% 100.0%
High work intensity 67.7% 32.3% 100.0%
Total 53.7% 46.3% 100.0%
Note: N=51268, Chi2=1638.86, p<0.01 Source: own calculation based on SILC2016
Based on this definition, in Table 4, we can see, that jobless households in Turkey are not as affected by deprivation as those households, who are characterised with very low work intensity. A possible reason for this phenomena, is that jobless households are protected by social laws and are under social protections. Surprisingly, those households who has high work intensity still appears in society, 32.3% of the individuals who are living in a high work intensive household, are living in a deprived household, although, you might think that all members of these household have enough resources. In the same time, high work intensity households are those, who has the least likelihood to be deprived compared to other type of households. Consequently, in our logit model high work intensity will be the reference category.
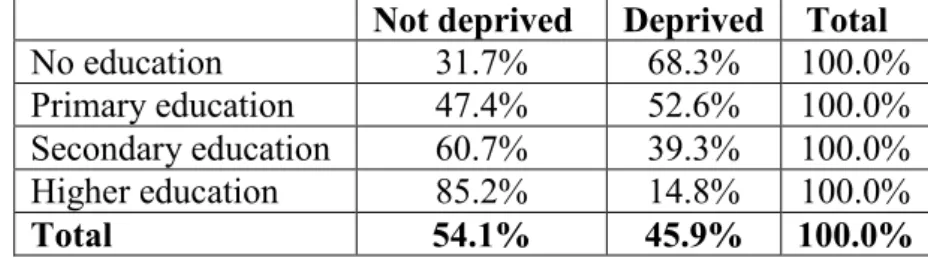
Educational level of the individuals is another essential factor when we want to know what makes a person poor. As of the 2016 wave of SILC data, 16,9% of individuals in Turkey have no education attained, and another 41,1% has primary education. Having low levels of education clearly increases the chance to be poor.
Table 5: Percentage of deprived population by educational level in Turkey, 2016
Not deprived Deprived Total
No education 31.7% 68.3% 100.0%
Primary education 47.4% 52.6% 100.0%
Secondary education 60.7% 39.3% 100.0%
Higher education 85.2% 14.8% 100.0%
Total 54.1% 45.9% 100.0%
Note: N=51345, Chi2=4008.4, p<0.01 Source: own calculation based on SILC2016
In case of Turkey, not surprisingly, to become a deprived person is almost inevitable, if the person does not have education, 68,3% of individuals without education is deprived. There is no protection for this group in society, they have very high chance to be deprived. The higher the educational level is, the lower the chance to be poor. So that, we will investigate in our logit model using higher education as a reference category since we found that those who have higher education are less likely to be poor in Turkey. The result is not surprising, it is certain that people who have better educational attainment will have better living standards compared to ones who do not have higher education. Although the unique effect of educational level can only be tracked if looking at its effect in a logit model.
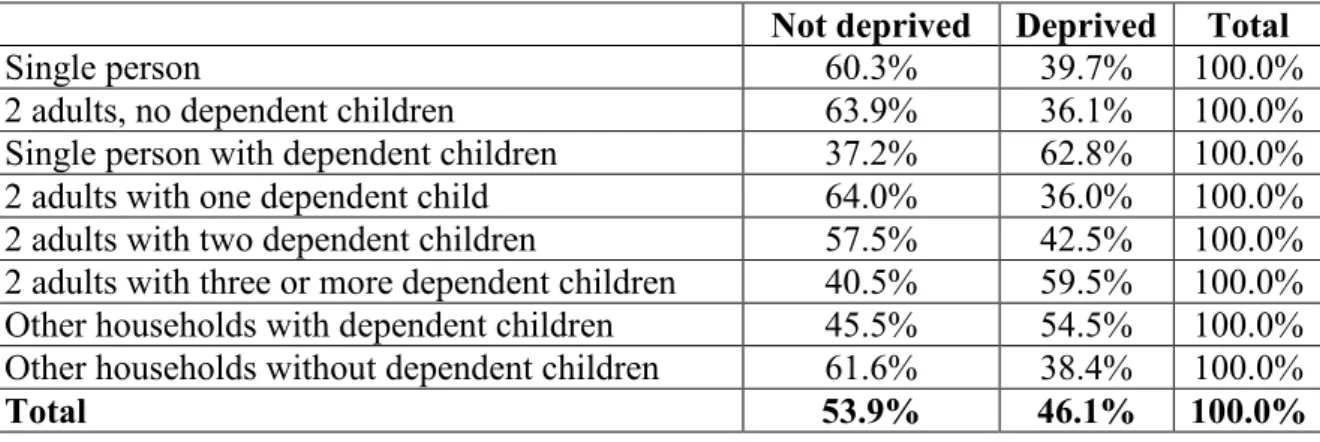
Table 6: Percentage of deprived population by household type in Turkey, 2016 Not deprived Deprived Total
Single person 60.3% 39.7% 100.0%
2 adults, no dependent children 63.9% 36.1% 100.0%
Single person with dependent children 37.2% 62.8% 100.0%
2 adults with one dependent child 64.0% 36.0% 100.0%
2 adults with two dependent children 57.5% 42.5% 100.0%
2 adults with three or more dependent children 40.5% 59.5% 100.0%
Other households with dependent children 45.5% 54.5% 100.0%
Other households without dependent children 61.6% 38.4% 100.0%
Total 53.9% 46.1% 100.0%
Note: N=53077, Chi2=1697.08, p<0.01 Source: own calculation based on SILC2016
In Table 6, the association between household type and deprivation is shown. It allows us to see the difference between different types of households, and we can also observe to what extent having children influence the household to become deprived. Turkey is a middle eastern country, where having a big family is a cultural characteristic (Kagitcibasi−Ataca. 2015). It is important to see how much this cultural norm influences the deprivation of the households. One of the most interesting observations, is that having a child increases the probability of being deprived, especially, where there is only one adult in the household.
Secondly, when we look at the single person with dependent children, this characteristic puts the household especially at risk, having a child makes you deprived in Turkey if you are a single. On the other hand, those households, who have two adults with three or more dependent children are also having a high likelihood to be deprived compared to single person households.
Other household types, such as two adults with no dependent children have the least likelihood to be poor compared to a single person household.
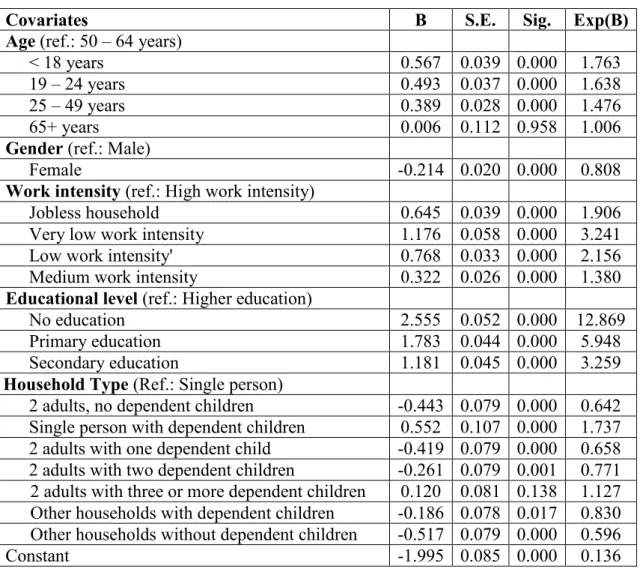
After choosing the reference categories, we would like to see the unique effect of each variable, while controlling for the other variables. As we have mentioned earlier, we apply a binary logistic regression model to reach this. Our outcome variable is the deprivation index as we have indicated earlier, which is a dichotomy variable where individuals living in a deprived household is coded with 1, and those who are not living in a deprived household is coded with 0. Logistic regression expresses the relationship between an outcome variable (deprivation index) with each predictors. The logistic regression not only gives a measure of how relevant a predictor is but also its direction of association (positive or negative), it helps us to uncover hidden relationships in the data. Table 7 shows the results of this binary logistic regression model.
Table 7: Determinants of becoming deprived in Turkey based on main household and individual characteristics (results of logistic regression model), 2016
Covariates B S.E. Sig. Exp(B)
Age (ref.: 50 – 64 years)
< 18 years 0.567 0.039 0.000 1.763
19 – 24 years 0.493 0.037 0.000 1.638
25 – 49 years 0.389 0.028 0.000 1.476
65+ years 0.006 0.112 0.958 1.006
Gender (ref.: Male)
Female -0.214 0.020 0.000 0.808
Work intensity (ref.: High work intensity)
Jobless household 0.645 0.039 0.000 1.906
Very low work intensity 1.176 0.058 0.000 3.241
Low work intensity' 0.768 0.033 0.000 2.156
Medium work intensity 0.322 0.026 0.000 1.380
Educational level (ref.: Higher education)
No education 2.555 0.052 0.000 12.869
Primary education 1.783 0.044 0.000 5.948
Secondary education 1.181 0.045 0.000 3.259
Household Type (Ref.: Single person)
2 adults, no dependent children -0.443 0.079 0.000 0.642 Single person with dependent children 0.552 0.107 0.000 1.737 2 adults with one dependent child -0.419 0.079 0.000 0.658 2 adults with two dependent children -0.261 0.079 0.001 0.771 2 adults with three or more dependent children 0.120 0.081 0.138 1.127 Other households with dependent children -0.186 0.078 0.017 0.830 Other households without dependent children -0.517 0.079 0.000 0.596
Constant -1.995 0.085 0.000 0.136
Notes: N=51268
-2 Log Likelihood=62153.273 Pseudo R2 (Nagelkerke)=0.162
Source: own calculation based on SILC 2016
Considering age, it is obvious that it has a significant impact on being materially deprived. The general argument that has been considered by scientists mentioning that older people are less likely to be deprived seems to be true in Turkey too. After controlling for other demographic variables in the model, 65+ age category has no difference in terms of likelihood to become deprived compared to the reference category (50-64 years old). However, we have found that those who are below 18 years old are of high likelihood to be deprived compared to the reference category. Turkish youth generation (19-24 years old) also has disadvantages, they have more chance (e= 1.638) to be deprived compared to the adult generations.
In terms of work intensity, our reference category was those, who live in a household with high work intensity. A surprising result, is that after removing all other cross-effects with the logit model, individuals living in jobless households show less likelihood to become deprived compared to those, where someone works in the household. As we stated earlier one reason for this result is that unemployed households are under the protection of state social benefits.
However, more study needed to find other potential causes of this phenomenon.
Our model shows that in a micro-level, education has a significant impact on the likelihood of being in deprivation. People with no education has extremely high chance (e=12.869) to become deprived. But still, those who have graduated has a chance to be deprived, in Turkey which means that being a literate person as an individual does not mean you would not face financial difficulties. When we look at the results, it is shown that at individual level, even if you are graduated at secondary education you might face more financial difficulties (e= 3.259) compared to those, who have higher education.
Household type – being a significant determinant of deprivation – shows contradictions with the bivariate association. Single person household seems to be among the three most vulnerable household types in Turkey. After single person with dependent children, and two adults with three or more dependent children, single person household has the highest likelihood to become deprived. Other households are less likely to be poor compared to a single person household in Turkey.
Conclusion
The main goal of this paper was to establish poverty determinants, the factors which increase the probability of becoming poor, as well as to estimate which household or individual characteristics raises the risk of becoming poor. The reason why this study is important, because the determinants of less favourable living conditions have not been studied thoroughly in Turkey so far. Turkish economy is considered as a developing economy in Western Asia.
Looking at the poverty statistics of a country like Turkey is of high importance. Poverty should be looked at many aspects in order to draw deliberate conclusion for policy making. We consider that based on the SILC data this outcome will have a significant role to deeper understand Turkish poverty, since cross-effects are controlled for in the logit model. Although gender does not have a considerable effect on poverty status, we used the variable for controlling for its cross-effects with education and income. The main advantage of the applied logit regression in poverty studies, is that we can control for indirect effects of the factors being studied. Although it also has its disadvantages, the model necessarily neglect factors that are also important in producing poverty.
Deprivation is a key player in the standard of living in the country, it is not only explaining having goods and household equipment, but it indirectly shows income level and poverty too.
Studying poverty with the deprivation index yields similar associations across the society when using income level as a measure of poverty, although the rate of deprivation is much higher compared to the at-risk of poverty rate, which is a relative measurement method, with taking only income level into consideration. This suggests, that the decision about the poverty measurement methods will have a considerable effect on who is declared to be member of the poor population.
Based on our empirical evidence, there are important significant differences in the probabilities of being deprived in Turkey across many aspects. For example, the level of education of Turkish citizens is of high importance when looking at poverty chances. There is a high rate of illiterate, and uneducated individuals in Turkey compared to European countries, which gives them a very high chance to fall into deprivation, not being able to finance a decent life for their families.
Supporting education and preventing school leaving can reduce the rate of poverty in Turkey.
We used gender as a control variable for detecting the odds ratio of work intensity and educational level, since these variables are highly cross-related.
In terms of household type, we can conclude, that household type has less significance in terms of becoming poor compared to educational level. Having children has a negative effect on deprivation, but only above three children in the household. Regular household having one or two children has less likelihood to be deprived compared to household, where one adult lives alone.
In order to have a deeper understanding about the phenomena of deprivation in Turkey, further studies should be applied with different approaches, adding new predicting variables in the model for example looking at to what extent rurality affects deprivation, comparing households who live in rural and urban areas.
Based on the results of this paper it can be suggested for future researchers and policy makers, that looking only at descriptive statistics can vail real meaning of poverty, since individual and household level characteristics are much cross-related. Using a multivariate model for estimating causes of poverty is much more reliable, if the model is applied carefully and cautiously.
References
1. Acar, A. (2014): The Dynamics of Multidimensional Poverty in Turkey. Bahcesehir University Center for Economic and Social Research.
2. Aranz J. M. and Canto O. (2011). Measuring the Effect of Spell Recurrence on Poverty Dynamics-evidence from Spain, Journal of Economic Inequality, Vol. 9, pp .1-27 3. Bruder E. (2014): Who are the poor in Europe? An alternative to measuring poverty.
Területi Statisztika. Vol. 54 No. 2, pp. 152 – 171.
4. Bruder Emese (2013): Mit mutat a jövedelmi szegénység és miért? Paper: CD-ROM , 22 p. In: Székely, Csaba (szerk.) Felelős társadalom, fenntartható gazdaság:
Nemzetközi tudományos konferencia a Magyar Tudomány Ünnepe alkalmából:
Tanulmánykötet [Social responsibility, sustainable economy: international scientific conference on the occasion of the Hungarian Science Festival] Sopron, Magyarország : Nyugat-magyarországi Egyetem Kiadó, p. 1157
5. Bruder Emese, Obádovics Csilla, Síle, O'Dorchai, Daniele, Meulders (2011):
Methodological and conceptual difficultios of analysing the working poor population in Europe In: Balogh, László (szerk.) Sustainable economics, community strategies : 3rd International Conference of Economic Sciences, Kaposvár, Magyarország : Kaposvári Egyetem, pp. 25-33. , 9 p.
6. Çağlayan, E., & Dayıoğlu, T. (2011): Comparing the parametric and semiparametric logit models: Household poverty in Turkey. International Journal of Economics and Finance, 3(5), 197-207.
7. Coromaldi, M. and Zoli, M. (2011): Deriving Multidimensional Poverty Indicators:
Methodological Issues and Empirical Analysis for Italy, Social Indicators Research, Vol.104, No.1. pp: 1-18.
8. Dansuk Ercan (1997): Türkiye de Yoksulluğun Ölçülmesi ve Sosyoekonomik Yapılarla Ölçülmesi’’, Sosyal Sektörler ve Koordinasyon Genel Müdürlüğü Ücretler ve Gelirler Dairesi Başkanlığı, Devlet Planlama Teşkilatı.
9. Dimitry S. (2003): Below the Poverty Line: Duration of Poverty in Russia, Economics Education and Research Consortium Working Paper Series, No.03/04
10. Dumanlı Recep (2002): Türkiye'de Yoksulluk Sınırı ve Boyutları”in Yoksullukla Mücadele Stratejileri, Ed. Aktan C.C., Hak-İş Konfederasyonu Yayınları, Ankara.
11. Finnie R., Sweetman A. (2003): Poverty Dynamics: Empirical Evidence for Canada, Canadian Journal of Economics, Vol.36, No.2, pp.291-325.
12. Fourage D. and Layte R. (2003): Duration of Poverty Spells of Europe, EPAG Working Papers Number 47.
13. Janjua, P. Z., & Kamal, U. A. (2011): The role of education and income in poverty alleviation: A cross-country analysis. The Lahore Journal of Economics, 16(1), 143- 172.
14. Kagitcibasi, C. & Ataca, B. (2015): Value of Children, Family Change, and Implications for the Care of the Elderly. Cross-Cultural Research. Volume: 49 issue:
4, page(s): 374-392
15. Kızılgöl, Ö. A., & Demir, Ç. (2010): Türkiye’de yoksulluğun boyutuna ilişkin ekonometrik analizler (Econometric analyses of poverty dimension in Turkey).
Business and Economics Research Journal, 1(1), 21-32.
16. McCulloch, N. and Baulch, B. (2000): Simulating the Impact of Policy Upon Chronic and Transitory in Rural Pakistan, Journal of Development Studies, Vol.36, No.6, pp.100-130
17. Oshio T, Kobayashi M., (2011): Area Level Income and Individual Happiness:
Evidence from Japan, Journal of Happiness Studies, Vol.12, No.4, pp.633-649
18. Smith K., (2003): Individual Welfare in the Soviet Union, Social Indicators Research, Vol. 64, No. 1 pp.75-105.
19. Turkstat, (2016): Income and Living Condition Survey 2016, accessed at http://www.turkstat.gov.tr/PreTablo.do%3Falt_id%3D1011
20. Unal H, Bruder E, (2017): Causes of deprivation in regions with different urbanisation level, Vadyba Journal of Management, vol 31(2) pp:31-36